This article needs more links to other articles to help integrate it into the encyclopedia . (September 2018) (Learn how and when to remove this template message) |
The 2014 Tunbridge Wells Borough Council election took place on 22 May 2014 to elect members of Tunbridge Wells Borough Council in England. [1] This was on the same day as other local elections.
Tunbridge Wells Borough Council is the local authority for the Borough of Tunbridge Wells.
Party | Candidate | Votes | % | ± | |
---|---|---|---|---|---|
Conservative | Tom Dawlings | 876 | 42 | ||
Liberal Democrat | Francis Rook | 541 | 26 | ||
UKIP | Simon Hilton | 468 | 23 | ||
Labour | Isobel Kerrigan | 188 | 9 | ||
Majority | 335 | ||||
Turnout | 2,063 | ||||
Liberal Democrat gain from Conservative | Swing | ||||
Party | Candidate | Votes | % | ± | |
---|---|---|---|---|---|
Conservative | Alan McDermott | 930 | 65 | ||
UKIP | David Weatherley | 334 | 20 | ||
Labour | Kevin Kerrigan | 263 | 16 | ||
Liberal Democrat | Nancy Warne | 123 | 7 | ||
Majority | 596 | ||||
Turnout | 1,645 | ||||
Conservative hold | Swing |
Party | Candidate | Votes | % | ± | |
---|---|---|---|---|---|
Conservative | Chris Woodward | 577 | 46 | ||
UKIP | Alun Elder-Brown | 393 | 31 | ||
Labour | Clive Brewer | 196 | 16 | ||
Liberal Democrat | Christopher Jeffery | 95 | 8 | ||
Majority | 184 | ||||
Turnout | 1,256 | ||||
Conservative gain from Liberal Democrat | Swing | ||||
Party | Candidate | Votes | % | ± | |
---|---|---|---|---|---|
Conservative | Don Sloan | 988 | 47 | ||
UKIP | Patricia Underwood | 390 | 19 | ||
Liberal Democrat | Alan Bullion | 267 | 13 | ||
Green | Rick Leslie | 229 | 11 | ||
Labour | Veronica Wallace | 218 | 10 | ||
Majority | 598 | ||||
Turnout | 2,085 | ||||
Conservative hold | Swing |
Party | Candidate | Votes | % | ± | |
---|---|---|---|---|---|
Conservative | Nathan Gray | 940 | 51 | ||
UKIP | John Austen | 537 | 29 | ||
Green | Marie Jones | 139 | 8 | ||
Labour | David Burgess | 131 | 7 | ||
Liberal Democrat | Tom Deacon | 89 | 5 | ||
Majority | 403 | ||||
Turnout | 1,832 | ||||
Conservative hold | Swing |
Party | Candidate | Votes | % | ± | |
---|---|---|---|---|---|
Conservative | Bill Hills | 562 | 44 | ||
UKIP | Thomas Chetta | 471 | 37 | ||
Labour | Terry White | 144 | 11 | ||
Liberal Democrat | Mark Bicknell | 93 | 7 | ||
Majority | 91 | ||||
Turnout | 1,269 | ||||
Conservative hold | Swing |
Party | Candidate | Votes | % | ± | |
---|---|---|---|---|---|
Conservative | Elizabeth Thomas | 494 | 44 | ||
UKIP | Bob Davison | 350 | 31 | ||
Labour | Ray Moon | 219 | 19 | ||
Liberal Democrat | Matthew Warne | 71 | 6 | ||
Majority | 144 | ||||
Turnout | 1,131 | ||||
Conservative hold | Swing |
Party | Candidate | Votes | % | ± | |
---|---|---|---|---|---|
Conservative | James Scholes | 1,137 | 56 | ||
UKIP | Kit Read | 326 | 16 | ||
Labour | Lorna Blackmore | 297 | 15 | ||
Liberal Democrat | Geoffrey Bent | 284 | 14 | ||
Majority | 811 | ||||
Turnout | 2,033 | ||||
Conservative hold | Swing |
Party | Candidate | Votes | % | ± | |
---|---|---|---|---|---|
Conservative | Catherine Mayhew | 1,086 | 49 | ||
UKIP | Andrew Osborne | 488 | 22 | ||
Labour | Mary Wilson | 348 | 16 | ||
Liberal Democrat | Jacqueline Prance | 277 | 13 | ||
Majority | 598 | ||||
Turnout | 2,186 | ||||
Conservative hold | Swing |
Party | Candidate | Votes | % | ± | |
---|---|---|---|---|---|
Conservative | Paul Barrington-King | 853 | 41 | ||
UKIP | Colin Nicholson | 572 | 27 | ||
Independent | Terry Cload | 445 | 21 | ||
Labour | Margaret Morgan | 130 | 6 | ||
Liberal Democrat | Rachel Sadler | 92 | 4 | ||
Majority | 281 | ||||
Turnout | 2,088 | ||||
Conservative hold | Swing |
Party | Candidate | Votes | % | ± | |
---|---|---|---|---|---|
Conservative | Bob Backhouse | 813 | 47 | ||
UKIP | Stephen Lukacs | 578 | 33 | ||
Labour | Nick Maltby | 249 | 14 | ||
Liberal Democrat | Victor Bethell | 93 | 5 | ||
Majority | 235 | ||||
Turnout | 1,726 | ||||
Conservative hold | Swing |
Party | Candidate | Votes | % | ± | |
---|---|---|---|---|---|
Labour | Graham Munn | 602 | 32 | ||
Conservative | Peter Oakford | 591 | 32 | ||
UKIP | Richard Harrington | 486 | 26 | ||
Liberal Democrat | Marguerita Morton | 190 | 10 | ||
Majority | 11 | ||||
Turnout | 1,856 | ||||
Labour gain from Conservative | Swing | ||||
Party | Candidate | Votes | % | ± | |
---|---|---|---|---|---|
Conservative | Mike Rusbridge | 790 | 56 | ||
Labour | Nicholas Blackwell | 233 | 16 | ||
UKIP | Mark Nicholson | 219 | 15 | ||
Liberal Democrat | Jo Wright | 181 | 13 | ||
Majority | 557 | ||||
Turnout | 1,416 | ||||
Conservative hold | Swing |
Party | Candidate | Votes | % | ± | |
---|---|---|---|---|---|
Conservative | Julia Soyke | 1,255 | 61 | ||
UKIP | Nick Frydas | 396 | 19 | ||
Liberal Democrat | Robert Baldock | 201 | 10 | ||
Labour | Ann Tyler | 198 | 10 | ||
Majority | 859 | ||||
Turnout | 2,038 | ||||
Conservative hold | Swing |
Party | Candidate | Votes | % | ± | |
---|---|---|---|---|---|
Liberal Democrat | David Neve | 751 | 53 | ||
Conservative | Alex Lewis-Grey | 247 | 17 | ||
UKIP | Naz Mian | 246 | 17 | ||
Labour | Jaimi Lallu | 184 | 13 | ||
Majority | 504 | ||||
Turnout | 1,418 | ||||
Liberal Democrat hold | Swing |
Party | Candidate | Votes | % | ± | |
---|---|---|---|---|---|
Conservative | Jamil Nasir | 711 | 35 | ||
Liberal Democrat | Trevor Poile | 646 | 32 | ||
UKIP | Simon Ford-Forrester | 309 | 15 | ||
Labour | Timothy Rich | 187 | 9 | ||
Green | Phyl Leslie | 174 | 9 | ||
Majority | 65 | ||||
Turnout | 2,018 | ||||
Conservative gain from Liberal Democrat | Swing | ||||
Royal Tunbridge Wells, previously just Tunbridge Wells, is a town in western Kent, England, 30 miles (48 km) south-east of central London, close to the border with East Sussex upon the northern edge of the High Weald, whose sandstone geology is exemplified by the rock formations at the Wellington Rocks and High Rocks.
Tunbridge Wells is a constituency represented in the House of Commons of the UK Parliament since 2005 by Greg Clark, a Conservative who has served as Secretary of State for Business, Energy and Industrial Strategy since 14 July 2016.
Hawkenbury is a small village area located in the south east of Royal Tunbridge Wells, Kent, England.
One third of Tunbridge Wells Borough Council in Kent, England is elected each year, followed by one year without election. Since the last boundary changes in 2002, 48 councillors have been elected from 20 wards.
The 1998 Tunbridge Wells Borough Council election took place on 7 May 1998 to elect members of Tunbridge Wells Borough Council in Kent, England. One third of the council was up for election and the Conservative party gained overall control of the council from no overall control.
The 1999 Tunbridge Wells Borough Council election took place on 6 May 1999 to elect members of Tunbridge Wells Borough Council in Kent, England. One third of the council was up for election and the Conservative party stayed in overall control of the council.
The 2000 Tunbridge Wells Borough Council election took place on 4 May 2000 to elect members of Tunbridge Wells Borough Council in Kent, England. One third of the council was up for election and the Conservative party stayed in overall control of the council.
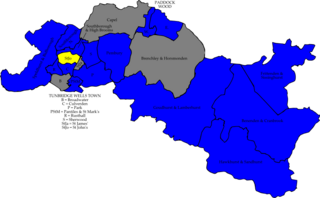
The 2002 Tunbridge Wells Council election took place on 2 May 2002 to elect members of Tunbridge Wells Borough Council in Kent, England. The whole council was up for election with boundary changes since the last election in 2000. The Conservative party stayed in overall control of the council.
The 2003 Tunbridge Wells Borough Council election took place on 1 May 2003 to elect members of Tunbridge Wells Borough Council in Kent, England. One third of the council was up for election and the Conservative party stayed in overall control of the council.
The 2004 Tunbridge Wells Borough Council election took place on 10 June 2004 to elect members of Tunbridge Wells Borough Council in Kent, England. One third of the council was up for election and the Conservative party stayed in overall control of the council.
The 2006 Tunbridge Wells Borough Council election took place on 4 May 2006 to elect members of Tunbridge Wells Borough Council in Kent, England. One third of the council was up for election and the Conservative party stayed in overall control of the council.
The 2007 Tunbridge Wells Borough Council election took place on 3 May 2007 to elect members of Tunbridge Wells Borough Council in Kent, England. One third of the council was up for election and the Conservative party stayed in overall control of the council.
The 2008 Tunbridge Wells Borough Council election took place on 1 May 2008 to elect members of Tunbridge Wells Borough Council in Kent, England. One third of the council was up for election and the Conservative party stayed in overall control of the council.
The 2010 Tunbridge Wells Borough Council election took place on 6 May 2010 to elect members of Tunbridge Wells Borough Council in Kent, England. One third of the council was up for election and the Conservative party stayed in overall control of the council.
The 2006 Maidstone Borough Council election took place on 4 May 2006 to elect members of Maidstone Borough Council in Kent, England. One third of the council was up for election and the council stayed under no overall control.
The 2012 Tunbridge Wells Borough Council election is scheduled to take place on Thursday 3 May 2012 to elect members of Tunbridge Wells Borough Council in Kent, England. One third of the council will be up for election.
The 2015 Tunbridge Wells Borough Council election took place on 7 May 2015 to elect members of the Tunbridge Wells Borough Council in England. It was held on the same day as other local elections.
The 2016 Tunbridge Wells Borough Council election took place on 5 May 2016 to elect members of Tunbridge Wells Borough Council in England. This was on the same day as other local elections.
The 2018 Tunbridge Wells Borough Council election took place on 3 May 2018 to elect members of Tunbridge Wells Borough Council in England. This was on the same day as other local elections.
This Elections in England related article is a stub. You can help Wikipedia by expanding it. |