Enfield London Borough Council election, 2014

Last updated

Map of the results of the 2014 Enfield council election. Conservatives in blue and Labour in red. Enfield London UK local election 2014 map.svg
Map of the results of the 2014 Enfield council election. Conservatives in blue and Labour in red.

The 2014 Enfield Council election took place on 22 May 2014 to elect members of Enfield London Borough Council in London, England. The whole council was up for election and the Labour party retained overall control of the council, increasing their majority over the Conservative party by five seats. [1]

London Borough of Enfield London borough in United Kingdom

The London Borough of Enfield is a London borough in north London, England. It borders the London Boroughs of Barnet, Haringey and Waltham Forest, the districts of Hertsmere, Welwyn Hatfield and Broxbourne in Hertfordshire, and Epping Forest in Essex. The local authority is Enfield Council.

England Country in north-west Europe, part of the United Kingdom

England is a country that is part of the United Kingdom. It shares land borders with Wales to the west and Scotland to the north-northwest. The Irish Sea lies west of England and the Celtic Sea lies to the southwest. England is separated from continental Europe by the North Sea to the east and the English Channel to the south. The country covers five-eighths of the island of Great Britain, which lies in the North Atlantic, and includes over 100 smaller islands, such as the Isles of Scilly and the Isle of Wight.

The Labour Party is a centre-left political party in the United Kingdom which has been described as an alliance of social democrats, democratic socialists and trade unionists. The party's platform emphasises greater state intervention, social justice and strengthening workers' rights.

Contents

Background

The last election in 2010 saw Labour winning a majority with 36 seats, compared to 27 for the Conservatives. No other parties held seats. [2]

Election result

Labour retained control, winning 41 seats, five of them gained from the Conservatives who dropped to 22 seats. Labour dominated in the east and south of the borough, retaining all their existing seats, while the Conservatives held most of their seats in the centre and west of the borough, though they lost two seats to Labour in Southgate Green ward, as well as single seats in Bush Hill Park, Chase and Winchmore Hill wards. For the second consecutive election, there was no representation from other parties on the council. [3]

The Greens fielded candidates in every ward for the second successive election and finished third in the election in terms of votes cast. The Liberal Democrats performed poorly: standing in only eight of the 21 wards and only picking up 1% of the overall vote, they finished fifth, with UKIP in fourth.

Green Party of England and Wales Political party in England and Wales

The Green Party of England and Wales is a green, left-wing political party in England and Wales. Headquartered in London, since September 2018, its co-leaders are Siân Berry and Jonathan Bartley. The Green Party has one representative in the House of Commons, one in the House of Lords, and three in the European Parliament. In addition, it has various councillors in UK local government and two members of the London Assembly.

Liberal Democrats (UK) Political party in the United Kingdom

The Liberal Democrats are a liberal political party in the United Kingdom. They currently have 11 Members of Parliament in the House of Commons, 96 members of the House of Lords, and one member of the European Parliament. They also have five Members of the Scottish Parliament and a member each in the Welsh Assembly and London Assembly. The party reached the height of its influence in the early 2010s, forming a junior partner in a coalition government from 2010 to 2015. It is currently led by Vince Cable.

UK Independence Party British political party

The UK Independence Party is a hard Eurosceptic, right-wing political party in the United Kingdom. It currently has one representative in the House of Lords and seven Members of the European Parliament (MEPs). It has three Assembly Members (AMs) in the National Assembly for Wales and one member in the London Assembly. The party reached its greatest level of success in the mid-2010s, when it gained two Members of Parliament and was the largest UK party in the European Parliament.

Save Chase Farm, who won three seats on the council in 2006, did not stand any candidates after the closure of the A&E department at Chase Farm Hospital, though one of their former councillors, Kieran McGregor, stood for the National Health Action Party in Town ward. The BNP and TUSC also fielded candidates. There were also five independent candidates.

Save Chase Farm local British political party

Save Chase Farm was a local British political party that stood against the closure of departments of Chase Farm Hospital, Enfield.

Chase Farm Hospital Hospital in London

Chase Farm Hospital is a hospital in Gordon Hill, near Enfield, north London, run by the Royal Free London NHS Foundation Trust.

National Health Action Party

The National Health Action Party (NHA) is a political party in the United Kingdom.

Ward results

Bowes (3) [4] [5]
PartyCandidateVotes%±
Labour Yasemin Brett 2,249 23%
Labour Achilleas Georgiou 2,055 21%
Labour Alan Sitkin 1,908 20%
Conservative Atilla Arslan 789 8%
Conservative Philip Stover 721 7%
Conservative Dimpi Dattani 658 7%
Green Trevor Doughty 526 5%
Green Geoff Kemball-Cook 485 5%
TUSC Craig Diggins 122 1%
TUSC Oliver Mehmet 120 1%
TUSC Frank Curtis 116 1%
Turnout 9,749
Labour hold Swing
Labour hold Swing
Labour hold Swing
Bush Hill Park (3) [4] [5]
PartyCandidateVotes%±
Conservative Lee Chamberlain 1,679 16%
Labour Sarah Doyle 1,522 14%
Conservative Erin Celebi 1,521 14%
Conservative Martin Prescott 1,334 13%
Labour Grace Loake 1,277 12%
Labour Ivor Wiggett 1,223 12%
UKIP Gwyneth Rolph 897 9%
Green Douglas Coker 621 6%
Liberal Democrat George Achillea 453 4%
Turnout 10,527
Conservative hold Swing
Labour gain from Conservative Swing
Conservative hold Swing
Chase (3) [4] [5]
PartyCandidateVotes%±
Labour Vicki Pite 1,633 15%
Conservative Peter Fallart 1,607 15%
Conservative Nick Dines 1,590 14%
Labour Christopher Cole 1,525 14%
Conservative Lindsay Rawlings 1,416 13%
Labour Geoffrey Robinson 1,326 12%
UKIP David Schofield 876 8%
Green Kate McGeevor 726 7%
Liberal Democrat Matt McLaren 295 3%
Turnout 10,994
Labour gain from Conservative Swing
Conservative hold Swing
Cockfosters (3) [4] [5]
PartyCandidateVotes%±
Conservative Jason Charalambous 1,962 21%
Conservative Michael Lavender 1,804 19%
Conservative Anne-Marie Pearce 1,769 19%
Labour Betty Costello 1,048 11%
Labour Timothy Leaver 947 10%
Labour Hassan Yusuf 806 8%
UKIP Tony Douglas 509 5%
Green Joe Phillips 422 4%
Liberal Democrat Steven Deller 236 2%
Turnout 9,503
Conservative hold Swing
Edmonton Green (3) [4] [5]
PartyCandidateVotes%±
Labour Christiana During 2,597 26%
Labour Abdul Abdullahi 2,551 25%
Labour Andrew Stafford 2,496 25%
Conservative Cabdi Aakhiro 480 5%
Conservative Mutlu Beyzade 466 5%
Conservative Petro Mema 383 4%
Green Geri Saccomanno 344 3%
TUSC Lewis Peacock 302 3%
TUSC Patrick Baker 254 3%
TUSC David Rayfield 195 2%
Turnout 10,068
Labour hold Swing
Labour hold Swing
Labour hold Swing
Enfield Highway (3) [4] [5]
PartyCandidateVotes%±
Labour Christine Hamilton 2,031 21%
Labour Turgut Esendagli 1,959 21%
Labour Ahmet Hasan 1,848 19%
Conservative Dave Boston 842 9%
Conservative Seton During 788 8%
UKIP David Jeal 774 8%
Conservative Vijay Sujan 547 6%
Green Liz Wright 409 4%
BNP Gary O'Connor 289 3%
Turnout 9,487
Labour hold Swing
Labour hold Swing
Labour hold Swing
Enfield Lock (3) [4] [5]
PartyCandidateVotes%±
Labour Krystle Fonyonga 2,395 23%
Labour Nneka Keazor 2,203 21%
Labour Ozzie Uzoanya 2,189 21%
UKIP Sharon Downer 829 8%
Conservative Mark Leonard 725 7%
Conservative Michael Fadaka 683 7%
Conservative Michael Kisubi 537 5%
Green David Greening 443 4%
BNP Jason Keogh 296 3%
Turnout 10,300
Labour hold Swing
Labour hold Swing
Labour hold Swing
Grange (3) [4] [5]
PartyCandidateVotes%±
Conservative Andy Milne 2,172 19%
Conservative Terence Neville 2,039 18%
Conservative Eric Jukes 1,968 18%
Labour Hazel Kinsler 1,175 11%
Labour Vanessa Skarpari 925 8%
Labour David South 871 8%
UKIP Graham Letchford 681 6%
Green Mark Fenton 593 5%
Green Joy Winterbottom 442 4%
Liberal Democrat Paul Smith 303 3%
Turnout 11,169
Conservative hold Swing
Haselbury (3) [4] [5]
PartyCandidateVotes%±
Labour Suna Hurman 2,245 23%
Labour George Savva 2,120 22%
Labour Haydar Ulus 2,025 21%
Conservative Adrian Croshaw 786 8%
Conservative Gonul Daniels 605 6%
UKIP Aidan Harris 566 6%
Conservative Mike Fessehazion 442 5%
Green Laura Davenport 416 4%
TUSC Mehmet Goztas 374 4%
Turnout 9,579
Labour hold Swing
Labour hold Swing
Labour hold Swing
Highlands (3) [4] [5]
PartyCandidateVotes%±
Conservative Lee David-Sanders 2,076 19%
Conservative Glynis Vince 2,002 18%
Conservative Dogan Delman 1,982 18%
Labour Joanne Hamilton 1,262 11%
Labour Christopher Deacon 1,241 11%
Labour Vincent Sutherland 908 8%
UKIP Jeff Evans 864 8%
Green David Flint 693 6%
Turnout 11,028
Conservative hold Swing
Jubilee (3) [4] [5]
PartyCandidateVotes%±
Labour Alev Cazimoglu 2,142 24%
Labour Bernie Lappage 1,984 22%
Labour Rohini Simbodyal 1,939 22%
Conservative Nazim Celebi 730 8%
UKIP Clive Morrison 633 7%
Conservative Tom Waterhouse 604 7%
Conservative Alper Kurtaran 603 7%
Green Benjamin Maydon 299 3%
Turnout 8,934
Labour hold Swing
Labour hold Swing
Labour hold Swing
Lower Edmonton (3) [4] [5]
PartyCandidateVotes%±
Labour Guney Dogan 2,478 27%
Labour Nesimi Erbil 2,333 25%
Labour Adeline Kepez 2,149 23%
UKIP Brenda Letchford 556 6%
Conservative Joseph da Cruz 438 5%
Conservative Ozkan Gezici 427 5%
Green Richard Bray 426 5%
Conservative Alok Agrawal 389 4%
Turnout 9,196
Labour hold Swing
Labour hold Swing
Labour hold Swing
Palmers Green (3) [4] [5]
PartyCandidateVotes%±
Labour Bambos Charalambous 2,224 21%
Labour Mary Maguire 2,084 19%
Labour Ahmet Oykener 1,824 17%
Conservative Beyzade Beyzade 987 9%
Conservative Natasha McDermott 956 9%
Conservative Amy Yiannitsarou 861 8%
Independent Costas Georgiou 668 6%
Green Nicholas Wall 641 6%
Liberal Democrat Brendan Malone 299 3%
BNP Angelos Gavriel 158 1%
Turnout 10,702
Labour hold Swing
Labour hold Swing
Labour hold Swing
Ponders End (3) [4] [5]
PartyCandidateVotes%±
Labour Doug Taylor 2,209 24%
Labour Ayfer Orhan 2,208 24%
Labour Donald McGowan 2,204 24%
Conservative Tugba Gungor 565 6%
Conservative Andrew Stedman 513 6%
Conservative Kamuran Kadir 497 5%
Green Rod Goodyer 384 4%
BNP William Walton 223 2%
TUSC Paul Kershaw 171 2%
Independent Marian Lukasik 133 1%
TUSC Joseph Simpson 113 1%
Turnout 9,220
Labour hold Swing
Labour hold Swing
Labour hold Swing
Southbury (3) [4] [5]
PartyCandidateVotes%±
Labour Chris Bond 2,148 21%
Labour Derek Levy 1,875 18%
Labour Jansev Jemal 1,759 17%
Conservative Adele Panayi 859 8%
Conservative Gerrad Olisa-Ashar 801 8%
Conservative Stephen Savva 738 7%
UKIP Fred Rolph 719 7%
Green Tom Duce 467 5%
Independent Garry Kousoulou 357 3%
BNP Marie Nicholas 233 2%
TUSC John Dolan 157 2%
TUSC Mirjana Glavardanov 115 1%
Turnout 10,228
Labour hold Swing
Labour hold Swing
Labour hold Swing
Southgate (3) [4] [5]
PartyCandidateVotes%±
Conservative Daniel Pearce 1,714 17%
Conservative Edward Smith 1,645 16%
Conservative Robert Hayward 1,579 15%
Labour Ingrid Cranfield 1,529 15%
Labour Andreas Constantinides 1,429 14%
Labour Tahsin Ibrahim 1,319 13%
Green Peter Krakowiak 640 6%
Liberal Democrat Alan Stainer 403 4%
Turnout 10,258
Conservative hold Swing
Southgate Green (3) [4] [5]
PartyCandidateVotes%±
Labour Daniel Anderson 1,810 16%
Labour Claire Stewart 1,678 15%
Conservative Alessandro Georgiou 1,635 15%
Labour Rasheed Sadegh-Zadeh 1,433 13%
Conservative Jon Kaye 1,389 12%
Conservative Murat Yurtseven 1,257 11%
Green Fred Clark 601 5%
Green David Hughes 471 4%
UKIP Mark James 400 4%
Liberal Democrat Lorice Stainer 333 3%
TUSC Lee Maybin 50 0%
TUSC Dean O'Hanlon 37 0%
TUSC John Stack 36 0%
Turnout 11,130
Labour gain from Conservative Swing
Conservative hold Swing
Town (3) [4] [5]
PartyCandidateVotes%±
Conservative Joanne Laban 2,121 16%
Conservative Michael Rye OBE 2,098 16%
Conservative Jim Steven 1,925 14%
Labour Catriona Bearryman 1,485 11%
Labour Ian Hamilton 1,446 11%
Labour Chris Murphy 1,186 9%
UKIP William Henwood 810 6%
UKIP Bill Price 753 6%
National Health Action Kieran McGregor 735 6%
Green Andreea Malin 724 5%
Turnout 13,283
Conservative hold Swing
Turkey Street (3) [4] [5]
PartyCandidateVotes%±
Labour Katherine Chibah 1,925 20%
Labour Toby Simon 1,819 19%
Labour Dino Lemonides 1,736 18%
Conservative Yvonne Lawson 848 9%
UKIP Gary Robbens 805 8%
Conservative Richard Reynolds 769 8%
Conservative Karl Scholfield 740 8%
Green Elizabeth Douglas 380 4%
Independent Rick Jewell 328 3%
BNP Stephen Squire 278 3%
Turnout 9,628
Labour hold Swing
Labour hold Swing
Labour hold Swing
Upper Edmonton (3) [4] [5]
PartyCandidateVotes%±
Labour Patricia Ekechi 2,632 27%
Labour Ali Bakir 2,589 26%
Labour Doris Jiagge 2,430 25%
Conservative Niyazi Zihni 573 6%
Conservative Mel Hussein 569 6%
Conservative Metin Noyan 563 6%
Green Richard Ainsworth 560 6%
Turnout 9,916
Labour hold Swing
Labour hold Swing
Labour hold Swing
Winchmore Hill (3) [4] [5]
PartyCandidateVotes%±
Conservative Elaine Hayward 1,494 14%
Conservative Ertan Hurer 1,461 14%
Labour Dinah Barry 1,267 12%
Labour Anthony Cleary 1,259 12%
Conservative Maria Zavros 1,225 12%
Labour Hakki Tilki 909 9%
Green Alison Phillips 574 6%
Green Bill Linton 555 5%
UKIP Roger James 511 5%
Green Jean Robertson-Molloy 434 4%
Independent Helen Osman 425 4%
Liberal Democrat Joe Edwards 311 3%
Turnout 10,425
Conservative hold Swing
Labour gain from Conservative Swing

Related Research Articles

2006 Barnet London Borough Council election

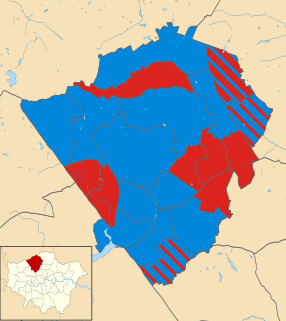
The 2006 Barnet Council election took place on 4 May 2006 to elect members of Barnet London Borough Council in London, England. The whole council was up for election and the Conservative party stayed in overall control of the council.

2006 Colchester Borough Council election

The 2006 Colchester Borough Council election took place on 4 May 2006 to elect members of Colchester Borough Council in Essex, England. One third of the council was up for election and the council stayed under no overall control.

2010 Enfield London Borough Council election

The 2010 Enfield Council election took place on 6 May 2010 to elect members of Enfield London Borough Council in London, England. The whole council was up for election and the Labour party gained overall control of the council from the Conservative party.

Elections to North Warwickshire District Council were held on Thursday 5 May 2011.

The 2011 council elections in Guildford saw the Conservatives retain control over Guildford Borough Council with an increased majority of 20 seats. Full results for each ward can be found at Guildford Council election, full results, 2011.

2006 Enfield London Borough Council election

The 2006 Enfield Council election took place on 4 May 2006 to elect members of Enfield London Borough Council in London, England. The whole council was up for election and the Conservative party stayed in overall control of the council.

2012 Sefton Metropolitan Borough Council election

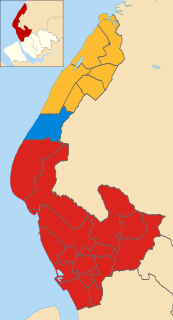
The 2012 Sefton Metropolitan Borough Council election took on 3 May 2012 to elect members of Sefton Metropolitan Borough Council in England, as part of the United Kingdom local elections, 2012. 22 seats, representing one third of the total Council membership, were up for election in single-member wards. Ten - nearly half - of the members elected were newcomers to the Council; five of these defeated sitting Councillors seeking re-election, whilst in the other five wards, the incumbent retired. Two incumbents stood under different labels to those they were elected under in 2008; both were defeated in their wards.

2004 Colchester Borough Council election

The 2004 Colchester Borough Council election took place on 10 June 2004 to elect members of Colchester Borough Council in Essex, England. This was the same day as the other 2004 United Kingdom local elections and as the 2004 European Parliament Elections. One third of the seats were up for election and the council stayed under no overall control.

2014 Barking and Dagenham London Borough Council election

The 2014 Barking and Dagenham Council election took place on 23 May 2014 to elect members of Barking and Dagenham Council in England. This was on the same day as other local elections.

2014 Hyndburn Borough Council election

Elections to Hyndburn Borough Council were held on 22 May 2014. One third of the council was up for election and the Labour party stayed in overall control of the council.

2008 Colchester Borough Council election

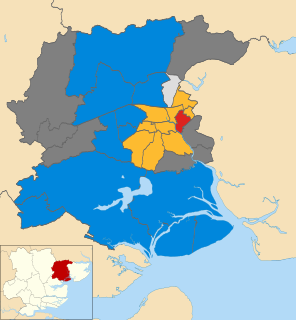
The 2008 Colchester Borough Council election took place on 1 May 2008 to elect members of Colchester Borough Council in Essex, England. One third of the council was up for election and the Conservative party lost overall control of the council to no overall control.

2012 Pendle Borough Council election

The 2012 Pendle Borough Council election took place on 3 May 2012 to elect members of Pendle Borough Council in Lancashire, England. One third of the council was up for election and the council stayed under no overall control.

The 1999 Castle Point Borough Council election took place on 6 May 1999 to elect members of Castle Point Borough Council in Essex, England. The whole council was up for election and the Labour party stayed in overall control of the council.

2014 Harlow District Council election

The 2014 Harlow District Council election took place on 22 May 2014 to elect members of Harlow District Council in Essex, England. One third of the council was up for election and the Labour party stayed in overall control of the council.

2014 Brent London Borough Council election

The 2014 Brent London Borough Council election took place on 22 May 2014 to elect members of Brent London Borough Council in London, England. The whole council was up for election and the Labour Party stayed in overall control of the council.

2014 St Helens Metropolitan Borough Council election

The 2014 St Helens Metropolitan Borough Council election took place on 22 May 2014 to elect members of St Helens Metropolitan Borough Council in Merseyside, England. One third of the council was up for election and the Labour party stayed in overall control of the council.

The 1964 Enfield Council election took place on 7 May 1964 to elect members of Enfield London Borough Council in London, England. The whole council was up for election and the Labour party gained control of the council.

2015 Christchurch Borough Council election

The 2015 Christchurch Borough Council election took place on 7 May 2015 to elect members of Christchurch Borough Council in Dorset, England. The whole council was up for election and the Conservative party stayed in overall control of the council.

2018 Barnet London Borough Council election

The 2018 Barnet Council election took place on 3 May 2018 to elect members of Barnet Borough Council in England. It took place on the same day as other local elections in 2018. In the last election, the Conservatives won control of the council with 32 seats, compared to 30 for Labour and 1 for the Liberal Democrats. On 15 March 2018, following the resignation of a Conservative councillor, the council was in a state of no overall control. The election on 3 May 2018 saw the Conservatives take back overall control with a majority of 13.

2018 Hammersmith and Fulham London Borough Council election

The 2018 Hammersmith and Fulham Council election took place on 3 May 2018 to elect members of Hammersmith and Fulham Council in London.

References