Bromley London Borough Council election, 2018

Last updated

Bromley London Borough Council election, 2018
  2014 3 May 2018

All 60 seats to Bromley London Borough Council
31 seats needed for a majority

 First partySecond party
  No image wide.svg No image wide.svg
Party Conservative Labour
Last election51 seats, 39.6%7 seats, 18.3%
Seats won508
Seat changeDecrease2.svg1Increase2.svg1
Popular vote47,77726,295
Percentage44.1%24.3%
SwingIncrease2.svg4.5%Increase2.svg5.9%

Bromleycouncilelections2018results.png

Map of the results. Conservative Party in blue, Labour Party in red and independents in grey.

Council control before election


Conservative

Council control after election


Conservative

The 2018 Bromley London Borough Council election took place on 3 May 2018 to elect members of Bromley London Borough Council in England. [1] This was the same day as other local elections.

Bromley London Borough Council

Bromley London Borough Council is the local authority for the London Borough of Bromley in Greater London, England. It is a London borough council, one of 32 in the United Kingdom capital of London.

Contents

Bromley was one of the boroughs subject to a trial of voter ID restrictions [2] requiring the production of photographic ID or 2 other forms of ID. [3]

Council results

Bromley [4]
PartyCandidatesVotes
StoodElectedGainedUnseatedNet% of total%Net %
  Conservative 605023-183.344.147,777+4.5
  Labour 60810+113.324.326,295+5.9
  Liberal Democrat 6000000.014.715,896+5.6
  Green 2300000.010.611,460-1.0
  UKIP 19002-20.02.83,065-17.0
  Independent 3220+23.33.03,162+2.0
  Women's Equality 100000.00.4440n/a
  For Britain 100000.00.1142n/a
  Libertarian 100000.00.160n/a

Ward results

Bickley

Bickley
PartyCandidateVotes%±
Conservative Kira Gabbert 2,935 20.3
Conservative Kate Lymer 2,919 20.2
Conservative Colin Smith 2,827 19.6
Labour Jann Oliver1,0227.1
Liberal Democrat Helen Corbett8976.2
Labour Mike Roberts8055.6
Liberal Democrat David Martin7535.2
Labour Martin Spence7445.1
Liberal Democrat David Wilkinson6974.8
Green Roger Austin6304.4
UKIP David Quarterman2251.6
Turnout 14,45443.1
Conservative hold Swing

Biggin Hill

Biggin Hill
PartyCandidateVotes%±
Independent Julian Wybergh 1,175 19.2
Independent Melanie Stevens 1,149 18.8
Conservative Linda Hewitt92915.2
Conservative Toby Sims84813.9
UKIP Julian Grainger3605.8
Liberal Democrat Geoff Gostt3365.5
UKIP Emmett Jenner3014.9
Labour Timothy Fisher2424.0
Labour Clive Gunby2243.7
Green Karen Wheller2053.0
Green Paul Enock1823.0
Liberal Democrat Graeme Casey1712.8
Turnout 6,12239.9
Independent gain from Conservative Swing

Bromley Common and Keston

Bromley Common and Keston
PartyCandidateVotes%±
Conservative Alexa Michael 2,718 20.6
Conservative David Jefferys 2,714 20.6
Conservative Robert McIlveen 2,638 20.0
Labour Robert Evans1,0488.0
Labour Eileen Welsh9967.6
Labour Brian Ingham9577.3
Green Hannah Whitman5684.3
Liberal Democrat Alan Carter5374.1
Liberal Democrat Clive Broadhurst5143.9
Liberal Democrat Christopher Bentley4213.2
Turnout 13,17436.2
Conservative hold Swing

Bromley Town

Bromley Town
PartyCandidateVotes%±
Conservative Nicky Dykes 2,129 13.7
Conservative Will Harmer 2,008 12.9
Conservative Michael Rutherford 1,878 12.1
Liberal Democrat Rhian Kanat1,83511.8
Liberal Democrat Julie Ireland1,77211.4
Liberal Democrat Sam Webber1,65310.6
Labour Juliet Kay1,2858.3
Labour Glyn Alsworth1,2548.1
Labour Josie Parkhouse1,0947.0
Green Roisin Robertson6394.1
Turnout 15,54740.5
Conservative hold Swing

Chelsfield and Pratts Bottom

Chelsfield and Pratts Bottom
PartyCandidateVotes%±
Conservative Mike Botting 2,928 21.6
Conservative Angela Page 2,770 20.5
Conservative Samaris Huntington-Thresher 2,715 20.1
Labour Margaret Mills8096.0
Labour Stephen Richardson7485.5
Labour Peter Moore7265.4
Liberal Democrat Gerda Loosemore-Reppen6745.0
Liberal Democrat John Bray6204.6
Green Daniel Sloan6164.6
Liberal Democrat Jonathan Webber4343.2
UKIP Michael Porter2461.8
UKIP Brian Philp2441.8
Turnout 13,53042.1
Conservative hold Swing

Chislehurst

Chislehurst
PartyCandidateVotes%±
Conservative Katy Boughey 3,094 23.3
Conservative Kieran Terry 2,900 21.8
Conservative Suraj Sharma 2,784 21.0
Labour Christian Mole9016.8
Labour Mick Maroney7485.6
Labour Eugene Nixon6605.0
Green Stella Gardiner6424.8
Liberal Democrat Ian Magrath6074.6
Liberal Democrat Robert Cliff5073.8
Liberal Democrat Simon Lewis4363.3
Turnout 13,27938.7
Conservative hold Swing

Clock House

Clock House
PartyCandidateVotes%±
Labour Vanessa Allen 2,638 16.7
Labour Ian Dunn 2,386 15.1
Labour Josh King 2,254 14.3
Conservative Christopher Phillips1,4709.3
Conservative Christine Harris1,4078.9
Conservative Scott Pattenden1,3288.4
Liberal Democrat Juliet Corbett1,2187.7
Liberal Democrat Michael Jones1,1977.6
Liberal Democrat Adam Bambrough1,1517.3
Green Nicola Nugent7044.5
Turnout 15,75346.0
Labour hold Swing
Labour hold Swing
Labour gain from Conservative Swing

Copers Cope

Copers Cope
PartyCandidateVotes%±
Conservative Michael Tickner 2,291 14.1
Conservative Stephen Wells 2,245 13.8
Conservative Russell Mellor 2,125 13.1
Liberal Democrat Alison Davis1,78511.0
Liberal Democrat Chloe-Jane Ross1,68010.3
Liberal Democrat Rich Wilsher1,5169.3
Labour Charlotte Gerada1,3338.2
Labour Tony McPartlan1,2387.6
Labour Olasupo Obikoya1,1787.2
Green Ruth Fabricant6423.9
UKIP Andrew Hayman1330.8
UKIP Graham Reakes1150.7
Turnout 16,28144.9
Conservative hold Swing

Cray Valley East

Cray Valley East
PartyCandidateVotes%±
Conservative Chris Pierce 1,619 15.8
Conservative Yvonne Bear 1,601 15.6
Conservative Harry Stranger 1,446 14.1
Labour Nathaniel Arthur1,36313.3
Labour Christopher Taylor1,22411.9
Labour Gillian Davis1,17811.5
Green Paul Hemingway3653.6
UKIP Mick Greenhough3633.5
UKIP Ayse Smith3373.3
Liberal Democrat Caitlin Bishop3083.0
Liberal Democrat Martin Cooper2382.3
Liberal Democrat Rhianna Wilsher2212.2
Turnout 10,26331.7
Conservative hold Swing

Cray Valley West

Cray Valley West
PartyCandidateVotes%±
Conservative Judi Ellis 1,465 15.1
Conservative Colin Hitchins 1,365 14.1
Conservative Gary Ernest Stevens 1,228 12.7
Labour Kelly Galvin97310.0
Labour Gary John Stevens8388.6
Independent Colin Willetts8388.6
Labour Richard Lovell8098.3
UKIP David Livett4805.0
UKIP Garry Ramus3944.1
Green Steven Cope3874.0
Liberal Democrat Katharine Barker3663.8
Liberal Democrat Magdalena Williams2983.1
Liberal Democrat Peter Scott Brooks1902.0
Libertarian Sean Finch600.6
Turnout 9,69129.0
Conservative hold Swing
Conservative gain from UKIP Swing

Crystal Palace

Crystal Palace
PartyCandidateVotes%±
Labour Angela Wilkins 1,985 33.2
Labour Marina Ahmad 1,755 29.4
Green Mark Phillippo5369.0
Liberal Democrat Philippa Bridge5278.8
Conservative Craig Wilson4427.4
Conservative Sunil Gupta4217.0
Liberal Democrat David Marshall3095.2
Turnout 5,97534.8
Labour hold Swing
Labour hold Swing

Darwin

Darwin
PartyCandidateVotes%±
Conservative Richard Scoates 1,201 72.8
Labour Frank Evans18511.2
Liberal Democrat Millicent Scott Brooks1338.1
Green Jan Wilson1307.9
Turnout 1,64940.0
Conservative hold Swing

Farnborough and Crofton

Farnborough and Crofton
PartyCandidateVotes%±
Conservative Robert Evans 3,276 22.2
Conservative Charles Joel 3,208 21.7
Conservative Christopher Marlow 2,987 20.2
Liberal Democrat Ian Catchpole8105.5
Labour Malcolm Clark7895.3
Liberal Democrat Allan Tweddle7765.3
Labour Christine McNamara7445.0
Liberal Democrat Oliver Loosemore6834.6
Labour John Pead6194.2
Green Tamara Galloway4493.0
UKIP Kenneth Tracey2952.0
For Britain Mandy Baldwin1421.0
Turnout 14,77843.8
Conservative hold Swing

Hayes and Coney Hall

Hayes and Coney Hall
PartyCandidateVotes%±
Conservative Graham Arthur 3,096 20.9
Conservative Peter Fortune 3,087 20.9
Conservative Neil Reddin 2,830 19.1
Labour Peter Ayres9506.4
Labour Gail Emerson9506.4
Labour Glenys Ingham9186.2
Liberal Democrat Ellen Griffiths7335.0
Green Mary Ion6214.2
Liberal Democrat Tudor Griffiths5593.8
Liberal Democrat Michael Fox5353.6
UKIP Michael Rudd2611.8
UKIP Sandra Pearson2431.6
Turnout 14,78340.8
Conservative hold Swing

Kelsey and Eden Park

Kelsey and Eden Park
PartyCandidateVotes%±
Conservative Peter Dean 2,563 17.2
Conservative Diane Smith 2,532 17.0
Conservative Dave Wibberley 2,412 16.2
Labour Marie Bardsley1,57910.6
Labour Naresh Chauhan1,4629.8
Labour John Dempster1,3589.1
Liberal Democrat Hayley Anderson8595.8
Liberal Democrat Taylor Matthews6754.5
Liberal Democrat Robert Jackson6704.5
Green Gareth Thomas5533.7
UKIP Valerie Butcher2141.4
Turnout 14,87742.1
Conservative hold Swing

Mottingham and Chislehurst North

Mottingham and Chislehurst North
PartyCandidateVotes%±
Conservative David Cartwright 1,111 24.0
Conservative Will Rowlands 992 21.5
Labour Nick Harrison97221.0
Labour Kathy Smith96921.0
Green Kate Matos2234.8
Liberal Democrat Victoria Webber1854.0
Liberal Democrat John Houghton1713.7
Turnout 4,62333.4
Conservative hold Swing

Orpington

Orpington
PartyCandidateVotes%±
Conservative Kim Botting 2,857 21.6
Conservative Pauline Tunnicliffe 2,729 20.7
Conservative William Huntington-Thresher 2,694 20.4
Labour Christopher Price9497.2
Labour Vibeke Fussing9477.2
Labour Gareth Wretham8056.1
Liberal Democrat Michael Hall6745.1
Liberal Democrat Elaine Mackay5984.5
Green Michael Marriott5073.8
Liberal Democrat Reinhard Rometsch4303.3
Turnout 13,19038.1
Conservative hold Swing

Penge and Cator

Penge and Cator
PartyCandidateVotes%±
Labour Kathy Bance 3,259 23.0
Labour Kevin Brooks 2,828 19.9
Labour Simon Jeal 2,692 19.0
Conservative Sarah Dalton1,0217.2
Green Geoffrey Allen1,0097.1
Conservative Neil Jopson9526.7
Conservative David Kenyon8976.3
Liberal Democrat Marguerite Pierre5764.1
Liberal Democrat Jonathan Douglas-Green5073.6
Liberal Democrat Philip Storry4473.2
Turnout 14,18839.8
Labour hold Swing
Labour hold Swing
Labour hold Swing

Petts Wood and Knoll

Petts Wood and Knoll
PartyCandidateVotes%±
Conservative Keith Onslow 3,426 23.9
Conservative Tony Owen 3,299 23.0
Conservative Simon Fawthrop 3,104 21.7
Liberal Democrat Lesley Astier8636.0
Labour Benjamin Devlin7445.2
Labour Jemma Gallagher6944.8
Green Martin Childs6264.4
Labour Stephen Cranenburgh5653.9
Liberal Democrat John Loosemore5443.8
Liberal Democrat Michael Berridge4713.3
Turnout 14,33646.5
Conservative hold Swing

Plaistow and Sundridge

Plaistow and Sundridge
PartyCandidateVotes%±
Conservative Gareth Allatt 1,991 14.9
Conservative Peter Morgan 1,957 14.6
Conservative Michael Turner 1,935 14.5
Labour Angie Stack1,69612.7
Labour Pam Remon1,57811.8
Labour Simon Thomson1,39210.4
Liberal Democrat Lesley Furniss6164.6
Liberal Democrat Dominic Alessio5584.2
Green John Street5043.8
Liberal Democrat Peter Furniss4523.4
Women's Equality Caroline MacVay4403.3
UKIP Patricia Gulliver2652.0
Turnout 13,38440.0
Conservative hold Swing

Shortlands

Shortlands
PartyCandidateVotes%±
Conservative Mary Cooke 2,080 32.7
Conservative Aisha Cuthbert 1,935 30.4
Labour Richard Hart5709.0
Liberal Democrat Richard Corbett5118.0
Labour Dermot McKibbin5007.9
Liberal Democrat Ilona Navarro-Weitzel4176.6
Green Ann Garrett3425.4
Turnout 6,35542.7
Conservative hold Swing

West Wickham

West Wickham
PartyCandidateVotes%±
Conservative Mark Brock 3,072 21.0
Conservative Nicholas Bennett 2,834 19.4
Conservative Hannah Gray 2,804 19.2
Labour Eli David1,0036.9
Labour Jeremy Adams9716.6
Labour Joanna Crispin9696.6
Liberal Democrat James Spencer-Boyce8465.8
Green Jenny Cambell B. Rust5623.8
Liberal Democrat Nigel Peaple5323.6
Liberal Democrat Stephen Wells4893.3
UKIP Victor Jackson2231.5
UKIP Colin Chuck1831.3
UKIP Brian Danes1481.0
Turnout 14,63642.5
Conservative hold Swing

Related Research Articles

Bromley and Chislehurst (UK Parliament constituency) Parliamentary constituency in the United Kingdom

Bromley and Chislehurst is a constituency represented in the House of Commons of the UK Parliament since 2006 by Bob Neill of the Conservative Party.

Bromley London Borough Council elections

Bromley Council is elected every four years.

2006 London local elections

Local government elections took place in London, and some other parts of the United Kingdom on Thursday 4 May 2006. Polling stations were open between 7am and 10pm.

2000 Amber Valley Borough Council election

The 2000 Amber Valley Borough Council election took place on 4 May 2000 to elect members of Amber Valley Borough Council in Derbyshire, England. The whole council was up for election with boundary changes since the last election in 1999 increasing the number of seats by 2. The Conservative party gained control of the council from the Labour party.

The 1998 Wandsworth Council election took place on 7 May 1998 to elect members of Wandsworth London Borough Council in London, England. The whole council was up for election and the Conservative party stayed in overall control of the council.

Elections for the London Borough of Merton were held on 7 May 1998 to elect members of Merton London Borough Council in London, England. This was on the same day as other local elections in England and a referendum on the Greater London Authority; in the latter, Merton voted in favour of creating the Greater London Authority by 72.2% on a 37.6% turnout.

2006 Woking Borough Council election

The 2006 Woking Council election took place on 4 May 2006 to elect members of Woking Borough Council in Surrey, England. One third of the council was up for election and the council stayed under no overall control.

2008 Woking Borough Council election

The 2008 Woking Council election took place on 1 May 2008 to elect members of Woking Borough Council in Surrey, England. One third of the council was up for election and the Conservative party stayed in overall control of the council.

The 2002 South Tyneside Metropolitan Borough Council election took place on 2 May 2002 to elect members of South Tyneside Metropolitan Borough Council in Tyne and Wear, England. One third of the council was up for election and the Labour party kept overall control of the council.

The 2010 Rushmoor Council election took place on 6 May 2010 to elect members of Rushmoor Borough Council in Hampshire, England. One third of the council was up for election and the Conservative party stayed in overall control of the council.

The 2000 Swindon Borough Council election took place on 6 May 2000 to elect members of Swindon Unitary Council in Wiltshire, England. The whole council was up for election with boundary changes since the last election in 1999 increasing the number of seats by 5. The Labour party lost overall control of the council to no overall control.

2003 Swindon Borough Council election

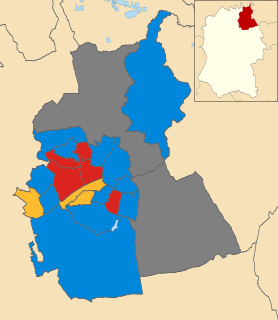
The 2003 Swindon Borough Council election took place on 1 May 2003 to elect members of Swindon Unitary Council in Wiltshire, England. One third of the council was up for election and the council stayed under no overall control.

Greenwich London Borough Council elections

Greenwich London Borough Council in London, England is elected every four years. Since the last boundary changes in 2002, 51 councillors have been elected from 17 wards.

2014 London local elections

There were local government elections in London on Thursday 22 May 2014. All councillor seats on the 32 London borough councils were up for election. The electorates of Hackney, Lewisham, Newham and Tower Hamlets also elected their executive mayors, who operate in place of council leaders in those boroughs. Ward changes took place in Hackney, Kensington and Chelsea, and Tower Hamlets, which reduced the total number of councillors by 10 to 1,851. Both the mayoral and councillor elections are four-yearly.

2018 United Kingdom local elections

Council elections in England were held on Thursday 3 May 2018. Elections were held in all 32 London boroughs, 34 metropolitan boroughs, 67 district and borough councils and 17 unitary authorities. There were also direct elections for the mayoralties of Hackney, Lewisham, Newham, Tower Hamlets and Watford.

2018 Brent London Borough Council election

The 2018 Brent London Borough Council election took place on 3 May 2018 to elect members of Brent London Borough Council in England. This was on the same day as other local elections.

The 2018 Watford Borough Council election took place on 3 May 2018 to elect members of Watford Borough Council in England. This was the same day as other local elections.

2018 Westminster City Council election

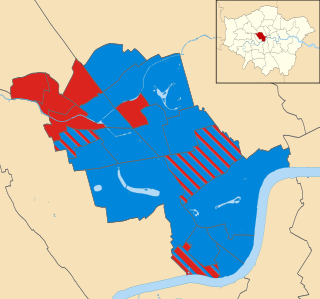
The 2018 Westminster City Council elections were held on 3rd May 2018, the same day as other London Boroughs. All 60 seats were up for election along with the 3 seats of Queen's Park Community Council. Despite initial expectations of Labour gains across the borough, the Conservative party were able to hold the council and only lost 3 seats. The Conservatives won the popular vote across the borough by a small margin of 923 votes (1.7%), but nonetheless won a decisive victory in terms of seats, winning 41 councillors to Labour's 19.

The 2018 Swindon Borough Council election took place on 3 May 2018, to elect members of Swindon Borough Council in England. This was on the same day as other local elections.

The 2018 Woking Borough Council election took place on 3 May 2018 to elect one third of members to Woking Borough Council in England coinciding with other local elections held across much of England. Elections in each ward are held in three years out of four.

References

  1. "Local Elections 2018 Statement of Persons nominated". bromley.gov.uk. Bromley London Borough Council . Retrieved 13 April 2018.
  2. Press Association (2018-04-28). "Polling station voter ID plans are deeply flawed, say critics". The Guardian. Retrieved 2018-04-29.
  3. Walker, Peter; Weaver, Matthew (2018-05-03). "Anger and confusion as voters turned away during ID trial". the Guardian. Retrieved 2018-05-09.
  4. Elects, Britain (May 2018). "LE2018 ward-by-ward results: London only [Britain Elects]". Britain Elects. Retrieved 21 June 2018.