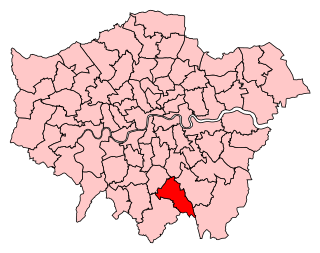
The 1971 Croydon Council election took place on 13 May 1971 to elect members of Croydon London Borough Council in London, England. The whole council was up for election and the Conservative party stayed in overall control of the council. [1]
Croydon London Borough Council is the local authority for the London Borough of Croydon in Greater London, England. It is a London borough council, one of 32 in the United Kingdom capital of London. Croydon is divided into 28 wards, electing 70 councillors.
London is the capital and largest city of both England and the United Kingdom. Standing on the River Thames in the south-east of England, at the head of its 50-mile (80 km) estuary leading to the North Sea, London has been a major settlement for two millennia. Londinium was founded by the Romans. The City of London, London's ancient core − an area of just 1.12 square miles (2.9 km2) and colloquially known as the Square Mile − retains boundaries that follow closely its medieval limits. The City of Westminster is also an Inner London borough holding city status. Greater London is governed by the Mayor of London and the London Assembly.
The Conservative Party, officially the Conservative and Unionist Party, is a centre-right political party in the United Kingdom. Presently led by Theresa May, it has been the governing party since 2010. It presently has 314 Members of Parliament in the House of Commons, 249 members of the House of Lords, and 18 members of the European Parliament. It also has 31 Members of the Scottish Parliament, 12 members of the Welsh Assembly, eight members of the London Assembly and 9,008 local councillors. One of the major parties of UK politics, it has formed the government on 45 occasions, more than any other party.
This section is empty.You can help by adding to it.(March 2015) |
Party | Seats | Gains | Losses | Net gain/loss | Seats % | Votes % | Votes | +/− | |
---|---|---|---|---|---|---|---|---|---|
Conservative | 30 | 50 | 47.4 | ||||||
Labour | 27 | 45 | 40.8 | ||||||
Independent | 3 | 5 | |||||||
Liberal | 0 | 0 | 1 | 0 | 6.1 |
Party | Seats | Gains | Losses | Net gain/loss | Seats % | Votes % | Votes | +/− | |
---|---|---|---|---|---|---|---|---|---|
Conservative | 3 | 60 | |||||||
Labour | 2 | 40 | |||||||
Independent | 0 | 0 | |||||||
Liberal | 0 | 0 |
Party | Seats | Gains | Losses | Net gain/loss | Seats % | Votes % | Votes | +/− | |
---|---|---|---|---|---|---|---|---|---|
Conservative | 5 | 100 | |||||||
Labour | 0 | 0 | |||||||
Independent | 0 | 0 | |||||||
Liberal | 0 | 0 |
Note: One Alderman was elected as an independent in 1968, but was a Conservative by the time of this election.
Party | Seats | Gains | Losses | Net gain/loss | Seats % | Votes % | Votes | +/− | |
---|---|---|---|---|---|---|---|---|---|
Conservative | 38 | 54.29 | 47.4 | ||||||
Labour | 29 | 41.43 | 40.8 | ||||||
Independent | 3 | 4.29 | |||||||
Liberal | 0 | 0 | 1 | 0 | 6.1 |
38 | 3 | 29 |
Con | Independent | Labour |
Party | Candidate | Votes | % | ± | |
---|---|---|---|---|---|
Labour | |||||
Labour | |||||
Labour | |||||
Conservative | |||||
Turnout | 42.6 | ||||
Registered electors | 11,421 | ||||
Labour gain from Conservative | Swing | ||||
Party | Candidate | Votes | % | ± | |
---|---|---|---|---|---|
Labour | |||||
Labour | |||||
Labour | |||||
Conservative | |||||
Liberal | |||||
Liberal | |||||
Liberal | |||||
Turnout | 40.3 | ||||
Registered electors | 11,121 | ||||
Labour gain from Residents | Swing | ||||
Party | Candidate | Votes | % | ± | |
---|---|---|---|---|---|
Labour | |||||
Labour Co-op | |||||
Conservative | |||||
Turnout | 39.1 | ||||
Registered electors | 9,703 | ||||
Labour gain from Conservative | Swing | ||||
Labour Co-op gain from Conservative | Swing | ||||
Party | Candidate | Votes | % | ± | |
---|---|---|---|---|---|
Conservative | |||||
Labour | |||||
Labour | |||||
Labour | |||||
Turnout | 35.8 | ||||
Registered electors | 11,608 | ||||
Conservative hold | Swing | ||||
Party | Candidate | Votes | % | ± | |
---|---|---|---|---|---|
Conservative | |||||
Liberal | |||||
Liberal | |||||
Liberal | |||||
Labour | |||||
Labour | |||||
Labour | |||||
Independent | |||||
Turnout | 44.5 | ||||
Registered electors | 10,707 | ||||
Conservative gain from Independent | Swing | ||||
Conservative gain from Liberal | Swing | ||||
Conservative gain from Independent | Swing | ||||
Party | Candidate | Votes | % | ± | |
---|---|---|---|---|---|
Independent | |||||
Independent | |||||
Independent | |||||
Labour | |||||
Labour | |||||
Labour | |||||
Turnout | 34.8 | ||||
Registered electors | 12,667 | ||||
Independent hold | Swing | ||||
Party | Candidate | Votes | % | ± | |
---|---|---|---|---|---|
Labour | |||||
Labour | |||||
Labour | |||||
Conservative | |||||
A Tenant's Voice | |||||
Turnout | 35.3 | ||||
Registered electors | 16,194 | ||||
Labour gain from Conservative | Swing | ||||
Labour hold | Swing | ||||
Labour gain from Conservative | Swing | ||||
Party | Candidate | Votes | % | ± | |
---|---|---|---|---|---|
Conservative | |||||
Labour | |||||
Labour | |||||
Labour | |||||
Turnout | 33.7 | ||||
Registered electors | 11,882 | ||||
Conservative gain from Conservative Resident | Swing | ||||
Party | Candidate | Votes | % | ± | |
---|---|---|---|---|---|
Conservative | |||||
Labour | |||||
Labour | |||||
Labour | |||||
Liberal | |||||
Liberal | |||||
Liberal | |||||
Turnout | 31.7 | ||||
Registered electors | 12,511 | ||||
Conservative hold | Swing | ||||
Party | Candidate | Votes | % | ± | |
---|---|---|---|---|---|
Conservative | |||||
Liberal | |||||
Liberal | |||||
Labour | |||||
Labour | |||||
Labour | |||||
Liberal | |||||
Turnout | 41.8 | ||||
Registered electors | 12,451 | ||||
Conservative hold | Swing | ||||
Party | Candidate | Votes | % | ± | |
---|---|---|---|---|---|
Conservative | P.W. Rickards | 3,809 | |||
Conservative | K.A. Wells | 3,748 | |||
Conservative | W.N. Peet | 3,734 | |||
Labour | Mrs P.M. Poole | 1,113 | |||
Labour | J.W. Gleisner | 1,054 | |||
Labour | G.C. Daisley | 1,051 | |||
Liberal | R.A. Coleman | 433 | |||
Liberal | J.A.H. Clement | 404 | |||
Liberal | Mrs M.J. Woods | 403 | |||
Turnout | 41.1 | ||||
Registered electors | 12,923 | ||||
Conservative hold | Swing | ||||
Party | Candidate | Votes | % | ± | |
---|---|---|---|---|---|
Conservative | |||||
Labour | |||||
Labour | |||||
Labour | |||||
Liberal | |||||
Liberal | |||||
Liberal | |||||
Turnout | 39.7 | ||||
Registered electors | 16,024 | ||||
Conservative hold | Swing | ||||
Party | Candidate | Votes | % | ± | |
---|---|---|---|---|---|
Conservative | |||||
Labour | |||||
Labour | |||||
Labour | |||||
Turnout | 30.9 | ||||
Registered electors | 12,939 | ||||
Conservative hold | Swing | ||||
Party | Candidate | Votes | % | ± | |
---|---|---|---|---|---|
Labour | |||||
Labour | |||||
Labour | |||||
Residents | |||||
Residents | |||||
Residents | |||||
Libertarian Socialist | |||||
Turnout | 37.5 | ||||
Registered electors | 10,991 | ||||
Labour gain from Residents | Swing | ||||
Party | Candidate | Votes | % | ± | |
---|---|---|---|---|---|
Conservative | |||||
Labour | |||||
Labour | |||||
Labour | |||||
Liberal | |||||
Liberal | |||||
Turnout | 35.5 | ||||
Registered electors | 12,210 | ||||
Conservative hold | Swing | ||||
Party | Candidate | Votes | % | ± | |
---|---|---|---|---|---|
Labour | V. Burgos | 3449 | |||
Labour | A. Brett | 3408 | |||
Labour | B.H. Davies | 3367 | |||
Conservative | D.S. Kingsland | 2508 | |||
Conservative | R.J. Moseley | 2451 | |||
Conservative | M.D. Wunn | 2405 | |||
Turnout | 49.2 | ||||
Registered electors | 12,451 | ||||
Labour gain from Conservative | Swing | ||||
Party | Candidate | Votes | % | ± | |
---|---|---|---|---|---|
Labour | |||||
Labour | |||||
Labour | |||||
Conservative | |||||
Turnout | 40.1 | ||||
Registered electors | 10,760 | ||||
Labour gain from Conservative Resident | Swing | ||||
Party | Candidate | Votes | % | ± | |
---|---|---|---|---|---|
Labour | |||||
Labour | |||||
Labour | |||||
Conservative | |||||
Turnout | 30.1 | ||||
Registered electors | 10,501 | ||||
Labour gain from Conservative | Swing | ||||
Party | Candidate | Votes | % | ± | |
---|---|---|---|---|---|
Conservative | |||||
Liberal | |||||
Liberal | |||||
Liberal | |||||
Labour | |||||
Labour | |||||
Labour | |||||
Turnout | 33.0 | ||||
Registered electors | 11,709 | ||||
Conservative hold | Swing | ||||
Party | Candidate | Votes | % | ± | |
---|---|---|---|---|---|
Labour Co-op | |||||
Conservative | |||||
Liberal | |||||
Liberal | |||||
Liberal | |||||
Communist | |||||
National Front | |||||
Turnout | 39.0 | ||||
Registered electors | 11,094 | ||||
Labour Co-op gain from Conservative | Swing | ||||
Croydon Central is a constituency created in 1974 and is represented in the House of Commons of the UK Parliament since 2017 by Labour MP Sarah Jones. The seat bucked the national results in 2005 and in 2017, leaning to right and left respectively being in other results a bellwether, its winner belonging to the winning party nationally since 1979.
Elections for the Council in the London Borough of Croydon are held every four years to elect 70 councillors. At the last elections, which were held in May 2014, 30 Conservative councillors and 40 Labour councillors, providing a Labour majority of ten seats.
Beddington and Wallington was, from 1915 to 1965, a local government district in north east Surrey, England. It formed part of the London suburbs, lying within the Metropolitan Police District and the London Passenger Transport Area. In 1965 it was abolished on the creation of Greater London.
The London Borough of Lewisham is a London borough, in the United Kingdom, established in 1964. Elections are held every four years using a plurality bloc vote electoral system for the councillors and the supplementary vote electoral system for the elected mayor.
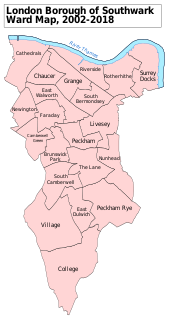
Southwark London Borough Council in London, England is elected every four years. Since the last boundary changes in 2002, 63 councillors have been elected from 21 wards.
Elections for the London Borough of Merton were held on 7 May 1998 to elect members of Merton London Borough Council in London, England. This was on the same day as other local elections in England and a referendum on the Greater London Authority; in the latter, Merton voted in favour of creating the Greater London Authority by 72.2% on a 37.6% turnout.
The 1964 Croydon Council election took place on 7 May 1964 to elect members of Croydon London Borough Council in London, England. The whole council was up for election and the council went into no overall control.
The 1968 Barking Council election took place on 9 May 1968 to elect members of Barking London Borough Council in London, England. The whole council was up for election and the Labour party stayed in overall control of the council.
The 1968 Croydon Council election took place on 9 May 1968 to elect members of Croydon London Borough Council in London, England. The whole council was up for election and the Conservative party gained overall control of the council.. Turnout in this election was 36.2%.
The 1971 Barking Council election took place on 13 May 1971 to elect members of Barking London Borough Council in London, England. The whole council was up for election and the Labour party stayed in overall control of the council.
The 1971 Bromley Council election took place on 13 May 1971 to elect members of Bromley London Borough Council in London, England. The whole council was up for election and the Conservative party stayed in overall control of the council.
The 1974 Croydon Council election took place on 2 May 1974 to elect members of Croydon London Borough Council in London, England. The whole council was up for election and the Conservative party stayed in overall control of the council.
The 1978 Croydon Council election took place on 4 May 1978 to elect members of Croydon London Borough Council in London, England. The whole council was up for election and the Conservative party stayed in overall control of the council.
The 1990 Croydon Council election took place on 3 May 1990 to elect members of Croydon London Borough Council in London, England. The whole council was up for election and the Conservative party stayed in overall control of the council.
The 1986 Croydon Council election took place on 8 May 1986 to elect members of Croydon London Borough Council in London, England. The whole council was up for election and the Conservative party stayed in overall control of the council.
The 1982 Croydon Council election took place on 6 May 1982 to elect members of Croydon London Borough Council in London, England. The whole council was up for election and the Conservative party stayed in overall control of the council.
The 1971 Kensington and Chelsea Council election took place on 13 May 1971 to elect members of Kensington and Chelsea London Borough Council in London, England. The whole council was up for election and the Conservative party stayed in overall control of the council.
The 1971 Kingston upon Thames Council election took place on 13 May 1971 to elect members of Kingston upon Thames London Borough Council in London, England. The whole council was up for election and the Conservative party stayed in overall control of the council.
The 1971 Richmond upon Thames Council election took place on 13 May 1971 to elect members of Richmond upon Thames London Borough Council in London, England. The whole council was up for election and the Conservative party stayed in overall control of the council.
The 2018 Croydon Council election took place on 3 May 2018 to elect members of Croydon Council in England. This was on the same day as other London local elections.