Elections to Tower Hamlets London Borough Council were held on 4 May 1978. Following boundary changes, the whole council was up for election. Turnout was 28.3%.
Tower Hamlets London Borough Council is the local authority for the London Borough of Tower Hamlets in Greater London, England. The council is unusual in that its executive function is controlled by a directly elected mayor of Tower Hamlets, currently John Biggs.
Party | Seats | Gains | Losses | Net gain/loss | Seats % | Votes % | Votes | +/− | |
---|---|---|---|---|---|---|---|---|---|
Labour | 43 | 64.3 | |||||||
Liberal | 7 | 10.8 | |||||||
Conservative | 0 | 9.5 |
Party | Candidate | Votes | % | ± | |
---|---|---|---|---|---|
Labour | Daniel Kelly | 742 | |||
Labour | Arthur Sanders | 663 | |||
Conservative | Lindsey Rowley | 151 | |||
Conservative | Selwyn Williams | 132 | |||
National Front | George Davis | 108 | |||
National Front | Beverley Matthews | 97 | |||
Majority | |||||
Turnout | 4,947 | 20.9 | |||
Party | Candidate | Votes | % | ± | |
---|---|---|---|---|---|
Liberal | Peter Gray | 656 | |||
Liberal | Ronald Lebar | 635 | |||
Liberal | Gwendoline Lee | 632 | |||
Labour | Thomas Crudgington | 560 | |||
Labour | Hetty Hawksbee | 553 | |||
Labour | Deirdre Wood | 525 | |||
Conservative | John Livingstone | 129 | |||
Conservative | Linda Archibald | 111 | |||
Conservative | Tania Mason | 108 | |||
National Front | Richard Cribb | 99 | |||
National Front | Albert Buttery | 98 | |||
National Front | Ernest Bale | 88 | |||
Majority | |||||
Turnout | 4,568 | 33.7 | |||
Party | Candidate | Votes | % | ± | |
---|---|---|---|---|---|
Labour | William Guy | 1,129 | |||
Labour | Arthur Downes | 1,119 | |||
Labour | James Morris | 1,055 | |||
Conservative | Malcolm Goldberg | 275 | |||
Conservative | Doris Young | 229 | |||
National Front | Kevin Jones | 177 | |||
National Front | Stanley Muzzlewhite | 149 | |||
National Front | Tina Rowe | 141 | |||
Majority | |||||
Turnout | 6,166 | 27.3 | |||
Party | Candidate | Votes | % | ± | |
---|---|---|---|---|---|
Labour | Paul Beasley | 1,032 | |||
Labour | Patricia Thompson | 989 | |||
National Front | Iris Berry | 191 | |||
Conservative | Raymond Hatter | 185 | |||
National Front | Raymond Underwood | 152 | |||
Majority | |||||
Turnout | 5,012 | 30.1 | |||
Party | Candidate | Votes | % | ± | |
---|---|---|---|---|---|
Liberal | Eric Flounders | 933 | |||
Liberal | Irene Seabrook | 850 | |||
Labour | James Brooke | 584 | |||
Labour | Albert Snooks | 554 | |||
Conservative | Caroline Evans | 141 | |||
National Front | Edwin Smith | 90 | |||
National Front | James Buttery | 89 | |||
Majority | |||||
Turnout | 4,451 | 39.5 | |||
Party | Candidate | Votes | % | ± | |
---|---|---|---|---|---|
Labour | Joseph O'Connor | 1,051 | |||
Labour | George Negus | 1,036 | |||
Labour | George Wall | 974 | |||
Conservative | Barbara Perrott | 351 | |||
Conservative | William McCrossan | 336 | |||
National Front | Irene Underwood | 254 | |||
National Front | Michael Rowe | 230 | |||
National Front | George Williams | 207 | |||
Majority | |||||
Turnout | 6,819 | 25.8 | |||
Party | Candidate | Votes | % | ± | |
---|---|---|---|---|---|
Labour | George Desmond | 1,120 | |||
Labour | Alfred Hegarty | 1,080 | |||
Labour | Reginald Beer | 1,078 | |||
Conservative | Herbert Cook | 283 | |||
Conservative | Edith Goymer | 260 | |||
National Front | Stephen Colville | 225 | |||
National Front | Margaret Rowe | 199 | |||
Majority | |||||
Turnout | 6,295 | 27.4 | |||
Party | Candidate | Votes | % | ± | |
---|---|---|---|---|---|
Labour | John Riley | 1,101 | |||
Labour | John O'Neill | 1,093 | |||
Labour | Dennis Twomey | 1,003 | |||
Conservative | Terence Poole | 285 | |||
National Front | Victor Clark | 221 | |||
National Front | John Tear | 200 | |||
National Front | Terence Rowe | 191 | |||
Communist | Anita Halpin | 93 | |||
Majority | |||||
Turnout | 7,147 | 24.0 | |||
Party | Candidate | Votes | % | ± | |
---|---|---|---|---|---|
Labour | John Allen | 1,116 | |||
Labour | William Kilgour | 979 | |||
Labour | William Hickin | 963 | |||
Conservative | Kenneth Hollands | 297 | |||
National Front | Kevin Griffin | 236 | |||
National Front | Peter Edwards | 224 | |||
National Front | Donald Williams | 170 | |||
Turnout | 7,144 | 24.4 | |||
Party | Candidate | Votes | % | ± | |
---|---|---|---|---|---|
Liberal | Brian Williams | 1,174 | |||
Liberal | Brenda Collins | 1,117 | |||
Labour | Thomas Beningfield | 399 | |||
Labour | Edmund Winterflood | 357 | |||
National Front | Thomas Matthews | 128 | |||
National Front | Rosina Muzzlewhite | 122 | |||
Majority | |||||
Turnout | 4,638 | 38.6 | |||
Party | Candidate | Votes | % | ± | |
---|---|---|---|---|---|
Labour | Matthew Durrell | 958 | |||
Labour | George Chaney | 950 | |||
Conservative | Mary Firmin | 315 | |||
National Front | Terence Godden | 144 | |||
National Front | Mary Matthews | 125 | |||
Communist | Daniel Lyons | 72 | |||
Majority | |||||
Turnout | 5,338 | 28.6 | |||
Party | Candidate | Votes | % | ± | |
---|---|---|---|---|---|
Labour | Arthur Dorrell | 1,087 | |||
Labour | Benjamin Holmes | 1,060 | |||
Labour | Emmanuel Penner | 980 | |||
Conservative | Janet Beater | 360 | |||
National Front | Robert Bargery | 200 | |||
National Front | Sylvia Bale | 163 | |||
Communist | Frank Whipple | 117 | |||
Workers Revolutionary | Bridget Leach | 98 | |||
Majority | |||||
Turnout | 6,698 | 27.0 | |||
Party | Candidate | Votes | % | ± | |
---|---|---|---|---|---|
Labour | George Browne | 691 | |||
Labour | Hannah Morsman | 660 | |||
Conservative | Ernest Hartley | 301 | |||
Conservative | Elizabeth Hartley | 295 | |||
National Front | Peter Beresford | 233 | |||
National Front | Frederick Nail | 228 | |||
Majority | |||||
Turnout | 4,922 | 26.6 | |||
Party | Candidate | Votes | % | ± | |
---|---|---|---|---|---|
Labour | Robert McFarlane | 1,001 | |||
Labour | Gerald Simons | 955 | |||
Labour | Rachel Perkins | 952 | |||
East London People's Alliance | Maureen Davies | 307 | |||
East London People's Alliance | Michael Jempson | 287 | |||
Conservative | John Ranelagh | 243 | |||
Communist | Kevin Halpin | 142 | |||
National Front | John Muzzlewhite | 108 | |||
Independent Liberal | Peter Lear | 98 | |||
Majority | |||||
Turnout | 6,166 | 27.8 | |||
Party | Candidate | Votes | % | ± | |
---|---|---|---|---|---|
Labour | Robert Ashkettle | 1,083 | |||
Labour | Barnett Saunders | 1,027 | |||
Conservative | Brenda Epstein | 378 | |||
Communist | Max Levitas | 313 | |||
Conservative | Edna Hill | 251 | |||
National Front | John Gibbons | 56 | |||
National Front | Terence Jellis | 52 | |||
Majority | |||||
Turnout | 5,351 | 31.7 | |||
Party | Candidate | Votes | % | ± | |
---|---|---|---|---|---|
Labour | Albert Jacob | 1,109 | |||
Labour | Beatrice Orwell | 1,063 | |||
Labour | Edwin Walker | 1,050 | |||
Conservative | Patrick Holmes | 431 | |||
National Front | Albert Mariner | 401 | |||
National Front | George Newman | 376 | |||
Communist | Hugh McAlpine | 121 | |||
Majority | |||||
Turnout | 7,809 | 25.3 | |||
Party | Candidate | Votes | % | ± | |
---|---|---|---|---|---|
Labour | Charles Mudd | 1,101 | |||
Labour | Eva Armsby | 1,094 | |||
Labour | Jeremiah Long | 1,038 | |||
East London People's Alliance | John Quarrell | 287 | |||
Conservative | Anthony Spiterie | 266 | |||
Conservative | Alan Minnerthey | 254 | |||
National Front | Thomas Underwood | 155 | |||
Limehouse and Ratcliffe Road Action Group | Christopher Idle | 149 | |||
Limehouse and Ratcliffe Road Action Group | John Chesshyre | 146 | |||
Communist | Albert Common | 92 | |||
Majority | |||||
Turnout | 6,059 | 30.9 | |||
Party | Candidate | Votes | % | ± | |
---|---|---|---|---|---|
Labour | William Harris | 950 | |||
Labour | Annie Elboz | 941 | |||
Labour | Geoffrey White | 835 | |||
Socialist Unity | Hilda Kean | 377 | |||
Socialist Workers | Colin Knowles | 325 | |||
Socialist Unity | Dave Lawrence | 318 | |||
Conservative | William Dove | 163 | |||
East London People's Alliance | John Fresco | 145 | |||
East London People's Alliance | Phyllis Barber | 125 | |||
National Front | Albert Bennett | 87 | |||
Majority | |||||
Turnout | 6,273 | 28.5 | |||
Party | Candidate | Votes | % | ± | |
---|---|---|---|---|---|
Labour | Lillian Crook | 748 | |||
Labour | Charles Main | 735 | |||
Labour | Arthur Praag | 690 | |||
Liberal | Paul Robbins | 573 | |||
Liberal | Carol McLeod | 555 | |||
Liberal | Henry Stallman | 510 | |||
Conservative | Jonathan Fairhurst | 231 | |||
National Front | Roy Newman | 216 | |||
National Front | Terence Courtney | 214 | |||
National Front | Brian Gilbert | 213 | |||
Majority | |||||
Turnout | 6,609 | 28.5 | |||
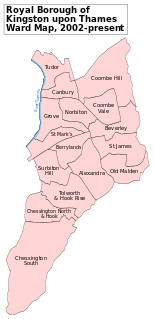
Kingston upon Thames Council is elected every four years.
Lambeth London Borough Council is elected every four years.
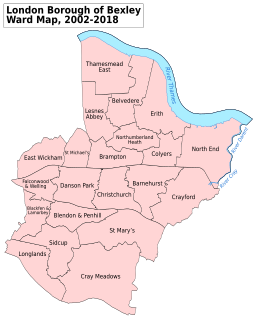
Bexley Council in London, England is elected every four years.
Bromley Council is elected every four years.
Ealing Council is elected every four years.
Redbridge London Borough Council is elected every four years.
The London Borough of Lewisham is a London borough, in the United Kingdom, established in 1964. Elections are held every four years using a plurality bloc vote electoral system for the councillors and the supplementary vote electoral system for the elected mayor.
Hounslow Council in London, England is elected every four years. 60 councillors are elected from 20 wards, with by-elections held to fill any vacancies between elections.
Sutton London Borough Council in London, England is elected every four years.
Haringey Council in London, England is elected every four years.
Havering London Borough Council in London, England is elected every four years. Since the last boundary changes in 2002, 54 councillors have been elected from 18 wards.
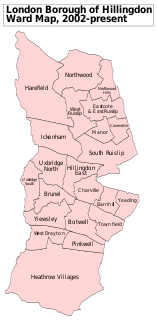
Hillingdon Council in London, England is elected every four years. Since the 2002 boundary changes the council is composed of 65 councillors.
Westminster City Council, the local authority of the City of Westminster in London, England, is elected every four years. Since the last boundary changes in 2002, 60 councillors have been elected from 20 wards.
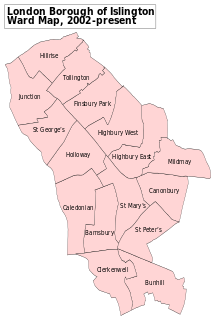
Islington London Borough Council in London, England is elected every four years. Since the last boundary changes in 2002, 48 councillors have been elected from 16 wards.
Greenwich London Borough Council in London, England is elected every four years. Since the last boundary changes in 2002, 51 councillors have been elected from 17 wards.
Wandsworth London Borough Council in London, England, is elected every four years. Since the last boundary changes in 2002, 60 councillors have been elected from 20 wards.
The 1974 Barking Council election took place on 2 May 1974 to elect members of Barking London Borough Council in London, England. The whole council was up for election and the Labour party stayed in overall control of the council.
The 1978 Barking Council election took place on 4 May 1978 to elect members of Barking London Borough Council in London, England. The whole council was up for election and the Labour party stayed in overall control of the council.
The 1978 Hammersmith Council election took place on 4 May 1978 to elect members of Hammersmith London Borough Council in London, England. The whole council was up for election and the council went in no overall control.
The 1978 Richmond upon Thames Council election took place on 4 May 1978 to elect members of Richmond upon Thames London Borough Council in London, England. The whole council was up for election and the Conservative party stayed in overall control of the council.