| ||||||||||||||||||||||||||||
All 45 seats to Bexley London Borough Council 23 seats needed for a majority | ||||||||||||||||||||||||||||
---|---|---|---|---|---|---|---|---|---|---|---|---|---|---|---|---|---|---|---|---|---|---|---|---|---|---|---|---|
| ||||||||||||||||||||||||||||
Council composition after the election. †Notional 2014 results based on new electoral boundaries, as calculated by the BBC. *Indicates boundary change - so this is a notional figure. | ||||||||||||||||||||||||||||
|
The 2018 Bexley Council election took place on 3 May 2018 to elect members of Bexley Council in England. This was on the same day as other local elections.
Bexley London Borough Council is the local authority for the London Borough of Bexley in the ceremonial county of Greater London, England. It is one of 32 London borough council in the county. The council comprises 45 councillors.
There were boundary changes which reduced the number of wards from 21 to 17 and the number of councillors from 63 to 45.
The Conservatives retained control of the council, winning 34 of the new seats. Labour won 11 and UKIP won no seats. [1]
Party | Seats | Gains | Losses | Net gain/loss | Seats % | Votes % | Votes | +/− | |
---|---|---|---|---|---|---|---|---|---|
Conservative | 34 | 0 | 1 | -1† | 75.6 | 50.4 | 35,207 | +12.3 | |
Labour | 11 | 1 | 0 | +1† | 24.4 | 33.7 | 23,564 | +8.0 | |
Liberal Democrat | 0 | 0 | 0 | 0 | 5.7 | 3,977 | +3.0 | ||
UKIP | 0 | 0 | 0 | 0 | 5.6 | 3,888 | -16.9 | ||
Green | 0 | 0 | 0 | 0 | 1.7 | 1,159 | +0.2 | ||
Independent | 0 | 0 | 0 | 0 | 1.2 | 809 | +0.1 | ||
Others | 0 | 0 | 0 | 0 | 1.9 | 1,295 | -6.3 |
†Notional changes calculated by the BBC. [3]
Party | Candidate | Votes | % | ± | |
---|---|---|---|---|---|
Conservative | Brian Bishop | 1,833 | 29% | ||
Conservative | Howard Jackson | 1,751 | 28% | ||
Labour | Alexis Chase | 1,060 | 17 | ||
Labour | Ali Ali | 1,033 | 17 | ||
UKIP | Harry Buttar | 282 | 5 | ||
UKIP | Mike Ferro | 280 | 4 | ||
Conservative hold | Swing | ||||
Conservative hold | Swing |
Barnehurst became a 2 member ward in 2018, following the cutdown on councilors from 63 to 45. Brian Bishop became Mayor of Bexley after this election.
Party | Candidate | Votes | % | ± | |
---|---|---|---|---|---|
Labour | Sally Hinkley | 2,403 | 21 | ||
Labour | Daniel Francis | 2,353 | 21 | ||
Labour | Dave Putson | 2,307 | 20 | ||
Conservative | Graham Anthony Moon | 1,457 | 13 | ||
Conservative | Frazer Lewis Brooks | 1,429 | 13 | ||
Conservative | Natalie Price | 1,330 | 12 | ||
Labour hold | Swing | ||||
Labour hold | Swing |
Leader of the Opposition in Bexley, Daniel Francis, stood here.
Party | Candidate | Votes | % | ± | |
---|---|---|---|---|---|
Conservative | Sue Gower | 2,806 | 21 | ||
Conservative | Eileen Patricia Mary Pallen | 2,770 | 21 | ||
Conservative | Brad Smith | 2,765 | 21 | ||
Labour | Liam Davies | 1,280 | 10 | ||
Labour | Pauline Turner | 1,223 | 9 | ||
Labour | Keri Hacker | 1,126 | 9 | ||
Liberal Democrat | David Hall | 413 | 3 | ||
UKIP | John Dunford | 361 | 3 | ||
UKIP | Paula Dunford | 325 | 3 | ||
Conservative win (new seat) | |||||
Conservative win (new seat) |
Party | Candidate | Votes | % | ± | |
---|---|---|---|---|---|
Conservative | Peter Craske | 2,688 | 21 | ||
Conservative | James Hunt | 2,686 | 21 | ||
Conservative | Cafer Munur | 2,110 | 17 | ||
Labour | Daniel Jenkins | 1,179 | 9 | ||
Labour | Kathy Steedman | 1,100 | 9 | ||
Labour | Rob Parish | 1,011 | 8 | ||
Independent | Becci McManus | 809 | 6 | ||
UKIP | Lynn Smith | 611 | 5 | ||
Liberal Democrat | Lewis Ilsley | 530 | 4 | ||
Conservative hold | Swing | ||||
Conservative gain from UKIP | Swing | ||||
Party | Candidate | Votes | % | ± | |
---|---|---|---|---|---|
Conservative | Adam Lloyd Wildman | 2,835 | 23% | ||
Conservative | Nick O'Hare | 2,759 | 23% | ||
Conservative | David Leaf | 2,683 | 22% | ||
Labour | Pat Ball | 1,098 | 9% | ||
Labour | Chris Mace | 978 | 8% | ||
Labour | Brian Silk | 917 | 8% | ||
UKIP | Linda Harris | 497 | 4% | ||
Liberal Democrat | Jawharah Albakri | 334 | 3% | ||
Conservative hold | Swing | ||||
Conservative hold | Swing |
Party | Candidate | Votes | % | ± | |
---|---|---|---|---|---|
Conservative | Melvin Seymour | 1,958 | 18% | ||
Conservative | Geraldine Lucia-Hennis | 1,918 | 18% | ||
Conservative | Christine Bishop | 1,896 | 18% | ||
Labour | Anna Day | 1,489 | 14% | ||
Labour | Elizabeth Folarin | 1,270 | 12% | ||
Labour | Munir Malik | 1,254 | 12% | ||
UKIP | Keith Forster | 460 | 4% | ||
Liberal Democrat | Sean Michael Peter Ash | 375 | 4% | ||
Conservative hold | Swing | ||||
Conservative hold | Swing |
Party | Candidate | Votes | % | ± | |
---|---|---|---|---|---|
Conservative | Linda Bailey | 2,922 | 22% | ||
Conservative | Teresa O'Neill | 2,843 | 21% | ||
Conservative | Sybil Camsey | 2,785 | 21% | ||
Labour | Janet Mary Mace | 1,482 | 11% | ||
Labour | Shekhar Vyas | 1,458 | 11% | ||
Labour | Andy Smith | 1,430 | 11% | ||
Liberal Democrat | Gem Ahmet | 440 | 3% | ||
Conservative win (new seat) | |||||
Conservative win (new seat) |
Leader of the Council, Teresa O'Neill, stood here, following the abolition of her previous ward; Brampton
Party | Candidate | Votes | % | ± | |
---|---|---|---|---|---|
Conservative | Steven Hall | 2,473 | 20% | ||
Conservative | Caroline Newton | 2,341 | 19% | ||
Conservative | Christine Catterall | 2,308 | 19% | ||
Labour | Sam Marchant | 1,727 | 14% | ||
Labour | Anthony Riches | 1,558 | 13% | ||
Labour | Victoria Ankintomide | 1,536 | 12% | ||
BNP | Michael Jones | 398 | 3% | ||
Conservative hold | Swing | ||||
Conservative hold | Swing |
Party | Candidate | Votes | % | ± | |
---|---|---|---|---|---|
Labour | Joe Ferreira | 1,463 | 32% | ||
Labour | Nicola Taylor | 1,447 | 32% | ||
Conservative | Irene Reader | 747 | 17% | ||
Conservative | Eliot Smith | 697 | 14% | ||
BNP | Pamela Mackie | 154 | 3% | ||
Labour hold | Swing | ||||
Labour hold | Swing |
Erith became a 2 member ward, following the cutdown of councillors from 63 to 45.
Party | Candidate | Votes | % | ± | |
---|---|---|---|---|---|
Conservative | Nigel Betts | 2,641 | 20% | ||
Conservative | Val Clark | 2,470 | 19% | ||
Conservative | Louie French | 2,317 | 17% | ||
Labour | David Lovelace | 1,437 | 11% | ||
Labour | Matthew Murphy | 1,326 | 10% | ||
Labour | Murali Surendran | 1,302 | 10% | ||
UKIP | Malcolm Clarke | 426 | 3% | ||
Green | Elisabeth Radbon | 420 | 3% | ||
UKIP | Frank Thomas Gould | 328 | 2% | ||
UKIP | Pamela Perrin | 292 | 2% | ||
Liberal Democrat | Robin Paul Kelly | 233 | 2% | ||
BNP | Jaymie Ryan McCoy | 101 | 1% | ||
Conservative hold | Swing | ||||
Conservative hold | Swing |
Damayanthi Holbourne was a Labour candidate until she was deselected for social media posts, and replaced with Matthew Murphy
Party | Candidate | Votes | % | ± | |
---|---|---|---|---|---|
Conservative | Gareth Bacon | 2,038 | 34% | ||
Conservative | Andy Dourmoush | 1,672 | 28% | ||
Labour | Ana Davies | 868 | 15% | ||
Labour | Donna Briant | 817 | 14% | ||
Liberal Democrat | Paul Hurren | 353 | 6% | ||
UKIP | Graham Harris | 212 | 4% | ||
Conservative hold | Swing | ||||
Conservative hold | Swing |
Longlands became a 2 member ward after the cutdown of councillors from 63 to 45
Party | Candidate | Votes | % | ± | |
---|---|---|---|---|---|
Conservative | John Fuller | 1,419 | 25% | ||
Labour | Wendy Perfect | 1,333 | 23% | ||
Conservative | Ray Sams | 1,331 | 23% | ||
Labour | Aisha Malik-Smith | 1,301 | 23% | ||
Liberal Democrat | Paul Andrew Bargery | 215 | 4% | ||
BNP | Robert David Harris | 160 | 3% | ||
Conservative hold | Swing | ||||
Labour gain from Conservative | Swing | ||||
Northumberland Heath became a 2 member ward in 2018, after the cutdown of councillors from 63 to 45.
Party | Candidate | Votes | % | ± | |
---|---|---|---|---|---|
Conservative | Cheryl Bacon | 2,597 | 21% | ||
Conservative | June Slaughter | 2,426 | 20% | ||
Conservative | Richard Thornton Diment | 2,314 | 19% | ||
Labour | Peter Edward Charles | 1,095 | 9% | ||
Labour | Jo Choda | 1,094 | 9% | ||
Labour | Derek Charles Steedman | 931 | 8% | ||
Green | Jonathan Scot Rooks | 450 | 4% | ||
Liberal Democrat | Simone Reynolds | 366 | 3% | ||
UKIP | David Kurten | 296 | 2% | ||
Liberal Democrat | Adrian Paul | 292 | 2% | ||
Liberal Democrat | David Sexton | 260 | 2% | ||
BNP | John Brooks | 130 | 1% | ||
Liberal | Laurence Williams | 82 | 1% | ||
Conservative hold | Swing | ||||
Conservative hold | Swing |
Party | Candidate | Votes | % | ± | |
---|---|---|---|---|---|
Labour | Brenda Langstead | 1,291 | 29% | ||
Labour | Stefano Borella | 1,272 | 29% | ||
Conservative | Graham D'Amiral | 668 | 15% | ||
Conservative | Viny Poon | 575 | 13% | ||
UKIP | Mac McGannon | 305 | 7% | ||
Green | Sophie Nicole Chaise | 289 | 7% | ||
Labour win (new seat) | |||||
Labour win (new seat) |
Party | Candidate | Votes | % | ± | |
---|---|---|---|---|---|
Conservative | Alan Downing | 2,273 | 37% | ||
Conservative | Alex Sawyer | 2,049 | 33% | ||
Labour | Teresa Bernadette Gray | 788 | 13% | ||
Labour | John Browning | 747 | 12% | ||
Liberal Democrat | David Nicolle | 328 | 5% | ||
Conservative win (new seat) | |||||
Conservative win (new seat) |
Party | Candidate | Votes | % | ± | |
---|---|---|---|---|---|
Labour | Esther Amaning | 1,932 | 25% | ||
Labour | Danny Hackett | 1,868 | 24% | ||
Labour | Mabel Ogundayo | 1,856 | 24% | ||
Conservative | Mark Brooks | 661 | 9% | ||
Conservative | Elzbieta Boryslawska | 596 | 8% | ||
Conservative | Bonny Umeadi | 490 | 6% | ||
Christian Peoples | Endy Ezenwata | 270 | 4% | ||
Labour hold | Swing | ||||
Labour hold | Swing |
Former Labour councillor, Endy Ezenwata, defected to the Christian People's Alliance and subsequently lost re-election. Former councillor for Lesnes Abbey, Danny Hackett, stood here following the abolition of his former ward.
Party | Candidate | Votes | % | ± | |
---|---|---|---|---|---|
Conservative | Peter Reader | 2,831 | 21% | ||
Conservative | John Davey | 2,726 | 20% | ||
Conservative | Phillip Read | 2,663 | 20% | ||
Labour | Ian McCawley | 1,639 | 12% | ||
Labour | Ade Osayomi | 1,361 | 10% | ||
Labour | Folasade Oduja | 1,324 | 10% | ||
UKIP | Steve Reader | 438 | 3% | ||
Liberal Democrat | Stuart Weedon | 390 | 3% | ||
Conservative win (new seat) | |||||
Conservative win (new seat) |
Mayor of the time, Peter Reader, stood here. John Davey became deputy mayor after the election.
Birmingham City Council is the local government body responsible for the governance of the City of Birmingham in England, which has been a metropolitan district since 1974. It is the most populated local council in the United Kingdom with, following a reorganisation of boundaries in June 2004, 120 Birmingham City councillors representing over one million people, in 40 wards. This means that Birmingham is technically the largest city in the United Kingdom. The council headquarters are at the Council House in the city centre. The council is responsible for running nearly all local services, with the exception of those run by joint boards. The provision of certain services has in recent years been devolved to several council constituencies, which each have a constituency committee made up of councillors from that district.
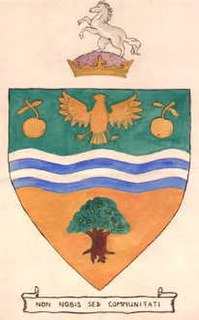
Bexley was a local government district in north west Kent from 1879 to 1965 around the town of Old Bexley.
The Social Democratic Party is a minor political party in the United Kingdom, established in 1990. It traces its origin to the Social Democratic Party (SDP) which was formed in 1981 by a group of dissident Labour Party Members of Parliament (MPs) and former MPs: Roy Jenkins, David Owen, Bill Rodgers and Shirley Williams, who became known as the ‘Gang of Four’. The original SDP merged with the Liberal Party in 1988 to form the Liberal Democrats, but Owen, two other MPs and a minority of party activists formed a breakaway group with the same name immediately afterward. That party continuing dissolved itself in 1990, but some activists met and voted to continue the party in defiance of its National Executive, leading to the creation of a new Social Democratic Party.
The County Council of the City and County of Cardiff is the governing body for Cardiff, one of the Principal Areas of Wales. The council consists of 75 councillors, representing 29 electoral wards. The authority is properly styled as The County Council of the City and County of Cardiff or in common use Cardiff Council. No other style is sanctioned for use on Council Documents although it does occasionally appear wrongly as Cardiff County Council on documents and signage. The City & County itself is usually simply referred to as Cardiff.
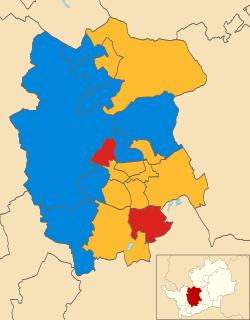
The 2006 St Albans City and District Council election took place on 4 May 2006 to elect members of St Albans District Council in Hertfordshire, England. One third of the council was up for election and the Liberal Democrats gained overall control of the council from no overall control.
The 2007 St Albans City and District Council election took place on 3 May 2007 to elect members of St Albans District Council in Hertfordshire, England. One third of the council was up for election and the Liberal Democrats lost overall control of the council to no overall control.
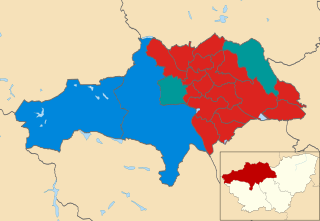
The 2011 Barnsley Metropolitan Borough Council election took place on 5 May 2011 to elect members of Barnsley Metropolitan Borough Council in South Yorkshire, England. One third of the council was up for election and the Labour party stayed in overall control of the council.
The 2008 Basildon District Council election took place on 1 May 2008 to elect members of Basildon District Council in Essex, England. One third of the council was up for election and the Conservative party stayed in overall control of the council.
The 2007 Carlisle City Council election took place on 3 May 2007 to elect members of Carlisle District Council in Cumbria, England. One third of the council was up for election and the council stayed under no overall control.
The 2011 Carlisle City Council election took place on 5 May 2011 to elect members of Carlisle District Council in Cumbria, England. One third of the council was up for election and the council stayed under no overall control.
The 2014 Barking and Dagenham Council election took place on 23 May 2014 to elect members of Barking and Dagenham Council in England. This was on the same day as other local elections.
The 2014 Harlow District Council election took place on 22 May 2014 to elect members of Harlow District Council in Essex, England. One third of the council was up for election and the Labour party stayed in overall control of the council.
The 2014 St Helens Metropolitan Borough Council election took place on 22 May 2014 to elect members of St Helens Metropolitan Borough Council in Merseyside, England. One third of the council was up for election and the Labour party stayed in overall control of the council.
The 1964 Bexley Council election took place on 7 May 1964 to elect members of Bexley London Borough Council in London, England. The whole council was up for election and the Labour party gained control of the council.
Ely is the name of an electoral ward in the west of the city of Cardiff, Wales, which covers its namesake community, Ely. The ward elects three county councillors to the County Council of the City and County of Cardiff. It has previously been represented by the Labour Party, until February 2019 when Plaid Cymru won one of the council seats.
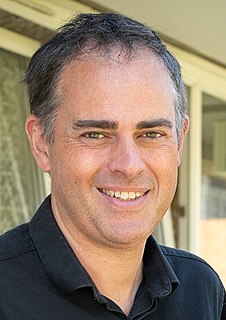
The 2018 Lambeth Council election took place on 3 May 2018 to elect members of Lambeth Council in England. The election saw Labour remain in control of Lambeth Council with a slightly reduced majority, winning over 90% of the seats. The Green Party of England and Wales achieved its best-ever result in the borough, winning 5 seats and becoming the official opposition.
Aspire is a minor political party in the London Borough of Tower Hamlets made up of councillors elected as members of Tower Hamlets First. After Tower Hamlets First was removed from the register following voting fraud and malpractice, its councillors formed the Tower Hamlets Independent Group (THIG). After some defections, the remaining Tower Hamlets Independent Group councillors later registered formally as a political party in January 2018. Most of their elected members were former Labour Party members, but there are a few exceptions. It was the largest and the main political opposition with elected councillors at the Tower Hamlets Council prior to the 2018 May elections.
The 2018 Leeds City Council election took place on 3 May 2018 to elect members of Leeds City Council in England. They were held on the same day as other local elections across England and the rest of the UK.
The 2018 City of Bradford Metropolitan District Council took place on 3 May 2018 to elect members of Bradford District Council in England. This was on the same day as other local elections. One councillor was elected in each ward for a four-year term so the councillors elected in 2018 last stood for election in 2014. Each ward is represented by three councillors, the election of which is staggered, so only one third of the councillors were elected in this election. Before the election there was a Labour majority and afterwards Labour had increased their majority.
The Morley Borough Independents (MBI) are a local political party in Leeds, West Yorkshire, founded in 2004.