The 2010 Enfield Council election took place on 6 May 2010 to elect members of Enfield London Borough Council in London, England. The whole council was up for election and the Labour party gained overall control of the council from the Conservative party. [1]
The London Borough of Enfield is a London borough in north London, England. It borders the London Boroughs of Barnet, Haringey and Waltham Forest, the districts of Hertsmere, Welwyn Hatfield and Broxbourne in Hertfordshire, and Epping Forest in Essex. The local authority is Enfield Council.
England is a country that is part of the United Kingdom. It shares land borders with Wales to the west and Scotland to the north-northwest. The Irish Sea lies west of England and the Celtic Sea lies to the southwest. England is separated from continental Europe by the North Sea to the east and the English Channel to the south. The country covers five-eighths of the island of Great Britain, which lies in the North Atlantic, and includes over 100 smaller islands, such as the Isles of Scilly and the Isle of Wight.
The Labour Party is a centre-left political party in the United Kingdom which has been described as an alliance of social democrats, democratic socialists and trade unionists. The party's platform emphasises greater state intervention, social justice and strengthening workers' rights.
The last election in 2006 had the Conservatives hold a majority with 34 seats, compared to 27 for Labour and 2 from the Save Chase Farm group. [2] Between 2006 and 2010 Labour gained a seat from the Conservatives in February 2009 at a by-election in Jubilee ward, but a Labour councillor Denise Headley defected to the Conservatives in August 2009. [3] [4]
Save Chase Farm was a local British political party that stood against the closure of departments of Chase Farm Hospital, Enfield.
By-elections, also spelled bye-elections, are used to fill elected offices that have become vacant between general elections.
A Councillor is a member of a local government council.
11 councillors stood down at the election, 7 Conservatives and 4 Labour, including the leader of the Labour group Jeff Rodin. [5] Parties standing at the election, included the Green party who stood in every ward for the first time, the UK Independence Party who had 5 candidates and the British National Party who had 4. [5]
The Green Party of England and Wales is a green, left-wing political party in England and Wales. Headquartered in London, since September 2018, its co-leaders are Siân Berry and Jonathan Bartley. The Green Party has one representative in the House of Commons, one in the House of Lords, and three in the European Parliament. In addition, it has various councillors in UK local government and two members of the London Assembly.
The UK Independence Party is a hard Eurosceptic, right-wing political party in the United Kingdom. It currently has one representative in the House of Lords and seven Members of the European Parliament (MEPs). It has three Assembly Members (AMs) in the National Assembly for Wales and one member in the London Assembly. The party reached its greatest level of success in the mid-2010s, when it gained two Members of Parliament and was the largest UK party in the European Parliament.
The British National Party (BNP) is a far-right, fascist political party in the United Kingdom. It is headquartered in Wigton, Cumbria, and its current leader is Adam Walker. A minor party, it has no elected representatives at any level of UK government. Founded in 1982, the party reached its greatest level of success in the 2000s, when it had over fifty seats in local government, one seat on the London Assembly, and two Members of the European Parliament.
Labour gained control with 36 seats after winning all 3 seats in 12 wards, while the Conservatives won 27 seats in 9 wards. [6] Labour dominated the east of the borough, while the Conservatives held the seats in the west. [7] Wards where Labour gained from the Conservatives included Enfield Lock, Palmers Green, Southbury and Turkey Street, but the Conservatives gained 2 seats from Save Chase Farm councillors. [7] [8]
Enfield Lock is an area in the London Borough of Enfield, north London. It is approximately located east of the Hertford Road between Turkey Street and the Holmesdale Tunnel overpass, and extends to the River Lee Navigation, including the Enfield Island Village. The locality gains its name from the lock on the River Lee Navigation. Today's Enfield Lock was rebuilt in 1922. The area forms part of the Lee Valley Park and the Enfield Lock Conservation Area. On its eastern boundary Enfield Lock has marshland formerly used as a testing site between the Royal Small Arms Factory and the Gunpowder Mills. To the south is Brimsdown, the north Waltham Cross and to the west Bullsmoor and Freezywater. Enfield Lock forms part of the London boundary.
Palmers Green is a suburban area of the London Borough of Enfield in north London, England. It is located within the N13 postcode district, around 8 miles (13 km) north of Charing Cross. It is home to the largest population of Greek Cypriots outside Cyprus and is often nicknamed "Little Cyprus" or "Palmers Greek".
Following the election Doug Taylor became the new Labour leader of the council, after being elected unopposed as the leader of the Labour group. [9]
Party | Seats | Gains | Losses | Net gain/loss | Seats % | Votes % | Votes | +/− | |
---|---|---|---|---|---|---|---|---|---|
Labour | 36 | 9 | 0 | +9 | 57.1 | 42.7 | 152,873 | +9.0% | |
Conservative | 27 | 2 | 9 | -7 | 42.9 | 42.2 | 151,068 | -5.0% | |
Liberal Democrat | 0 | 0 | 0 | 0 | 0 | 8.3 | 29,687 | +0.4% | |
Green | 0 | 0 | 0 | 0 | 0 | 4.5 | 16,131 | +0.7% | |
UKIP | 0 | 0 | 0 | 0 | 0 | 0.9 | 3,246 | -0.2% | |
Save Chase Farm | 0 | 0 | 2 | -2 | 0 | 0.8 | 2,973 | -5.3% | |
BNP | 0 | 0 | 0 | 0 | 0 | 0.5 | 1,733 | +0.5% | |
Party | Candidate | Votes | % | ± | |
---|---|---|---|---|---|
Labour | Yasemin Brett | 2,400 | |||
Labour | Achilleas Georgiou | 2,283 | |||
Labour | Alan Sitkin | 1,834 | |||
Conservative | Adil Certel | 1,489 | |||
Conservative | Howard Leithead | 1,327 | |||
Conservative | Mehmet Imamzade | 1,277 | |||
Green | Laura Davenport | 968 | |||
Liberal Democrat | Sarah Dodgson | 945 | |||
Liberal Democrat | Rosemary Edmonds | 805 | |||
Liberal Democrat | Leslie Dubow | 664 | |||
Green | Jack Johnson | 629 | |||
Green | Peter Krakowiak | 537 | |||
Turnout | 15,158 | 60.4 | +23.5 | ||
Labour hold | Swing | ||||
Party | Candidate | Votes | % | ± | |
---|---|---|---|---|---|
Conservative | Jonas Hall | 3,451 | |||
Conservative | Denise Headley | 3,225 | |||
Conservative | Eleftherios Savva | 3,224 | |||
Labour | Grace Loake | 2,230 | |||
Labour | Paul Sceeny | 2,077 | |||
Labour | Ivor Wigget | 2,049 | |||
Liberal Democrat | George Achillea | 1,747 | |||
Green | Douglas Coker | 942 | |||
UKIP | Gwyneth Rolph | 618 | |||
Turnout | 19,563 | 69.6 | +27.4 | ||
Conservative hold | Swing | ||||
Party | Candidate | Votes | % | ± | |
---|---|---|---|---|---|
Conservative | Simon Maynard | 2,892 | |||
Conservative | Marcus East | 2,604 | |||
Conservative | Tom Waterhouse | 2,526 | |||
Labour | Jo Hamilton | 1,925 | |||
Labour | Vicki Pite | 1,756 | |||
Labour | Terence McManus | 1,696 | |||
Save Chase Farm | Kate Wilkinson | 1,282 | |||
Liberal Democrat | Lorice Stainer | 1,215 | |||
Green | Jim Osborne | 775 | |||
UKIP | Roy Freshwater | 559 | |||
Turnout | 17,230 | 67.0 | +24.4 | ||
Conservative hold | Swing | ||||
Conservative gain from Save Chase Farm | Swing | ||||
Party | Candidate | Votes | % | ± | |
---|---|---|---|---|---|
Conservative | Paul McCannah | 4,032 | |||
Conservative | Michael Lavender | 4,016 | |||
Conservative | Lionel Zetter | 3,319 | |||
Labour | Brian Barford | 1,599 | |||
Labour | Ewan Flynn | 1,564 | |||
Labour | Timothy Leaver | 1,476 | |||
Liberal Democrat | David Peters | 1,364 | |||
Green | Joe Phillips | 704 | |||
Turnout | 18,074 | 65.5 | +28.2 | ||
Conservative hold | Swing | ||||
Party | Candidate | Votes | % | ± | |
---|---|---|---|---|---|
Labour | Jayne Buckland | 3,442 | |||
Labour | Chris Murphy | 3,337 | |||
Labour | Andrew Stafford | 2,971 | |||
Conservative | Lauren Bennett | 1,476 | |||
Conservative | Ibrahim Issaq | 1,191 | |||
Conservative | Karruna-Thewi Ratnarajan | 1,074 | |||
Liberal Democrat | Simeon Alamezie | 1,016 | |||
Green | Alon Prytherch | 490 | |||
Turnout | 14,997 | 57.9 | +24.7 | ||
Labour hold | Swing | ||||
Labour gain from Conservative | Swing | ||||
Labour hold | Swing | ||||
Party | Candidate | Votes | % | ± | |
---|---|---|---|---|---|
Labour | Toby Simon | 3,003 | |||
Labour | Alev Cazimoglu | 2,876 | |||
Labour | Dino Lemonides | 2,850 | |||
Conservative | Bill Price | 2,038 | |||
Conservative | Lindsay Rawlings | 1,705 | |||
Conservative | Richard Reynolds | 1,690 | |||
Liberal Democrat | Frances Carman | 842 | |||
UKIP | Madge Jones | 537 | |||
BNP | Marie Nicholas | 450 | |||
Green | Theresa Stibbe | 437 | |||
Turnout | 16,428 | 59.8 | +23.5 | ||
Labour hold | Swing | ||||
Party | Candidate | Votes | % | ± | |
---|---|---|---|---|---|
Labour | Christine Hamilton | 3,073 | |||
Labour | Nneka Keazor | 2,794 | |||
Labour | Ozzie Uzoanya | 2,665 | |||
Conservative | Ruth Hones | 1,939 | |||
Conservative | Penny Heathwood | 1,859 | |||
Conservative | Lee Sanders | 1,754 | |||
Liberal Democrat | Hannie Strange | 934 | |||
Green | David Flint | 577 | |||
UKIP | Gary Robbens | 540 | |||
BNP | Steve Squire | 477 | |||
Turnout | 16,612 | 61.4 | +28.0 | ||
Labour gain from Conservative | Swing | ||||
Labour hold | Swing | ||||
Party | Candidate | Votes | % | ± | |
---|---|---|---|---|---|
Conservative | Terence Neville | 4,070 | |||
Conservative | Chris Joaniddes | 4,022 | |||
Conservative | Glynis Vince | 3,874 | |||
Labour | Edward Jones | 1,716 | |||
Labour | Hazel Kinsler | 1,566 | |||
Labour | Stephen Butters | 1,521 | |||
Liberal Democrat | Enrique Boo | 1,327 | |||
Green | Gabrielle Lobb | 871 | |||
Turnout | 18,967 | 72.0 | +28.0 | ||
Conservative hold | Swing | ||||
Party | Candidate | Votes | % | ± | |
---|---|---|---|---|---|
Labour | George Savva | 3,106 | |||
Labour | Ali Bakir | 2,988 | |||
Labour | Patricia Ekechi | 2,902 | |||
Conservative | Paul Edwards | 1,717 | |||
Conservative | Nilifer Erbil | 1,440 | |||
Conservative | David Schofield | 1,393 | |||
Liberal Democrat | Stephen Savva | 1,040 | |||
Green | Liz Wright | 552 | |||
Turnout | 15,138 | 61.2 | +27.5 | ||
Labour hold | Swing | ||||
Party | Candidate | Votes | % | ± | |
---|---|---|---|---|---|
Conservative | Jon Kaye | 4,073 | |||
Conservative | Don Delman | 4,019 | |||
Conservative | Anne-Marie Pearce | 3,773 | |||
Labour | Rebecca Davies | 1,901 | |||
Labour | Martin Hegarty | 1,609 | |||
Liberal Democrat | Vivien Dalling | 1,478 | |||
Labour | Vincent Sutherland | 1,316 | |||
Green | Andreea Malin | 790 | |||
Turnout | 18,959 | 70.3 | +25.3 | ||
Conservative hold | Swing | ||||
Party | Candidate | Votes | % | ± | |
---|---|---|---|---|---|
Labour | Ahmet Hasan | 2,870 | |||
Labour | Christopher Deacon | 2,862 | |||
Labour | Rohini Simbodyal | 2,682 | |||
Conservative | Jason George | 1,943 | |||
Conservative | Ersin Celebi | 1,942 | |||
Conservative | Hasan Hurer | 1,728 | |||
Liberal Democrat | Ramis Cizer | 807 | |||
Green | Geoffrey Kemball-Cook | 458 | |||
Turnout | 15,292 | 62.1 | +22.4 | ||
Labour hold | Swing | ||||
Party | Candidate | Votes | % | ± | |
---|---|---|---|---|---|
Labour | Ingrid Cranfield | 3,401 | |||
Labour | Geoff Robinson | 3,261 | |||
Labour | Ahmet Oykener | 3,234 | |||
Conservative | Ken Hinds | 1,682 | |||
Conservative | Alper Kurtaran | 1,309 | |||
Conservative | Gulseren Sahin | 1,253 | |||
Liberal Democrat | Graham Beech | 1,079 | |||
Green | Joe Jones | 621 | |||
Turnout | 15,840 | 61.1 | +27.9 | ||
Labour hold | Swing | ||||
Party | Candidate | Votes | % | ± | |
---|---|---|---|---|---|
Labour | Bembos Charalambous | 3,351 | |||
Labour | Chris Cole | 2,950 | |||
Labour | Del Goddard | 2,419 | |||
Conservative | Kieron Farrelly | 2,154 | |||
Conservative | Henry Pipe | 2,146 | |||
Conservative | Marina Savva | 2,002 | |||
Liberal Democrat | Brendan Malone | 1,294 | |||
Green | Nicholas Wall | 723 | |||
BNP | Angelos Gavriel | 233 | |||
Turnout | 17,272 | 64.8 | +25.8 | ||
Labour hold | Swing | ||||
Labour gain from Conservative | Swing | ||||
Labour hold | Swing | ||||
Party | Candidate | Votes | % | ± | |
---|---|---|---|---|---|
Labour | Chaudhury Anwar | 3,119 | |||
Labour | Doug Taylor | 3,049 | |||
Labour | Ayfer Orhan | 2,934 | |||
Conservative | Pamela Adams | 1,507 | |||
Conservative | Michael Antoniou | 1,417 | |||
Conservative | Mustafa Uluhan | 1,314 | |||
Liberal Democrat | Joy Wiggett | 898 | |||
Green | Rod Goodyer | 522 | |||
Turnout | 14,760 | 58.6 | +27.8 | ||
Labour hold | Swing | ||||
Party | Candidate | Votes | % | ± | |
---|---|---|---|---|---|
Labour | Christopher Bond | 2,782 | |||
Labour | Caitriona Bearryman | 2,604 | |||
Labour | Derek Levy | 2,446 | |||
Conservative | Lee Chamberlain | 2,366 | |||
Conservative | Peter Fallart | 2,197 | |||
Conservative | Adele Panayi | 1,881 | |||
Liberal Democrat | Stelios Morphakis | 1,039 | |||
Green | Chris Van Driel | 604 | |||
UKIP | Fred Rolph | 506 | |||
Turnout | 16,425 | 59.8 | +19.8 | ||
Labour hold | Swing | ||||
Labour gain from Conservative | Swing | ||||
Party | Candidate | Votes | % | ± | |
---|---|---|---|---|---|
Conservative | Robert Hayward | 2,914 | |||
Conservative | Daniel Pearce | 2,795 | |||
Conservative | Edward Smith | 2,626 | |||
Liberal Democrat | Dawn Barnes | 1,820 | |||
Labour | Mervyn Maggs | 1,777 | |||
Labour | Ed Cowling | 1,674 | |||
Labour | Daniel Sitkin | 1,485 | |||
Liberal Democrat | Dervish Mertcan | 1,426 | |||
Liberal Democrat | Paul Smith | 1,298 | |||
Green | Geri Saccomanno | 536 | |||
Turnout | 18,351 | 65.3 | +30.0 | ||
Conservative hold | Swing | ||||
Party | Candidate | Votes | % | ± | |
---|---|---|---|---|---|
Conservative | Alan Barker | 2,840 | |||
Conservative | Henry Lamprecht | 2,709 | |||
Conservative | Ann Zinkin | 2,630 | |||
Labour | Betty Costello | 2,442 | |||
Labour | Sarah Doyle | 2,406 | |||
Labour | Ben Maloney | 2,025 | |||
Liberal Democrat | Alan Stainer | 1,638 | |||
Green | Fred Clark | 1,177 | |||
Turnout | 17,867 | 65.8 | +25.1 | ||
Conservative hold | Swing | ||||
Party | Candidate | Votes | % | ± | |
---|---|---|---|---|---|
Conservative | Michael Rye | 3,903 | |||
Conservative | Eric Jukes | 3,834 | |||
Conservative | Joanne Laban | 3,702 | |||
Labour | Ian Hamilton | 2,098 | |||
Labour | Laurane Morris | 2,069 | |||
Save Chase Farm | Kieran McGregor | 1,691 | |||
Liberal Democrat | Terry McGee | 1,685 | |||
Labour | Jeffrey Till | 1,658 | |||
Green | Tony Clapp | 1,157 | |||
Turnout | 21,797 | 73.1 | +27.2 | ||
Conservative hold | Swing | ||||
Conservative gain from Save Chase Farm | Swing | ||||
Party | Candidate | Votes | % | ± | |
---|---|---|---|---|---|
Labour | Yusuf Cicek | 2,303 | |||
Labour | Donald McGown | 2,299 | |||
Labour | Tashin Ibrahim | 2,267 | |||
Conservative | Matthew Laban | 2,210 | |||
Conservative | Jim Steven | 2,151 | |||
Conservative | Bektas Yavuz | 1,755 | |||
Liberal Democrat | Matthew Mattioli | 751 | |||
BNP | Tony Avery | 573 | |||
UKIP | David Jeal | 486 | |||
Green | Bill Linton | 466 | |||
Turnout | 15,261 | 61.5 | +25.6 | ||
Labour gain from Conservative | Swing | ||||
Party | Candidate | Votes | % | ± | |
---|---|---|---|---|---|
Labour | Andreas Constantinides | 3,345 | |||
Labour | Kate Anolue | 3,310 | |||
Labour | Christiana During | 3,233 | |||
Conservative | Jacqueline Campbell | 1,574 | |||
Conservative | Ibrahim Hassan | 1,516 | |||
Conservative | Melake Fessehazion | 1,286 | |||
Liberal Democrat | Androulla Morphakis | 826 | |||
Green | Maddy Loftin | 446 | |||
Turnout | 1,536 | 60.0 | +28.3 | ||
Labour hold | Swing | ||||
Party | Candidate | Votes | % | ± | |
---|---|---|---|---|---|
Conservative | Elaine Hayward | 3,162 | |||
Conservative | Martin Prescott | 3,103 | |||
Conservative | Ertan Hurer | 3,028 | |||
Labour | Tony Cleary | 2,124 | |||
Labour | Claire Stewart | 2,012 | |||
Labour | Surinder Attariwala | 1,857 | |||
Liberal Democrat | Brian Cronk | 1,749 | |||
Green | Jean Robertson-Molloy | 1,149 | |||
Turnout | 18,184 | 70.1 | +30.8 | ||
Conservative hold | Swing | ||||
Enfield Southgate is a constituency created in 1950 represented in the House of Commons of the UK Parliament since 2017 by Bambos Charalambous, a member of the Labour Party.
The 2008 Sunderland Council election took place on 1 May 2008 to elect members of Sunderland Metropolitan Borough Council in Tyne and Wear, England. One third of the council was up for election and the Labour party stayed in overall control of the council.
The 2010 Sunderland Council election took place on 6 May 2010 to elect members of Sunderland Metropolitan Borough Council in Tyne and Wear, England. One third of the council was up for election and the Labour party stayed in overall control of the council. The election took place on the same day as the 2010 General Election.
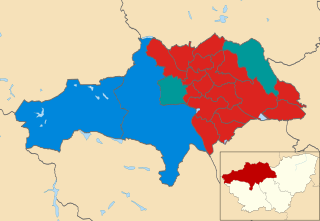
The 2011 Barnsley Metropolitan Borough Council election took place on 5 May 2011 to elect members of Barnsley Metropolitan Borough Council in South Yorkshire, England. One third of the council was up for election and the Labour party stayed in overall control of the council.
The 2011 Sandwell Metropolitan Borough Council election took place on 5 May 2011 to elect members of Sandwell Metropolitan Borough Council in the West Midlands, England. One third of the council was up for election and the Labour party stayed in overall control of the council.
The 2011 Swindon Borough Council election took place on 5 May 2011 to elect members of Swindon Unitary Council in Wiltshire, England. One third of the council was up for election and the Conservative party stayed in overall control of the council.
The 2006 Enfield Council election took place on 4 May 2006 to elect members of Enfield London Borough Council in London, England. The whole council was up for election and the Conservative party stayed in overall control of the council.
The 2007 Hertsmere Borough Council election took place on 3 May 2007 to elect members of Hertsmere Borough Council in Hertfordshire, England. One third of the council was up for election and the Conservative party stayed in overall control of the council.
The 2007 Carlisle City Council election took place on 3 May 2007 to elect members of Carlisle District Council in Cumbria, England. One third of the council was up for election and the council stayed under no overall control.
The 2014 Enfield Council election took place on 22 May 2014 to elect members of Enfield London Borough Council in London, England. The whole council was up for election and the Labour party retained overall control of the council, increasing their majority over the Conservative party by five seats.
The 2014 Haringey Council election took place on 22 May 2014 to elect members of Haringey Council in England. This was on the same day as other local elections.
The 2010 Harlow District Council election took place on 6 May 2010 to elect members of Harlow District Council in Essex, England. One third of the council was up for election and the Conservative party stayed in overall control of the council.
The 1964 Enfield Council election took place on 7 May 1964 to elect members of Enfield London Borough Council in London, England. The whole council was up for election and the Labour party gained control of the council.
Elections for the London Borough of Merton were held on 4 May 1978 to elect members of Merton London Borough Council in London, England. This was on the same day as other local elections in England and Scotland.
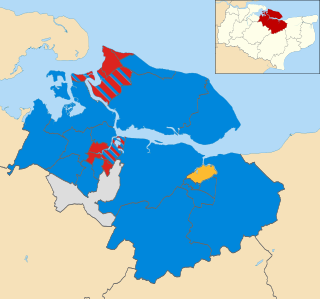
The 2011 Swale Borough Council election took place on 5 May 2011 to elect members of Swale Borough Council in Kent, England. The whole council was up for election and the Conservative party stayed in overall control of the council.
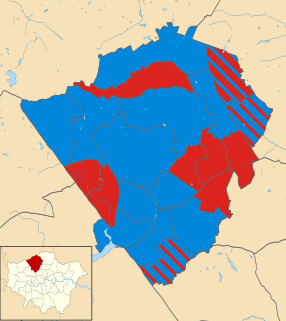
The 2018 Barnet Council election took place on 3 May 2018 to elect members of Barnet Borough Council in England. It took place on the same day as other local elections in 2018. In the last election, the Conservatives won control of the council with 32 seats, compared to 30 for Labour and 1 for the Liberal Democrats. On 15 March 2018, following the resignation of a Conservative councillor, the council was in a state of no overall control. The election on 3 May 2018 saw the Conservatives take back overall control with a majority of 13.
The 2018 Leeds City Council election took place on 3 May 2018 to elect members of Leeds City Council in England. They were held on the same day as other local elections across England and the rest of the UK.
The 2018 Hammersmith and Fulham Council election took place on 3 May 2018 to elect members of Hammersmith and Fulham Council in London.
The 2018 City of Bradford Metropolitan District Council took place on 3 May 2018 to elect members of Bradford District Council in England. This was on the same day as other local elections. One councillor was elected in each ward for a four-year term so the councillors elected in 2018 last stood for election in 2014. Each ward is represented by three councillors, the election of which is staggered, so only one third of the councillors were elected in this election. Before the election there was a Labour majority and afterwards Labour had increased their majority.