The 2010 Daventry District Council election took place on 6 May 2010 to elect members of Daventry District Council in England. [1] This was on the same day as other local elections.
England is a country that is part of the United Kingdom. It shares land borders with Wales to the west and Scotland to the north-northwest. The Irish Sea lies west of England and the Celtic Sea lies to the southwest. England is separated from continental Europe by the North Sea to the east and the English Channel to the south. The country covers five-eighths of the island of Great Britain, which lies in the North Atlantic, and includes over 100 smaller islands, such as the Isles of Scilly and the Isle of Wight.
Party | Seats | Gains | Losses | Net gain/loss | Seats % | Votes % | Votes | +/− | |
---|---|---|---|---|---|---|---|---|---|
Conservative | 12 | 0 | 0 | 0 | 92.3 | 52.1% | 16,612 | -9.2% | |
Liberal Democrat | 1 | 0 | 0 | 0 | 7.7% | 13.6% | 4,333 | -3.5% | |
Labour | 0 | 0 | 0 | 0 | 0 | 31.3% | 9,979 | 11.2% | |
English Democrat | 0 | 0 | 0 | 0 | 0 | 1.9% | 610 | 1.9% | |
Independent | 0 | 0 | 0 | 0 | 0 | 1.1% | 352 | 1.1% | |
Party | Candidate | Votes | % | ± | |
---|---|---|---|---|---|
Conservative | Christopher Long | 1,708 | 46.3 | ||
Conservative | Ian Donachie | 1,359 | |||
Labour | David James | 1,073 | 27.2 | ||
Labour | Elizabeth Ritchie | 728 | |||
Liberal Democrat | Elliott Prince | 1,146 | 17.3 | ||
English Democrat | Gaynor Bennett-Spencer | 610 | 9.2 | ||
Majority | |||||
Turnout | 3,941 | 58.24 | |||
Conservative hold | Swing | ||||
Party | Candidate | Votes | % | ± | |
---|---|---|---|---|---|
Liberal Democrat | Brian Lomax | 1142 | 54.9 | 3.1 | |
Conservative | John Richards | 932 | 45.1 | -3.1 | |
Majority | 210 | 9.8 | 6.2 | ||
Turnout | 2082 | 77.86 | |||
Liberal Democrat hold | Swing | ||||
Party | Candidate | Votes | % | ± | |
---|---|---|---|---|---|
Conservative | Nicholas Bunting | 2,432 | 72.3 | -27.7 | |
Labour | Peter Luke | 865 | 27.7 | 27.7 | |
Majority | 1,567 | 46.6 | -53.4 | ||
Turnout | 3,364 | 72.28 | |||
Conservative hold | Swing | ||||
Party | Candidate | Votes | % | ± | |
---|---|---|---|---|---|
Conservative | Robert Patchett | 740 | 63.6 | -36.4 | |
Liberal Democrat | Chris Salaman | 411 | 36.4 | 36.4 | |
Majority | 329 | 28.3 | |||
Turnout | 1,164 | 75.39 | |||
Conservative hold | Swing | ||||
Party | Candidate | Votes | % | ± | |
---|---|---|---|---|---|
Conservative | Leslie Poole | 1,426 | 50.9 | -6.0 | |
Labour | Wendy Randall | 1,316 | 49.1 | 6.0 | |
Majority | 110 | 1.8 | -12 | ||
Turnout | 2,801 | 59.62 | |||
Conservative hold | Swing | ||||
Party | Candidate | Votes | % | ± | |
---|---|---|---|---|---|
Conservative | Alan Hills | 1,275 | 51.3 | -17.1 | |
Labour | Nigel Carr | 661 | 26.6 | -5.0 | |
Liberal Democrat | Thomas Wash | 542 | 21.8 | 21.8 | |
Majority | 614 | 24.7 | -12.1 | ||
Turnout | 2,483 | 60.8 | |||
Conservative hold | Swing | ||||
Party | Candidate | Votes | % | ± | |
---|---|---|---|---|---|
Conservative | Stephen Osborne | 1,302 | 51.0 | -16.3 | |
Labour | Christopher Myers | 551 | 21.6 | 4.3 | |
Liberal Democrat | Neil Farmer | 680 | 26.7 | 11.3 | |
Majority | 622 | 24.4 | -25.6 | ||
Turnout | 2,549 | 74.9 | |||
Conservative hold | Swing | ||||
Party | Candidate | Votes | % | ± | |
---|---|---|---|---|---|
Conservative | Daniel Cribbin | 1,828 | 74.4 | ||
Labour | Maureen Luke | 584 | 25.6 | 25.6 | |
Majority | 1244 | 50.6 | -49.4 | ||
Turnout | 2,457 | 72.01 | |||
Conservative hold | Swing | ||||
Party | Candidate | Votes | % | ± | |
---|---|---|---|---|---|
Conservative | Barry Frenchman | 684 | 60.8 | -39.2 | |
Labour | Frances Peacock | 266 | 23.6 | 23.6 | |
Liberal Democrat | Malcolm Adcock | 154 | 13.7 | 13.7 | |
Majority | 418 | 37.2 | -62.8 | ||
Turnout | 1,125 | 77.16 | |||
Conservative hold | Swing | ||||
Party | Candidate | Votes | % | ± | |
---|---|---|---|---|---|
Conservative | John Millar | 944 | 67.3 | -17.3 | |
Labour | Sue Myers | 197 | 14.0 | -1.4 | |
Liberal Democrat | Liz Pym | 258 | 18.4 | 18.4 | |
Majority | 686 | 48.9 | -20.3 | ||
Turnout | 1,403 | 77.05 | |||
Conservative hold | Swing | ||||
Party | Candidate | Votes | % | ± | |
---|---|---|---|---|---|
Conservative | Elizabeth Griffin | 1,067 | 54.0 | -46.0 | |
Labour | Alfonso Macari | 532 | 26.9 | 26.9 | |
Independent | Christine Fitchett | 352 | 17.8 | 17.8 | |
Majority | 535 | 27.1 | -72.9 | ||
Turnout | 1,975 | 68.74 | |||
Conservative hold | Swing | ||||
Party | Candidate | Votes | % | ± | |
---|---|---|---|---|---|
Conservative | Alan Chantler | 915 | 80.6 | 11.7 | |
Labour | Janet John | 206 | 19.4 | 19.4 | |
Majority | 709 | 61.2 | 10.4 | ||
Turnout | 1,135 | 79.54 | |||
Conservative hold | Swing | ||||
The Daventry District is a local government district in western Northamptonshire, England. The district is named after its main town of Daventry where the council is based.
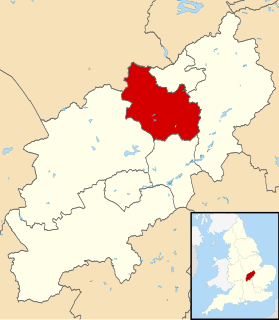
Kettering is a local government district and borough in Northamptonshire, England. It is named after its main town Kettering where the council is based. It borders onto the district of Harborough in the neighbouring county of Leicestershire, the borough of Corby, the district of East Northamptonshire, the district of Daventry and the borough of Wellingborough.
Daventry is a constituency represented in the House of Commons of the UK Parliament since 2010 by Chris Heaton-Harris of the Conservative Party.
One third of Daventry District Council in Northamptonshire, England is elected each year, followed by one year when there is an election to Northamptonshire County Council instead. Since the last boundary changes in 1999, 38 councillors have been elected from 24 wards.In another boundary review in 2012 the councillors were reduced to 36 councillors across 16 wards.
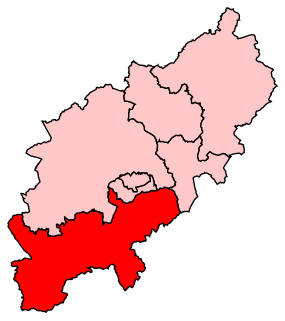
South Northamptonshire is a constituency represented in the House of Commons of the UK Parliament since its 2010 recreation by Andrea Leadsom, a Conservative who has been Leader of the House of Commons since 11 June 2017.
Elections to Daventry District Council were held on 7 May 1998. One third of the council was up for election and the council stayed under no overall control.
Elections to Daventry District Council were held on 6 May 1999. The whole council was up for election with boundary changes since the last election in 1998 increasing the number of seats by 3. The Conservative party gained overall control of the council from no overall control.
Elections to Daventry District Council were held on 4 May 2000. One third of the council was up for election and the Conservative party stayed in overall control of the council.
Elections to Daventry District Council were held on 2 May 2002. One third of the council was up for election and the Conservative party stayed in overall control of the council. Overall turnout was 35%.
Elections to Daventry District Council were held on 1 May 2003. One third of the council was up for election and the Conservative party stayed in overall control of the council. Overall turnout was 34%.
Elections to Daventry District Council were held on 10 June 2004. One third of the council was up for election and the Conservative party stayed in overall control of the council.
Elections to Daventry District Council were held on 4 May 2006. One third of the council was up for election and the Conservative party stayed in overall control of the council.
Elections to Daventry District Council were held on 3 May 2007. One third of the council was up for election and the Conservative party stayed in overall control of the council.
Elections to Daventry District Council in Northamptonshire, England were held on 1 May 2008. One third of the council was up for election and the Conservative party stayed in overall control of the council.
Elections to Daventry District Council took place on Thursday 5 May 2011. One third of the council was up for election. The previous elections produced a majority for the Conservative Party.
The 2012 Daventry Council election took place on 3 May 2012 to elect members of Daventry Council in England. This was on the same day as other United Kingdom local elections, 2012.
The 2014 Daventry District Council election took place on 22 May 2014 to elect members of Daventry District Council in England. This was on the same day as other local elections.
The 2015 Daventry District Council election took place on 7 May 2015 to elect members of Daventry District Council in England. This was on the same day as other local elections. Two seats changed hands with the Conservatives taking both from Labour leading to the council being made up as follows; 31 Conservative councillors, 2 Labour councillors, 2 UKIP councillors and 1 Liberal Democrat councillor.
The 2016 Daventry District Council election took place on 5 May 2016 to elect members of Daventry District Council in England. This was on the same day as other local elections.
The 2018 Daventry District Council election were held on Thursday 3rd May 2018 to elect members of Daventry District Council in England.This was on the same day as other local elections.