Elections to Daventry District Council in Northamptonshire, England were held on 1 May 2008. One third of the council was up for election and the Conservative party stayed in overall control of the council.
Northamptonshire, archaically known as the County of Northampton, is a county in the East Midlands of England. In 2015 it had a population of 723,000. The county is administered by Northamptonshire County Council and by seven non-metropolitan district councils. It is known as "The Rose of the Shires".
England is a country that is part of the United Kingdom. It shares land borders with Wales to the west and Scotland to the north-northwest. The Irish Sea lies west of England and the Celtic Sea lies to the southwest. England is separated from continental Europe by the North Sea to the east and the English Channel to the south. The country covers five-eighths of the island of Great Britain, which lies in the North Atlantic, and includes over 100 smaller islands, such as the Isles of Scilly and the Isle of Wight.
The Conservative Party, officially the Conservative and Unionist Party, is a centre-right political party in the United Kingdom. Presently led by Theresa May, it has been the governing party since 2010. It presently has 314 Members of Parliament in the House of Commons, 249 members of the House of Lords, and 18 members of the European Parliament. It also has 31 Members of the Scottish Parliament, 12 members of the Welsh Assembly, eight members of the London Assembly and 9,008 local councillors. One of the major parties of UK politics, it has formed the government on 45 occasions, more than any other party.
No seats changed hands at the election with the Conservative party winning 10 of the 12 seats up for election. [1] The British National Party were pleased with the second place they achieved in Drayton ward feeling they could build on the performance but the other parties were happy that they had been defeated. [2]
After the election, the composition of the council was
Party | Seats | Gains | Losses | Net gain/loss | Seats % | Votes % | Votes | +/− | |
---|---|---|---|---|---|---|---|---|---|
Conservative | 10 | 0 | 0 | 0 | 83.3 | 60.4 | 6,488 | -8.5% | |
Labour | 1 | 0 | 0 | 0 | 8.3 | 18.8 | 2,016 | +0.0% | |
Liberal Democrat | 1 | 0 | 0 | 0 | 8.3 | 16.6 | 1,780 | +14.0% | |
BNP | 0 | 0 | 0 | 0 | 0 | 4.2 | 451 | +4.2% | |
Two Conservative candidates were unopposed. [3]
Party | Candidate | Votes | % | ± | |
---|---|---|---|---|---|
Conservative | Gloria Edwards-Davidson | 1,045 | 62.9 | +13.2 | |
Labour | Chris Myers | 356 | 21.4 | -4.0 | |
Liberal Democrat | Neil Farmer | 261 | 15.7 | -9.3 | |
Majority | 689 | 41.5 | +17.2 | ||
Turnout | 1,662 | 25.9 | |||
Conservative hold | Swing | ||||
Party | Candidate | Votes | % | ± | |
---|---|---|---|---|---|
Conservative | Deanna Eddon | 686 | 68.1 | +15.7 | |
Labour | Maureen Luke | 197 | 19.6 | -0.9 | |
Liberal Democrat | John Lathan | 124 | 12.3 | +12.3 | |
Majority | 489 | 48.5 | +23.2 | ||
Turnout | 1,007 | 35.4 | |||
Conservative hold | Swing | ||||
Party | Candidate | Votes | % | ± | |
---|---|---|---|---|---|
Liberal Democrat | Catherine Lomax | 793 | 54.4 | +2.6 | |
Conservative | John Richards | 666 | 45.6 | -2.6 | |
Majority | 127 | 8.8 | +5.2 | ||
Turnout | 1,459 | 53.9 | |||
Liberal Democrat hold | Swing | ||||
Party | Candidate | Votes | % | ± | |
---|---|---|---|---|---|
Conservative | John Shephard | Unopposed | |||
Conservative hold | Swing | ||||
Party | Candidate | Votes | % | ± | |
---|---|---|---|---|---|
Labour | Janet McCarthy | 447 | 60.3 | -11.7 | |
Conservative | Ian Nott | 294 | 39.7 | +11.7 | |
Majority | 153 | 20.6 | -23.4 | ||
Turnout | 741 | 51.8 | |||
Labour hold | Swing | ||||
Party | Candidate | Votes | % | ± | |
---|---|---|---|---|---|
Conservative | Frank Wiig | Unopposed | |||
Conservative hold | Swing | ||||
Party | Candidate | Votes | % | ± | |
---|---|---|---|---|---|
Conservative | Annette Dunn | 654 | 45.4 | -10.9 | |
BNP | David Jones | 451 | 31.3 | +31.3 | |
Labour | Peter Luke | 337 | 23.4 | -20.3 | |
Majority | 203 | 14.1 | +1.5 | ||
Turnout | 1,442 | 30.8 | |||
Conservative hold | Swing | ||||
Party | Candidate | Votes | % | ± | |
---|---|---|---|---|---|
Conservative | Wendy Amos | 553 | 78.4 | +1.5 | |
Labour | Beatrice Price | 98 | 13.9 | -9.2 | |
Liberal Democrat | Liz Pym | 54 | 7.7 | +7.7 | |
Majority | 455 | 64.5 | +10.7 | ||
Turnout | 705 | 46.0 | |||
Conservative hold | Swing | ||||
Party | Candidate | Votes | % | ± | |
---|---|---|---|---|---|
Conservative | Thelma Hills | 751 | 70.8 | +23.8 | |
Labour | Nigel Carr | 310 | 29.2 | +7.2 | |
Majority | 441 | 41.6 | +25.6 | ||
Turnout | 1,061 | 25.9 | |||
Conservative hold | Swing | ||||
Party | Candidate | Votes | % | ± | |
---|---|---|---|---|---|
Conservative | Ian Pasley-Tyler | 535 | 74.2 | -5.0 | |
Liberal Democrat | Bob Pratchett | 123 | 17.1 | +17.1 | |
Labour | Sue Myers | 63 | 8.7 | -12.1 | |
Majority | 412 | 57.1 | -1.3 | ||
Turnout | 721 | 49.8 | |||
Conservative hold | Swing | ||||
Party | Candidate | Votes | % | ± | |
---|---|---|---|---|---|
Conservative | David White | 679 | 70.1 | -4.8 | |
Liberal Democrat | Chris Salaman | 289 | 29.9 | +17.2 | |
Majority | 390 | 40.2 | -22.0 | ||
Turnout | 968 | 37.4 | |||
Conservative hold | Swing | ||||
Party | Candidate | Votes | % | ± | |
---|---|---|---|---|---|
Conservative | David Griffin | 625 | 64.5 | ||
Labour | Hilary Bradley | 208 | 21.5 | ||
Liberal Democrat | Malcolm Adcock | 136 | 14.0 | ||
Majority | 417 | 43.0 | |||
Turnout | 969 | 34.0 | |||
Conservative hold | Swing | ||||
One third of Daventry District Council in Northamptonshire, England is elected each year, followed by one year when there is an election to Northamptonshire County Council instead. Since the last boundary changes in 1999, 38 councillors have been elected from 24 wards.In another boundary review in 2012 the councillors were reduced to 36 councillors across 16 wards.
Elections to Daventry District Council were held on 6 May 1999. The whole council was up for election with boundary changes since the last election in 1998 increasing the number of seats by 3. The Conservative party gained overall control of the council from no overall control.
Elections to Barrow-in-Furness Borough Council was held on 1 May 2008. The whole of the council was up for election, with the number of councillors falling from 38 to 36, as a result of ward boundary changes enacted in February 2008. Councillors were elected for terms ranging between two and four years; where more than one councillor was elected in a ward, the councillor with the highest number of votes was granted the longer term.
Elections to Purbeck District Council were held on 1 May 2008. Nine of the twenty-four seats on the council were up for election and the council stayed under no overall control. Overall turnout was 44.86%.
The 2008 Thurrock Council election took place on 1 May 2008 to elect members of Thurrock Council in Essex, England. One third of the council was up for election and the council stayed under no overall control.
Elections to Adur District Council in West Sussex, England were held on 1 May 2008. Half of the council was up for election and the Conservative party held overall control of the council.
Elections to Rossendale Borough Council were held on 1 May 2008. One third of the council was up for election and the Conservative party gained overall control of the council from no overall control. Overall turnout was up by one per cent from the last election in 2007 at 36.3%.
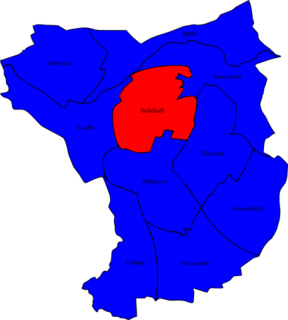
The 2008 Tamworth Borough Council election took place on 1 May 2008 to elect members of Tamworth District Council in Staffordshire, England. One third of the council was up for election and the Conservative party stayed in overall control of the council.
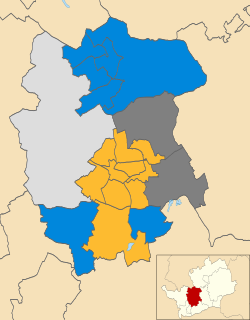
Elections to Gosport Council in Hampshire, England were held on 1 May 2008. Half of the council was up for election and the council stayed under no overall control.
Elections to Watford Council were held on 1 May 2008. One third of the council was up for election and the Liberal Democrat party stayed in overall control of the council.
Elections to Mole Valley Council were held on 1 May 2008. One third of the council was up for election and the Conservative party stayed in overall control of the council. Overall turnout was 46.5% a drop from the 47.2% seen in the 2007 election.
Elections to Runnymede Council were held on 1 May 2008. One third of the council was up for election and the Conservative party stayed in overall control of the council.
The 2008 St Albans City and District Council election took place on 1 May 2008 to elect members of St Albans District Council in Hertfordshire, England. One third of the council was up for election and the Liberal Democrats gained overall control of the council from no overall control.
The 2007 Wyre Forest District Council election took place on 3 May 2007 to elect members of Wyre Forest District Council in Worcestershire, England. One third of the council was up for election and the council stayed under no overall control.
The 2008 Welwyn Hatfield Borough Council election took place on 1 May 2008 to elect members of Welwyn Hatfield Borough Council in Hertfordshire, England. The whole council was up for election with boundary changes since the last election in 2007. The Conservative party stayed in overall control of the council.
The 2003 Hart Council election took place on 1 May 2003 to elect members of Hart District Council in Hampshire, England. One third of the council was up for election and the Conservative party stayed in overall control of the council.
The 2008 Cheltenham Council election took place on 1 May 2008 to elect members of Cheltenham Borough Council in Gloucestershire, England. Half of the council was up for election and the council stayed under no overall control.
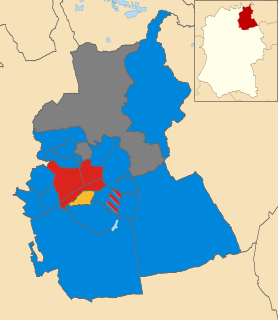
The 2008 Swindon Borough Council election took place on 4 May 2008 to elect members of Swindon Unitary Council in Wiltshire, England. One third of the council was up for election and the Conservative party stayed in overall control of the council.
The 2008 Fareham Council election took place on 1 May 2008 to elect members of Fareham Borough Council in Hampshire, England. Half of the council was up for election and the Conservative party stayed in overall control of the council.
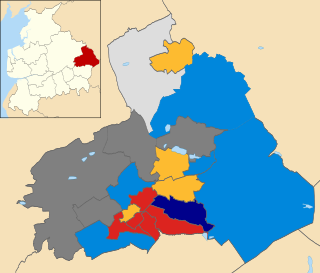
The 2008 Pendle Borough Council election took place on 1 May 2008 to elect members of Pendle Borough Council in Lancashire, England. One third of the council was up for election and the Liberal Democrats lost overall control of the council to no overall control.