City and County of Swansea Council election, 2008

Last updated

The fourth election to the City and County of Swansea Council was held in May 2008. [1] It was preceded by the 2004 election and followed by the 2012 election.

City and County of Swansea Council

The City and County of Swansea Council is the governing body for one of the Principal Areas of Wales covering Swansea, Gower and the surrounding area. The council consists of 72 councillors representing 36 electoral wards.

Contents

Overview

All council seats were up for election. These were the fourth elections held following local government reorganisation and the abolition of West Glamorgan County Council. The Council remained under no overall control, the Labour Party having lost their majority on the authority in 2004

Candidates

The contests were fought by most of the main parties but Labour was the only one to contest the majority of seats.

Overall Result

City and County of Swansea Council election result 2008
PartySeatsGainsLossesNet gain/lossSeats %Votes %Votes+/−
  Labour
  Conservative
  Liberal Democrat
  Plaid Cymru
  Independent
  Green 0

Results

Bishopston (one seat)

Bishopston 2008
PartyCandidateVotes%±
Independent Keith Edmund Marsh* 730
Conservative Carole Maureen Hyde 516
Green Rashid Malik 110
Turnout 49.7
Independent hold Swing

Bonymaen (two seats)

Bonymaen 2008
PartyCandidateVotes%±
Labour Mair Eluned Gibbs* 1,052
Independent John Brian Hague* 893
BNP Sion Lynford Owens 447
Turnout 34.2
Labour hold Swing
Independent hold Swing

Castle (four seats)

Castle 2008
PartyCandidateVotes%±
Labour Robert Alan Lloyd* 1,105
Labour David Phillips* 1,029
Labour Erika Theresa Kirchner* 1,009
Labour Barbara Joyce Hynes* 999
Liberal Democrat Gareth Peter Jones 735
Liberal Democrat Stephanie David 726
Liberal Democrat Tanya Auxiliadora May 724
Liberal Democrat David Gerald Joseph 702
Plaid Cymru Rhys Aeron Jones 520
Plaid Cymru Hugh Nigel Parsons 484
Plaid Cymru Patrick John Powell 478
Conservative Harri Lloyd Davies 432
Plaid Cymru Harri Lloyd Roberts 411
Conservative Paul Raymond Morris 388
Conservative Sonya Winifred Rachel Morris 353
Conservative Alexander Stonor 350
Socialist Alternative Alec Thraves 172
Independent Colin John Davies 151
Independent David Mark Davies 115
Communist Michael Gilbert Carty 112
The Left Party Moodie Rachid Khaldi 95
Turnout 28.3
Labour hold Swing
Labour hold Swing
Labour hold Swing
Labour hold Swing

Clydach (two seats)

Clydach 2008
PartyCandidateVotes%±
Labour Roger Llewellyn Smith* 1,115
Labour Paulette Bradley Smith 820
Liberal Democrat Sylvia Mary Lewis* 710
Independent Julie Marlene Davies 509
Liberal Democrat Janice Maureen Jarman 322
Conservative Janice Birch 248
Conservative Barry John Stubbings 226
Turnout 38.1
Labour hold Swing
Labour gain from Liberal Democrat Swing

Cockett (four seats)

Plaid councilor Keith Morgan had defected to the Liberal Democrats since the previous election.

Cockett 2008
PartyCandidateVotes%±
Liberal Democrat William Keith Morgan* 1,102
Liberal Democrat Nicola Anne Holley 1,047
Liberal Democrat James Bernard Kelleher 996
Liberal Democrat Veronyca Anne Bates Hughes 993
Labour Anna Mary Pennock 985
Labour Andrew John Jones 946
Labour Susan Grace Lewis 932
Plaid Cymru John Rhodri Thomas* 879
Labour John Abraham 878
Plaid Cymru Adrian Hugh Rees* 870
Plaid Cymru Enid Vanessa Webb* 866
Plaid Cymru Jonathan Clive Howes 835
Conservative Lisa Emma Gilmore 363
Conservative David William Turner 360
Conservative Craig James Robert Lawton 348
Conservative William Mathew Ogborne 345
Turnout 33.5
Liberal Democrat hold Swing
Liberal Democrat gain from Plaid Cymru Swing

Cwmbwrla (three seats)

Cwmbwrla 2008
PartyCandidateVotes%±
Liberal Democrat Peter Malcolm Black* 1,804
Liberal Democrat Christopher Ashleigh Holley* 1,662
Liberal Democrat Lewis Graham Thomas* 1,335
Labour Cyril Anderson 526
Labour Peter David Meehan 453
Labour Malcolm David Smith 403
Conservative Peter James Demery 139
Conservative Martin William Jones 111
Conservative Margaret Chegwin Jones 103
Turnout 38.8
Liberal Democrat hold Swing

Dunvant (two seats)

Dunvant 2008
PartyCandidateVotes%±
Liberal Democrat John Newbury* 992
Liberal Democrat Nicholas John Tregoning* 855
Independent Roy Thomas Adams 262
Labour Christine Mary Hosgood-Jones 254
Labour Peter Leonard Rowlands 198
Conservative James Barrington Geen Harding 192
Independent Rowland Bevan 165
Conservative David Rudolf Heinrich 143
Turnout 45.8
Liberal Democrat hold Swing

Fairwood (one seat)

Fairwood 2008
PartyCandidateVotes%±
Conservative Paxton Richard Hood‐Williams* 607
Liberal Democrat David Henry Owen Elliott 304
Independent John Gunther Bushell 158
Independent Elisabeth Ann Davies 66
Green Ana Rosa Boyain-Y-Goitia Griffiths 48
Turnout 52.3
Conservative hold Swing

Gorseinon (one seat)

Gorseinon 2008
PartyCandidateVotes%±
Labour Glyn Seabourne* 315
Independent Gillian Nansi Evans 229
Plaid Cymru Darren Jeffery Thomas 210
Independent Diane Christine Freeman 148
Conservative William John Verney Ley 119
Turnout 35.3
Labour hold Swing

Gower (one seat)

Gower 2008
PartyCandidateVotes%±
Independent Richard David Lewis* 771
Conservative Marjorie Jennifer Stubbings 587
Labour Michael John Shaw 144
Green David Charles Howells 136
Turnout 53.4
Independent hold Swing

Gowerton (one seat)

Gowerton 2008
PartyCandidateVotes%±
Independent Susan Mary Jones 535
Conservative Lyndon Richard Jones 491
Labour Ronald Morgan Thomas* 475
Liberal Democrat Michael John Sheehan 181
Turnout 41.9
Independent gain from Labour Swing

Killay North (one seat)

Killay North 2008
PartyCandidateVotes%±
Liberal Democrat Mary Helen Jones* 646
Conservative Gareth Raymond Milne 236
Labour Jason James Sannegadu 192
Turnout 34.3
Liberal Democrat hold Swing

Killay South (one seat)

Killay South 2008
PartyCandidateVotes%±
Liberal Democrat Jeffrey William Jones 463
Conservative Martyn Ford 247
Labour Michael Edward Harper 168
Green Peter Kenneth Jones 119
Turnout 50.5
Liberal Democrat hold Swing

Kingsbridge (one seat)

Kingsbridge 2008
PartyCandidateVotes%±
Labour William Gethin Evans* 541
Independent Catherine Emma Maiden 458
Plaid Cymru Pauline Ann Selvage 184
Conservative Phillip Edward Sillick 314
Turnout 46.0
Labour hold Swing

Landore (two seats)

Landore 2008
PartyCandidateVotes%±
Liberal Democrat Vivian Nigel Abbott* 836
Liberal Democrat Robert Speht* 793
Labour Thomas Michael White 585
Labour John Alun James 552
BNP Susan Josephine Harwood 189
Conservative Mark Anthony Burnett 95
Conservative Henri Lloyd Davies 71
Turnout 35.9
Liberal Democrat hold Swing

Llangyfelach (one seat)

Llangyfelach 2008
PartyCandidateVotes%±
Independent David Gareth Sullivan* 894
Conservative Louise Margaret Alabaster 306
Green John Edward Rasbridge 180
Turnout 36,2
Independent hold Swing

Llansamlet (four seats)

Llansamlet 2008
PartyCandidateVotes%±
Labour Penelope Margaret Matthews 1,119
Labour Dennis Henry James* 1,109
Labour Christopher Ryland Doyle 919
Independent June Evans* 912
Labour Royston Richards 877
Independent Carl William Lewis 753
Independent Margaret Lydia Harris 722
BNP Clive Bennett 635
Plaid Cymru Carolyne Shan Couch 616
Conservative Janine Michelle Ida Barnes 520
Conservative Jonathan Kieth Barnes 511
Conservative Christian John Holliday 475
Liberal Democrat Rosemarie Bridgeman 411
Liberal Democrat Mathew James Reacord 379
Conservative Geoffrey Raymond Lloyd 361
Labour hold Swing
Labour hold Swing
Labour hold Swing
Independent hold Swing
Turnout 31.2

Lower Loughor (one seat)

Lower Loughor 2008
PartyCandidateVotes%±
Labour Julie Christine Richards 284
Independent Clive Ernest Watters 141
Conservative Andrew Froude Fritche 120
Plaid Cymru James Michael Dunckley 110
Labour hold Swing
Turnout 36.7

Mawr (one seat)

Mawr 2004
PartyCandidateVotes%±
People's RepresentativeIoan Merritt Richard* 450
Plaid Cymru Linda Mary Frame 156
Labour Howard Owen Griffiths 65
Conservative Andrew Patrick Sivertsen 56
Others hold Swing
Turnout 48.6

Mayals(one seat)

Elected as a Lib Dem in 2004, Rene Kinzett joined the Conservatives.

Mayals 2008
PartyCandidateVotes%±
Conservative Rene Harwood Kinzett 545
Independent Peter Geoffrey Birch 465
Labour Juliet Anne Fortey 190
Conservative gain from Liberal Democrat Swing
Turnout 54.7

Morriston (five seats)

Morriston 2008
PartyCandidateVotes%±
Labour Michael John Hedges* 2,159
Labour Robert John Lloyd* 1,776
Labour Robert Charles Stewart 1,768
Labour William John Francis Davies* 1,741
Labour Robert Francis-Davies* 1,669
Liberal Democrat Helen Ceri Clarke 1,528
Liberal Democrat Jonathan Clarke 1,427
Liberal Democrat Owen Roberts 1,223
Liberal Democrat Rachael Elizabeth Hitchinson 1,214
Liberal Democrat Robert Morrison Samuel 1,142
Plaid Cymru Richard Jones Jones 778
BNP Alan Bateman 678
Plaid Cymru Hywel Rhys Couch 619
Conservative Michael James Byrne 584
Conservative Robert Ivor James 574
Conservative Paul Frank Briggs 557
Conservative Thomas Patrick Caradog Morgan 523
Conservative Sheila Morgan 500
Labour hold Swing
Labour hold Swing
Labour hold Swing
Labour hold Swing
Labour hold Swing
Turnout 34.7

Mynyddbach (three seats)

Mynyddbach 2008
PartyCandidateVotes%±
Labour Ceinwen Thomas* 1,077
Labour Byron George Owen 930
Independent Audrey Rose Ann Clement* 911
Independent Austin Raymond Welsby* 861
Labour Charles Glyndwr White 855
Independent John Evans 626
Independent Oswyn Clement 589
Conservative Karan Cheryl Sivertsen 362
Conservative Glyndwr Jones 281
Conservative Martha Jones 258
Labour hold Swing
Labour gain from Independent Swing
Independent hold Swing
Turnout 36.7

Newton (one seat)

Newton 2008
PartyCandidateVotes%±
Liberal Democrat Susan Mary Waller* 718
Conservative David Nicholas Thomas 497
Green Stephanie Cuff 115
Liberal Democrat hold Swing
Turnout 47.9

Oystermouth (one seat)

The former Conservative councillor stood as an Independent, but was defeated.

Oystermouth 2008
PartyCandidateVotes%±
Conservative Anthony Charles Saunders Colburn 556
Liberal Democrat Roger Barnabas Beynon 436
Green Rhodri Griffiths 263
Independent Joan Thyrza Gwenllian Peters* 241
Conservative hold Swing
Turnout 42.9

Penclawdd (one seat)

Penclawdd 2008
PartyCandidateVotes%±
Independent David Paul Tucker* 676
Labour John Hywel Guy 499
Conservative Gordon Howells 201
Plaid Cymru Robin Lowe 112
Independent hold Swing
Turnout 49.6

Penderry (three seats)

Penderry 2008
PartyCandidateVotes%±
Labour Grenville Phillips* 931
Labour June Elizabeth Burtonshaw* 921
Labour Hazel Mary Morris 850
Green James Anthony Young 470
Liberal Democrat Vivienne Anne Samuel 455
Green Linda Beynon 411
Liberal Democrat Matthew James O'Grady 387
Liberal Democrat Claire Margaret Smalley 328
Labour win (new seat)
Turnout 23.2

Penllergaer (one seat)

Penllergaer 2008
PartyCandidateVotes%±
Independent Elizabeth Wendy Fitzgerald* 873
Labour Nigel Mark Rees 56
Conservative Paul Werner Sivertsen 48
Green Carol Smith 27
Independent hold Swing
Turnout 45.6

Pennard (one seat)

Margaret Smith previously sat as an Independent.

Pennard 2008
PartyCandidateVotes%±
Conservative Margaret Smith* 432
Independent Christopher Bede James 288
Independent Alexander Richard Lewis 183
Independent Andrew Crawford Thomas 151
Plaid Cymru Dewi Richard Evans 135
Green Peter John Middleton 101
Conservative gain from Independent Swing
Turnout 57.2

Penyrheol (two seats)

Penyrheol 2008
PartyCandidateVotes%±
Labour David Islwyn Elfed Jones* 574
Independent Alan Jopling 553
Labour Alison Marsha Seabourne* 531
Independent Peter William Woollard 502
Plaid Cymru Sandra Eileen Monk 349
Conservative Martin Werner Sivertsen 233
Conservative Robert Bradshaw Wilkinson 215
Labour hold Swing
Independent gain from Labour Swing
Turnout

Pontarddulais (two seats)

Pontarddulais 2008
PartyCandidateVotes%±
Labour John Treharne Miles* 656
Independent David Thomas Howells 641
Labour Philip Downing* 593
Independent Byron Calvin Lewis 514
Plaid Cymru Eifion Davies 479
Plaid Cymru Eiry Miles 405
Independent John Mathias 289
Conservative Glen Brian Routledge 164
Conservative Robert John Charles Fisher 123
Labour hold Swing
Independent gain from Labour Swing
Turnout 47.2

Sketty (five seats)

Huw Rees was elected as a Conservative in 2004 but subsequently joined the Liberal Democrats.

Sketty 2008
PartyCandidateVotes%±
Liberal Democrat Rosina June Stanton* 2,604
Liberal Democrat Arthur Michael Day* 2,201
Liberal Democrat Thomas Huw Rees* 2,084
Liberal Democrat Cheryl Lynne Philpott 2,076
Liberal Democrat Paul Michael Meara 1,601
Conservative Anthony Trevor Lloyd* 1,593
Conservative Lavinia Gay Mitchell 1,443
Conservative David William Helliwell 1,347
Conservative Alice Christina Sumner 1,340
Conservative Robert Thornton Dowdle 1,126
Labour Ian Anthony James 888
Labour Jennifer Louise White 723
Labour James Harwood White 705
Plaid Cymru Sian Thomas 693
Labour Ashaa Rasul Iftikhar 686
Labour Yvonne Veronica Jardine 666
Green Patricia Emma Helena Jones 599
Turnout 43.5
Liberal Democrat hold Swing
Liberal Democrat gain from Conservative Swing

St Thomas (two seats)

St Thomas 2008
PartyCandidateVotes%±
Independent Mervyn Rhys Jones 1,049
Independent David Alan Robinson* 1,009
Labour Alan Rees Richards* 780
Labour Patricia Mary Richards 548
Conservative Jonathan Owain Burchell 84
Conservative Darren Robert Hann 82
Independent gain from Labour Swing
Independent hold Swing
Turnout 38.4

Townhill (three seats)

Townhill 2008
PartyCandidateVotes%±
Labour David Henry Hopkins* 772
Labour Nicholas Stuart Bradley 749
Labour William Edwin Alan Jones* 682
Liberal Democrat Jacqueline Church 382
Liberal Democrat James Sheridan 375
Independent Terence Porter 330
Liberal Democrat Thomas Caldas 284
Plaid Cymru Hazel Pauline McKnight 235
Independent Susan Rosemary Sturgess 183
Conservative Simon David Clason Bevan 119
Conservative Vincent Bishop 109
Conservative Dayne Ryan Powell 91
Labour hold Swing
Labour hold Swing
Labour hold Swing
Turnout 27.0

Uplands (four seats)

Uplands 2008
PartyCandidateVotes%±
Liberal Democrat Peter Nicholas May* 1,828
Liberal Democrat Stuart James Rice* 1,706
Liberal Democrat Jayne Woodman* 1,495
Liberal Democrat Janet Mary Thomas 1,488
Labour Sybil Edith Crouch 817
Labour Andrew Daniel Connell 792
Labour Ian William James Ross 765
Labour Derek James 729
Conservative Dick Phillips 593
Green Andrew Russell Lumley Smith 561
Conservative Simon Keith Bickley Bright 500
Conservative David John Rodway 472
Plaid Cymru Annest Wiliam 404
Conservative Norman Thomas Whitlock 403
Green Steven Mark Clegg 391
Green Holly Machin 346
Independent Jane Elizabeth McCarthy 275
Independent Jeffrey Stuart Sampson 236
Independent Nortridge Perrott 165
Independent Nigel Alan Robins 107
Liberal Democrat hold Swing
Turnout 29.8

Upper Loughor (one seat)

Upper Loughor 2008
PartyCandidateVotes%±
Plaid Cymru Darren Price* 531
Labour Harding John Richards 199
Independent Wynford Jones 105
Conservative Alan Thomas Protheroe 89
Plaid Cymru hold Swing
Turnout 42.7

West Cross (two seats)

West Cross 2008
PartyCandidateVotes%±
Labour Mark Clive Child* 1,050
Labour Desmond Wilfred William Thomas* 1,034
Conservative Elaine Hughes 894
Conservative Philip Joel Swinnerton 771
Liberal Democrat Simon Hugh Arthur 440
Liberal Democrat William Keith Jones 377
Green Marion Williams 187
Green Erica Georgina Powell 144
Labour hold Swing
Labour hold Swing
Turnout

Related Research Articles

Sketty (electoral ward) human settlement in United Kingdom

Sketty is the name of an electoral ward in the City and County of Swansea, Wales, UK. The electoral ward is coterminous with the community.

Elections to Slough Borough Council were held on 4 May 2006. One third of the council was up for election. This was the 121st Slough general local authority election since Slough became a local government unit in 1863.

Elections to the Borough Council in Slough, England, were held on 3 May 2007. One third of the council was up for election. This was the 122nd Slough general local authority election since Slough became a local government unit in 1863.

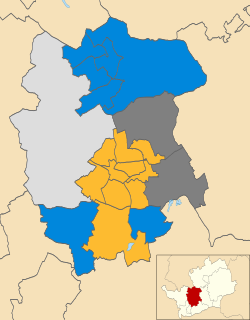
Elections to Monmouthshire County Council were held on 10 June 2004 on the same day of the European Elections.

The 1999 Craven District Council election took place on 6 May 1999 to elect members of Craven District Council in North Yorkshire, England. One third of the council was up for election and the Conservative party gained overall control of the council from no overall control.

Uplands (electoral ward) human settlement in United Kingdom

Uplands is name of an electoral ward in the City and County of Swansea, Wales, UK.

2008 St Albans City and District Council election

The 2008 St Albans City and District Council election took place on 1 May 2008 to elect members of St Albans District Council in Hertfordshire, England. One third of the council was up for election and the Liberal Democrats gained overall control of the council from no overall control.

2007 St Albans City and District Council election

The 2007 St Albans City and District Council election took place on 3 May 2007 to elect members of St Albans District Council in Hertfordshire, England. One third of the council was up for election and the Liberal Democrats lost overall control of the council to no overall control.

2010 Sunderland City Council election

The 2010 Sunderland Council election took place on 6 May 2010 to elect members of Sunderland Metropolitan Borough Council in Tyne and Wear, England. One third of the council was up for election and the Labour party stayed in overall control of the council. The election took place on the same day as the 2010 General Election.

2004 Pendle Borough Council election

The 2004 Pendle Borough Council election took place on 10 June 2004 to elect members of Pendle Borough Council in Lancashire, England. One third of the council was up for election and the Liberal Democrats gained overall control of the council from no overall control.

The 2011 council elections in Guildford saw the Conservatives retain control over Guildford Borough Council with an increased majority of 20 seats. Full results for each ward can be found at Guildford Council election, full results, 2011.

2011 Sunderland City Council election

The 2011 Sunderland Council election took place on 5 May 2011 to elect members of Sunderland Metropolitan Borough Council in Tyne and Wear, England. One third of the council was up for election and the Labour party stayed in overall control of the council.

2008 City of Cardiff Council election

The Cardiff Council election in 2008 was held on 1 May, along with other local elections in the UK. All 75 seats of Cardiff Council were contested, with it remaining in no overall control. It was preceded by the 2004 election and followed by the 2012 election

2011 Carlisle City Council election

The 2011 Carlisle City Council election took place on 5 May 2011 to elect members of Carlisle District Council in Cumbria, England. One third of the council was up for election and the council stayed under no overall control.

2012 North East Lincolnshire Council election

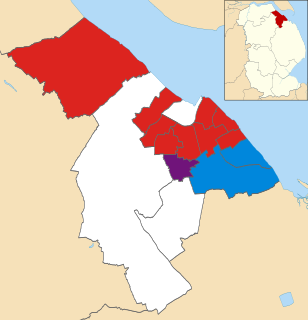
The 2012 North East Lincolnshire Council election took place on 3 May 2012 to elect members of North East Lincolnshire Council in England. This was on the same day as other United Kingdom local elections, 2012.

The second elections to the City and County of Swansea Council were held in May 1999. It was preceded by the 1995 election and followed by the 2004 election.

The second election to the City and County of Swansea Council were held in May 2004. It was preceded by the 1999 election and followed by the 2008 election.

2006 West Oxfordshire District Council election

The 2006 West Oxfordshire District Council election took place on 4 May 2006 to elect members of West Oxfordshire District Council in Oxfordshire, England. One third of the council was up for election and the Conservative party stayed in overall control of the council.

2014 West Oxfordshire District Council election

The 2014 West Oxfordshire District Council election took place on 22 May 2014 to elect members of West Oxfordshire District Council in Oxfordshire, England. One third of the council was up for election and the Conservative party stayed in overall control of the council.

The fifth election to the City and County of Swansea Council was held in May 2012. It was preceded by the 2008 election and will be followed by the 2017 election.

References

  1. "City and County Elections 2008". City and County of Swansea. Retrieved 28 February 2015.