City and County of Swansea Council election, 1999

Last updated

The second elections to the City and County of Swansea Council were held in May 1999. [1] It was preceded by the 1995 election and followed by the 2004 election.

City and County of Swansea Council

The City and County of Swansea Council is the governing body for one of the Principal Areas of Wales covering Swansea, Gower and the surrounding area. The council consists of 72 councillors representing 36 electoral wards.

Contents

Overview

All council seats were up for election. These were the second elections held following local government reorganisation and the abolition of West Glamorgan County Council.

Boundaries

There were some changes in ward boundaries for this election.

Candidates

The contests were fought by most of the main parties but Labour was the only one to contest the majority of seats.


City and County of Swansea Council election result 1995
PartySeatsGainsLossesNet gain/lossSeats %Votes %Votes+/−
  Labour
  Conservative
  Liberal Democrat
  Plaid Cymru
  Independent
  Green 0

Results

Bishopston (one seat)

Bishopston 1999
PartyCandidateVotes%±
Independent Keith Edmund MarshUnopposed
Independent gain from Liberal Democrat

Bonymaen (two seats)

The Independent candidate had captured the seat from Labour at a by-election.

Bonymaen 1999
PartyCandidateVotes%±
Independent John Brian Hague* 1,246
Labour Mair Eluned Gibbs* 1,240
Labour Wyndham Parry Davies 632
Liberal Democrat Nora Maria O'Sullivan 311
Independent hold Swing
Labour hold Swing

Castle (four seats)

Possible boundary change. The number of seats increased from three to four. David Phillips had previously represented the Uplands ward.

Uplands (electoral ward) human settlement in United Kingdom

Uplands is name of an electoral ward in the City and County of Swansea, Wales, UK.

Castle 1999
PartyCandidateVotes%±
Labour Robert Alan Lloyd* 1,622
Labour Barbara Joyce Hynes* 1,579
Labour David Phillips* 1,477
Labour Dereck John Roberts* 1,440
Plaid Cymru Yvonne Marie Davies 1,111
Liberal Democrat Yvonne Marjorie Holley 937
Green Benjamin David Grigg 632
Conservative Paul Raymond Morris 503
Conservative Sonya Winifred R. Morris 477
United Socialists David Richard Warren 273
Labour win (new seat)

Clydach (two seats)

Possible boundary change. The number of seats increased from one to two.

Clydach 1999
PartyCandidateVotes%±
Independent Sylvia Mary Lewis 963
Labour Roger Llewellyn Smith 845
Labour Bryan Edwin Ayres* 844
Plaid Cymru James Vernon Davies 764
Plaid Cymru Diana Owen 697
Independent Denise Preece 509
Independent win (new seat)
Labour win (new seat)

Cockett (four seats)

Dai Lloyd had won a seat from Labour at a by-election.

Cockett 1999
PartyCandidateVotes%±
Plaid Cymru David Rhys Lloyd* 2,366
Labour Lilian Maud Hopkin* 1,902
Plaid Cymru William Keith Morgan 1,581
Labour Victor Cyril Alexander* 1,528
Plaid Cymru Adrian Hugh Rees 1,478
Plaid Cymru Nicholas Walsh 1,381
Labour Ann Pennock 1,343
Labour Clive Keith Morgan 1,231
Liberal Democrat Tudor Richard Donne 639
Plaid Cymru hold Swing
Labour hold Swing
Plaid Cymru gain from Labour Swing
Labour hold Swing

Cwmbwrla (three seats)

Possible boundary change. The number of seats increased from two to three.

Cwmbwrla 1999
PartyCandidateVotes%±
Liberal Democrat Peter Malcolm Black* 2,172
Liberal Democrat Christopher Ashleigh Holley* 1,909
Liberal Democrat Lewis Graham Thomas 1,722
Labour Carolyn Harris 867
Labour Brian Trevor George Ludlam 722
Labour Robert Mark Ludlam 657
Liberal Democrat win (new seat)

Dunvant (two seats)

Possible boundary change. The number of seats increased from one to two. Labour had held the single seat ward in 1995.

Dunvant 1999
PartyCandidateVotes%±
Liberal Democrat John Newbury 1,083
Liberal Democrat Nicholas John Tregoning 627
Independent Elizabeth Ann Davies 491
Labour Hardev Aswani 395
Labour Diana Samuel 370
Conservative David Nicholas Thomas 219
Liberal Democrat win (new seat)

Fairwood (one seat)

Elected as an Independent in 1995, John Bushell successfully defended the seat as a Conservative.

Fairwood 1999
PartyCandidateVotes%±
Conservative John Gunther Bushell* 655
Labour John Sydney Mills 514
Conservative hold Swing

Gorseinon Central (one seat)

Gorseinon Central 1995
PartyCandidateVotes%±
Labour 'Morlais Thomas'Unopposed
Labour win (new seat)

Gorseinon East (one seat)

Gorseinon East 1999
PartyCandidateVotes%±
Labour Glyn Seabourne* 558
Plaid Cymru Darren Jeffery Thomas 401
Conservative Eleanor Mary Davies 89
Labour hold Swing

Gower (one seat)

Gower 1999
PartyCandidateVotes%±
Independent Richard David Lewis* 770
Labour Anthont John Beddow 366
Liberal Democrat Hildegarde Ann Roberts 296
Conservative Gordon Howells 185
Independent hold Swing

Gowerton (one seat)

Possible boundary change.

Gowerton 1999
PartyCandidateVotes%±
Labour Ronald Morgan Thomas* 722
Plaid Cymru Alan Morgan Griffiths 395
Independent Peter Davies 335
Conservative Keith Roberts 121
Green David Charles Howells 68
Labour win (new seat)

Gowerton West (one seat)

Gowerton West 1995
PartyCandidateVotes%±
Labour Harry Thomas 494
Conservative Lyndon Jones 271
Liberal Democrat Robert Dickens 72
Labour hold Swing

Killay North (one seat)

Killay North 1999
PartyCandidateVotes%±
Liberal Democrat Mary Helen Jones 396
Labour Perry Stephen Buck*
Independent George Smith Gunn 292
Independent Stuart James Rice 230
Conservative Philip David Helliwell 167
Liberal Democrat gain from Labour Swing

Killay South (one seat)

Killay South 1999
PartyCandidateVotes%±
Liberal Democrat Gerald Glyn Clement* 790
Labour Jeffrey William Walton 203
Conservative Sarah Jane Cadogan 131
Liberal Democrat hold Swing

Kingsbridge (two seats)

Possible boundary change. The number of seats reduced from two to one. Labour had held both seats in 1995.

Kingsbridge 1999
PartyCandidateVotes%±
Labour William Gethin Evans* 650
Plaid Cymru Katherine Mary Stock 590
Liberal Democrat Michael John Barry 220
Labour win (new seat)

Landore (two seats)

Landore 1999
PartyCandidateVotes%±
Labour Derek Herbert Cox* 913
Labour Holland William Ayres* 900
Liberal Democrat Robert Speht 516
Labour hold Swing
Labour hold Swing

Llangyfelach (one seat)

Possible boundary change. The number of seats reduced from two to one. Independents had held both seats in 1995. Phil Downing had been elected for the now-abolished

Llangyfelach 1999
PartyCandidateVotes%±
Independent David Gareth Sullivan* 644
Independent Audrey R.A. Clement* 538
Labour Philip Downing* 283
Conservative William H.E. Alabaster 65
Independent win (new seat)

Llansamlet (four seats)

Possible boundary change. The number of seats increased from three to four.

Llansamlet 1995
PartyCandidateVotes%±
Labour Lawrence David Bailey* 1,682
Labour June Evans* 1,646
Labour Paul Lloyd* 1,410
Labour Dennis Henry James 1,260
Liberal Democrat Richard David George 903
Community First Kevin Adrian John 747
Community First Margaret Lydia Harris 686
Community First Peter Gilbert Harris 558
Community First Frederick S. Lewis 552
Conservative Robert William Megson 471
Labour win (new seat)

Lower Loughor (one seat)

Lower Loughor 1999
PartyCandidateVotes%±
Labour Daniel Raymond James* unopposed
Labour hold Swing

Mawr (one seat)

Mawr 1999
PartyCandidateVotes%±
People's RepresentativeIoan Merritt Richard 646
Labour Brian Charles Kennedy 164
Liberal Democrat Michael Haller 61
Others hold Swing

Mayals(one seat)

Mayals 1999
PartyCandidateVotes%±
Independent David Charles Evans 386
Conservative Michael George Shellard 358
Liberal Democrat Neil Sinclair Lewis 273
Labour David Ian Collins 209
Independent gain from Liberal Democrat Swing

Morriston (five seats)

Possible boundary change. The number of seats increased from four to five.

Morriston 1999
PartyCandidateVotes%±
Labour Michael John Hedges* 2,939
Labour William John F. Davies* 2,869
Labour Robert Francis-Davies* 2,798
Labour Robert John Lloyd* 2,687
Labour Valerie Lloyd 2,576
Liberal Democrat John Philip Bleay 1,527
Conservative William Hughes 1,201
Labour win (new seat)

Mynyddbach (three seats)

Mynyddbach 1999
PartyCandidateVotes%±
Labour Ceinwen Thomas* 1,984
Labour Byron George Owen* 1,826
Labour Charles Glyndwr White 1,616
Plaid Cymru Laurence Douthwaite John 1,082
Liberal Democrat Elwyn Vernon Jones 759
Conservative Martyn Ford 490
Labour hold Swing
Labour hold Swing
Labour hold Swing

Newton (one seat)

Newton 1999
PartyCandidateVotes%±
Liberal Democrat Susan Mary Waller* 745
Conservative Anthony Charles Saunders Colburn 475
Labour Jane Melanie Thomas 259
Liberal Democrat hold Swing

Oystermouth (one seat)

Oystermouth 1999
PartyCandidateVotes%±
Conservative Joan Thyrza Peters* 709
Labour Aubrey Jones 482
Liberal Democrat Alexander James 211
Plaid Cymru Mari Elin Waddington 206
Conservative hold Swing

Penclawdd (one seat)

Penclawdd 1999
PartyCandidateVotes%±
Independent Howard John Morgan* 975
Labour Owen James Guy 671
Independent hold Swing

Penderry (three seats)

Possible boundary change. The number of seats reduced from four to three. Doreen Jones represented Mynyddbach from 1995 until 1999

Penderry 1999
PartyCandidateVotes%±
Labour Doreen Jones* 1,461
Labour June Elizabeth Burtonshaw* 1,422
Labour Grenville Phillips* 1,414
Liberal Democrat Gaynor Meehan 611
Conservative Jason Peter Morgan 348
Labour win (new seat)

Pennard(one seat)

Pennard 1999
PartyCandidateVotes%±
Independent Margaret Smith* unopposed
Independent hold Swing

Penyrheol (two seats)

Penyrheol 1995
PartyCandidateVotes%±
Labour David Thomas Vernon Davies* 950
Labour David Islwyn Elfed Jones* 772
Independent Carloine Ann Arthur 703
Liberal Democrat Stephen Josef Neesmann 431
Conservative John Timothy 181
Labour hold Swing
Labour hold Swing

Pontarddulais (two seats)

Boundary Change. The number of seats increased from one to two. John Miles represented the Talybont ward which was abolished.

Pontarddulais 1999
PartyCandidateVotes%±
Labour Gareth Williams* 1,355
Labour John Treharne Miles* 1,278
Independent David Thomas Howells 791
Independent Owen Leroy Evans 677
Liberal Democrat Janine Linda Evans 252
Conservative Dorothy Roberta Gardiner 121
Labour win (new seat)

Sketty (five seats)

Possible boundary change. The number of seats increased from four to five. June Stanton was elected as an Independent in 1995 but subsequently joined the Liberal Democrats.

Sketty 1999
PartyCandidateVotes%±
Liberal Democrat Rosina June Stanton* 3,037
Labour Mehar Chand Verma* 1,853
Liberal Democrat Arthur Michael Day 1,725
Conservative Thomas Huw Rees 1,526
Conservative John Philip Glew 1,465
Labour Gordon Carruthers* 1,426
Liberal Democrat Tracey Anne Dunford 1,274
Labour Anthea Priscilla Symonds 1,247
Labour Patrick Richard Ellis 1,142
Liberal Democrat Lilian Mary Pritchard 1,132
Independent Anthony Trevor Lloyd 1,129
Conservative Philip Malcolm Bray 1,111
Liberal Democrat Dyfed E.F. Alsop 1,105
Conservative Mark Roy Burgess 1,101
Labour Leonard Bayzile Howell 1,060
Plaid Cymru Ian Richard Titherington 1,043
Plaid Cymru Sara Eirwen Reid 1,036
Liberal Democrat win (new seat)
Labour win (new seat)
Liberal Democrat win (new seat)
Conservative win (new seat)

St Thomas (two seats)

St Thomas 1995
PartyCandidateVotes%±
Labour Cyril Frederick Johnstone* 1,154
Labour Alan Rees Richards* 1,124
Independent David Alan Robinson 747
Liberal Democrat Paul Courtney Jones 268
Conservative Jonathan Geoffrey Bidmead 195
Labour hold Swing
Labour hold Swing

Townhill (three seats)

Possible boundary change. The number of seats increased from two to three.

Townhill 1999
PartyCandidateVotes%±
Labour Tyssul Lewis* 968
Labour David Hopkins* 913
Labour William Frederick Stuckey 724
Liberal Democrat Beryl Edwards 693
Plaid Cymru Gregory Lee Evans 377
Independent Anthony Roper 351
Liberal Democrat Gordon C. Manning 338
Independent Margaret Louvane Abraham 297
Labour win (new seat)

Uplands (four seats)

Uplands 1999
PartyCandidateVotes%±
Labour Jennifer Caryl Hood 1,352
Labour Derek James 1,349
Labour Maureen Clough Stuckey* 1,336
Labour Moira Ann Singh 1,302
Conservative Dick Phillips 1,226
Plaid Cymru Harri Lloyd Roberts 1,126
Plaid Cymru Clive Ian Gary Smith 1,062
Conservative Jean Margaret Taverner 1,010
Liberal Democrat Peter Richard Brooks 1,002
Independent Susan Rosemary Sturgess 882
Neighbourhood Independent Peter May 877
Conservative Robert James Buckland 875
Conservative Brian Hill-Mackintosh 846
Green Simon Mark Clegg 816
Labour hold Swing
Labour hold Swing
Labour hold Swing
Labour hold Swing

Upper Loughor (two seats)

Possible boundary change. the number of seats was reduced from two to one

Upper Loughor 1999
PartyCandidateVotes%±
Labour David Alcwyn Evans* 516
Plaid Cymru John Griffiths 390
Labour hold Swing

West Cross (two seats)

The Liberal Democrats won a by-election following the election of previous member Martin Caton as MP for Gower.

Martin Philip Caton is a British Labour Party politician who was the Member of Parliament (MP) for Gower from 1997 to 2015.

West Cross 1999
PartyCandidateVotes%±
Labour Desmond Wilfred W. Thomas 1,094
Labour Mark Clive Child 1,004
Liberal Democrat Rene Harood Kinzett* 649
Conservative Lynne Davies 609
Liberal Democrat Reginald C. Edwards 565
Conservative Vera Margaret Duncan 512
Plaid Cymru Dafydd Rhys Robert 367
Labour hold Swing
Labour gain from Liberal Democrat Swing

Related Research Articles

Aberdeen City Council Place

Aberdeen City Council represents the Aberdeen City council area of Scotland.

Sheffield City Council elections usually take place by thirds, three years out of every four. Each of Sheffield's 28 wards is represented by three positions on the council, meaning there are usually 28 seats contested in each local election. 2004 saw new ward boundaries and therefore all seats were contested.

Sunderland City Council Local government body in England

Sunderland City Council is the local authority of the City of Sunderland in Tyne and Wear, England. It is a metropolitan district council, one of five in Tyne and Wear and one of 36 in the metropolitan counties of England, and provides the majority of local government services in Sunderland.

Elections to Slough Borough Council were held on 4 May 2006. One third of the council was up for election. This was the 121st Slough general local authority election since Slough became a local government unit in 1863.

An election to Slough Borough Council was held on 10 June 2004. The whole council was up for election. This was the 120th Slough general local authority election, since Slough became a local government unit in 1863, including both whole Council elections and elections by thirds.

Politics of the Highland council area

The politics of the Highland council area in Scotland are evident in the deliberations and decisions of the Highland Council, in elections to the council, and in elections to the House of Commons of the Parliament of the United Kingdom (Westminster) and the Scottish Parliament (Holyrood). In the European Parliament the area is within the Scotland constituency, which covers all of the 32 council areas of Scotland.

Elections to the Borough Council in Slough, England, were held on 3 May 2007. One third of the council was up for election. This was the 122nd Slough general local authority election since Slough became a local government unit in 1863.

An election to Ceredigion County Council was held on 10 June 2004 on the same day of the European Elections. It was preceded by the 1999 election and followed by the 2008 election.

The 2004 South Tyneside Metropolitan Borough Council election took place on 10 June 2004 to elect members of South Tyneside Metropolitan Borough Council in Tyne and Wear, England. The whole council was up for election with boundary changes since the last election in 2003 reducing the number of seats by 6. The Labour party stayed in overall control of the council.

The 2011 council elections in Guildford saw the Conservatives retain control over Guildford Borough Council with an increased majority of 20 seats. Full results for each ward can be found at Guildford Council election, full results, 2011.

The 2003 elections for Guildford Borough Council were the first, and as of 2011 the only, full election for Guildford Borough Council conducted by an all postal ballot. The result saw the Conservatives win a majority of seats on Guildford Borough Council for the first time since losing their majority in the 1991 election.

The second elections to the Carmarthenshire County Council were held in May 1999. It was preceded by the 1995 election and followed by the 2004 election. They resulted in a coalition between Independent councillors and Plaid Cymru for the next five years.

2015 Breckland District Council election

The 2015 Breckland District Council election took place on 7 May 2015 to elect members of Breckland District Council in England. This was on the same day as other local elections.

2015 South Oxfordshire District Council election

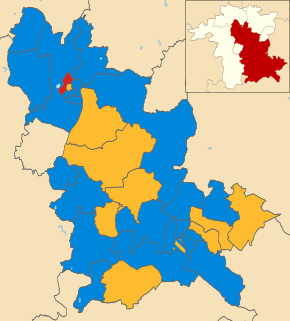
The 2015 South Oxfordshire District Council election was held on 7 May 2015 to elect members of South Oxfordshire District Council in England. This was on the same day as other local elections.

2003 Wychavon District Council election

The 2003 Wychavon District Council election took place on 1 May 2003 to elect members of Wychavon District Council in Worcestershire, England. The whole council was up for election with boundary changes since the last election in 1999 reducing the number of seats by four. The Conservative party stayed in overall control of the council.

2015 Wyre Forest District Council election

The 2015 Wyre Forest District Council election took place on 7 May 2015 to elect members of Wyre Forest District Council in Worcestershire, England. The whole council was up for election after boundary changes reduced the number of seats by nine. The Conservative party gained overall control of the council from no overall control.

The second election to the Powys County Council following local government reorganisation was held in May 1999. It was preceded by the 1995 election and followed by the 2004 election. The election resulted once again in a majority of Independent councillors.

2016 Exeter City Council election

The 2016 Exeter City Council election took place on 5 May 2016, to elect members of Exeter City Council in England. Following boundary changes, the entire council was up for election, and all 13 wards were contested, each electing three councillors. The election was held concurrently with other local elections held in England on the 5 May.

2011 South Oxfordshire District Council election

The 2011 South Oxfordshire District Council election was held on 5 May 2011 to elect members of South Oxfordshire District Council in England. This was on the same day as other local elections.

2002 Merton London Borough Council election

Elections for the London Borough of Merton were held on 2 May 2002. This was on the same day as other local elections in England.

References

  1. "Results". Western Mail. 8 May 1999.