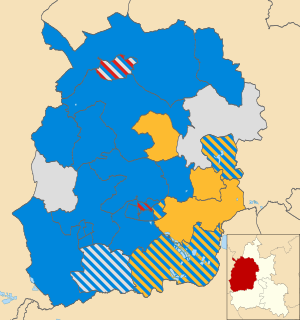
The 2010 West Oxfordshire District Council election took place on 6 May 2010 to elect members of West Oxfordshire District Council in Oxfordshire, England. One third of the council was up for election and the Conservative party stayed in overall control of the council. [1]
West Oxfordshire is a local government district in northwest Oxfordshire, England, including towns such as Woodstock, Burford, Chipping Norton, Charlbury, Carterton and Witney, where the council is based.
Non-metropolitan districts, or colloquially "shire districts", are a type of local government district in England. As created, they are sub-divisions of non-metropolitan counties in a two-tier arrangement.
Oxfordshire is a county in South East England. The ceremonial county borders Warwickshire to the north-west, Northamptonshire to the north-east, Buckinghamshire to the east, Berkshire to the south, Wiltshire to the south-west and Gloucestershire to the west.
After the election, the composition of the council was
The Conservative Party, officially the Conservative and Unionist Party, is a centre-right political party in the United Kingdom. The governing party since 2010, it is the largest in the House of Commons, with 313 Members of Parliament, and also has 249 members of the House of Lords, 18 members of the European Parliament, 31 Members of the Scottish Parliament, 12 members of the Welsh Assembly, eight members of the London Assembly and 8,916 local councillors.
The Liberal Democrats are a liberal political party in the United Kingdom. It is currently led by Vince Cable. They have 11 Members of Parliament in the House of Commons, 96 members of the House of Lords, one member of the European Parliament, five Members of the Scottish Parliament and one member in the Welsh Assembly and London Assembly. At the height of its influence, the party formed a coalition government with the Conservative Party from 2010 to 2015 with its leader Nick Clegg serving as Deputy Prime Minister.
The Labour Party is a centre-left political party in the United Kingdom that has been described as an alliance of social democrats, democratic socialists and trade unionists. The party's platform emphasises greater state intervention, social justice and strengthening workers' rights.
After the last election in 2008 the Conservatives controlled the council with 40 councillors, compared to six for the Liberal Democrats, two independents and one Labour [3] 16 seats were contested in 2010, with the council election taking place at the same time as the 2010 general election. [4] [5]
A Councillor is a member of a local government council.
The Conservatives stood a full 16 candidates, while the Liberal Democrats had 13, Labour had eight, Greens 4 and there was one independent candidate. [4]
The Green Party of England and Wales is a green, left-wing political party in England and Wales. Headquartered in London, since September 2018, its co-leaders are Siân Berry and Jonathan Bartley. The Green Party has one representative in the House of Commons, one in the House of Lords, and three in the European Parliament. In addition, it has various councillors in UK local government and two members of the London Assembly.
The Conservatives won 14 of the 16 seats contested to have 40 councillors. [4] The Liberal Democrats gained a seat after winning the other two seats contested, while both Labour and an independent were left with one seat. [4] 10 of the 11 councillors who stood again were re-elected and overall turnout at the election was 72.45%. [4]
Voter turnout is the percentage of eligible voters who cast a ballot in an election. Eligibility varies by country, and the voting-eligible population should not be confused with the total adult population. Age and citizenship status are often among the criteria used to determine eligibility, but some countries further restrict eligibility based on sex, race, or religion.
Party | Seats | Gains | Losses | Net gain/loss | Seats % | Votes % | Votes | +/− | |
---|---|---|---|---|---|---|---|---|---|
Conservative | 14 | 2 | 2 | 0 | 87.5 | 59.1 | 21,617 | +2.6% | |
Liberal Democrat | 2 | 2 | 1 | +1 | 12.5 | 26.6 | 9,704 | +4.1% | |
Labour | 0 | 0 | 0 | 0 | 0 | 10.3 | 3,763 | +2.4% | |
Green | 0 | 0 | 0 | 0 | 0 | 2.8 | 1,029 | -5.7% | |
Independent | 0 | 0 | 1 | -1 | 0 | 1.2 | 436 | -2.3% |
Party | Candidate | Votes | % | ± | |
---|---|---|---|---|---|
Conservative | Hilary Hibbert-Biles | 969 | 77.1 | -1.5 | |
Labour | John Gittings | 288 | 22.9 | +11.8 | |
Majority | 681 | 54.2 | -13.2 | ||
Turnout | 1,257 | 78.0 | +27.7 | ||
Conservative hold | Swing |
Party | Candidate | Votes | % | ± | |
---|---|---|---|---|---|
Conservative | Martin Barrett | 1,682 | 76.0 | -2.4 | |
Liberal Democrat | Brenda Churchill | 532 | 24.0 | +11.9 | |
Majority | 1,150 | 51.9 | -14.4 | ||
Turnout | 2,214 | 75.5 | +30.3 | ||
Conservative gain from Independent | Swing | ||||
Party | Candidate | Votes | % | ± | |
---|---|---|---|---|---|
Conservative | Verena Hunt | 691 | 61.3 | -15.0 | |
Independent | Shane Rae | 436 | 38.7 | +20.0 | |
Majority | 255 | 22.6 | -35.0 | ||
Turnout | 1,127 | 73.5 | +30.5 | ||
Conservative hold | Swing |
Party | Candidate | Votes | % | ± | |
---|---|---|---|---|---|
Conservative | Derek Cotterill | 826 | 76.7 | -3.1 | |
Liberal Democrat | John Lilly | 173 | 16.1 | +1.2 | |
Labour | David Heyes | 78 | 7.2 | +1.9 | |
Majority | 653 | 60.6 | -4.2 | ||
Turnout | 1,077 | 73.6 | +23.6 | ||
Conservative hold | Swing |
Party | Candidate | Votes | % | ± | |
---|---|---|---|---|---|
Conservative | Henry Howard | 1,655 | 66.7 | -3.3 | |
Liberal Democrat | Jonathan Biggs | 825 | 33.3 | +33.3 | |
Majority | 830 | 33.5 | -14.7 | ||
Turnout | 2,480 | 64.2 | +46.4 | ||
Conservative hold | Swing |
Party | Candidate | Votes | % | ± | |
---|---|---|---|---|---|
Conservative | Maxine Crossland | 1,560 | 70.3 | -4.5 | |
Labour | David Wesson | 344 | 15.5 | +15.5 | |
Green | Anthony Barrett | 314 | 14.2 | +14.2 | |
Majority | 1,216 | 54.8 | +5.2 | ||
Turnout | 2,218 | 71.0 | +38.0 | ||
Conservative hold | Swing |
Party | Candidate | Votes | % | ± | |
---|---|---|---|---|---|
Conservative | Windell Walcott | 1,642 | 78.0 | +28.1 | |
Liberal Democrat | Amanda Epps | 464 | 22.0 | -28.1 | |
Majority | 1,178 | 55.9 | |||
Turnout | 2,106 | 68.3 | +34.8 | ||
Conservative hold | Swing |
Party | Candidate | Votes | % | ± | |
---|---|---|---|---|---|
Conservative | Anne Roy-Barker | 1,673 | 47.3 | -2.1 | |
Labour | Georgina Burrows | 1,394 | 39.4 | +8.9 | |
Liberal Democrat | Christopher Tatton | 467 | 13.2 | +13.2 | |
Majority | 279 | 7.9 | -11.0 | ||
Turnout | 3,534 | 71.5 | +30.4 | ||
Conservative hold | Swing |
Party | Candidate | Votes | % | ± | |
---|---|---|---|---|---|
Conservative | Stephen Hayward | 795 | 62.2 | -4.9 | |
Liberal Democrat | June Tayler | 294 | 23.0 | +11.5 | |
Labour | Christopher Johnson | 189 | 14.8 | +1.0 | |
Majority | 501 | 39.2 | -14.1 | ||
Turnout | 1,278 | 77.0 | +35.6 | ||
Conservative hold | Swing |
Party | Candidate | Votes | % | ± | |
---|---|---|---|---|---|
Liberal Democrat | Lawrence Poole | 1,955 | 56.7 | +11.0 | |
Conservative | Mark Walker | 1,492 | 43.3 | -2.2 | |
Majority | 463 | 13.4 | +13.2 | ||
Turnout | 3,447 | 75.4 | +34.9 | ||
Liberal Democrat gain from Conservative | Swing | ||||
Party | Candidate | Votes | % | ± | |
---|---|---|---|---|---|
Conservative | Colin Dingwall | 1,300 | 49.8 | -0.1 | |
Liberal Democrat | Michael Baggaley | 1,013 | 38.8 | -4.6 | |
Labour | Robert Evans | 169 | 6.5 | -0.2 | |
Green | Harriet Marshall | 126 | 4.8 | +4.8 | |
Majority | 287 | 11.0 | +4.5 | ||
Turnout | 2,608 | 76.9 | +32.6 | ||
Conservative hold | Swing |
Party | Candidate | Votes | % | ± | |
---|---|---|---|---|---|
Conservative | Stephen Good | 1,457 | 57.2 | -1.5 | |
Liberal Democrat | Elizabeth Maher | 1,088 | 42.8 | +1.5 | |
Majority | 369 | 14.5 | -2.9 | ||
Turnout | 2,545 | 78.0 | +28.7 | ||
Conservative gain from Liberal Democrat | Swing | ||||
Party | Candidate | Votes | % | ± | |
---|---|---|---|---|---|
Conservative | William Goffe | 823 | 70.8 | -9.9 | |
Liberal Democrat | Geoffrey Walton | 339 | 29.2 | +29.2 | |
Majority | 484 | 41.7 | -19.8 | ||
Turnout | 1,162 | 74.4 | +36.4 | ||
Conservative hold | Swing |
Party | Candidate | Votes | % | ± | |
---|---|---|---|---|---|
Conservative | James Mills | 2,246 | 55.5 | -8.1 | |
Liberal Democrat | Mark Balaam | 762 | 18.8 | +18.8 | |
Labour | Duncan Enright | 760 | 18.8 | +0.9 | |
Green | Paul Creighton | 278 | 6.9 | -4.5 | |
Majority | 1,484 | 36.7 | -9.1 | ||
Turnout | 4,046 | 70.5 | +38.1 | ||
Conservative hold | Swing |
Party | Candidate | Votes | % | ± | |
---|---|---|---|---|---|
Conservative | Anthony Harvey | 1,733 | 55.4 | -3.0 | |
Liberal Democrat | Paul Slamin | 544 | 17.4 | +17.4 | |
Labour | Andrew Coles | 541 | 17.3 | +17.3 | |
Green | Sandra Simpson | 311 | 9.9 | -2.6 | |
Majority | 1,189 | 38.0 | +3.1 | ||
Turnout | 3,129 | 67.6 | +36.9 | ||
Conservative hold | Swing |
Party | Candidate | Votes | % | ± | |
---|---|---|---|---|---|
Liberal Democrat | Julian Cooper | 1,248 | 53.8 | +5.3 | |
Conservative | Jill Dunsmore | 1,073 | 46.2 | -5.3 | |
Majority | 175 | 7.5 | |||
Turnout | 2,321 | 75.0 | +31.4 | ||
Liberal Democrat gain from Conservative | Swing | ||||
The 1999 Craven District Council election took place on 6 May 1999 to elect members of Craven District Council in North Yorkshire, England. One third of the council was up for election and the Conservative party gained overall control of the council from no overall control.
The 2007 St Albans City and District Council election took place on 3 May 2007 to elect members of St Albans District Council in Hertfordshire, England. One third of the council was up for election and the Liberal Democrats lost overall control of the council to no overall control.
The 2010 Craven District Council election took place on 6 May 2010 to elect members of Craven District Council in North Yorkshire, England. One third of the council was up for election and the Conservative party gained overall control of the council from no overall control.
The 2011 Fenland District Council election took place on 5 May 2011 to elect members of Fenland District Council in Cambridgeshire, England. The whole council was up for election and the Conservative party stayed in overall control of the council.
The 2011 Harlow District Council election took place on 5 May 2011 to elect members of Harlow District Council in Essex, England. One third of the council was up for election and the Conservative party stayed in overall control of the council.
The 2014 Craven District Council election took place on 22 May 2014 to elect members of Craven District Council in North Yorkshire, England. One third of the council was up for election and the Conservative party stayed in overall control of the council.
The 2015 Wychavon District Council election took place on 7 May 2015 to elect members of Wychavon District Council in Worcestershire, England. The whole council was up for election and the Conservative party stayed in overall control of the council.
The 1998 West Oxfordshire District Council election took place on 7 May 1998 to elect members of West Oxfordshire District Council in Oxfordshire, England. One third of the council was up for election and the council stayed under no overall control.
The 2000 West Oxfordshire District Council election took place on 4 May 2000 to elect members of West Oxfordshire District Council in Oxfordshire, England. One third of the council was up for election and the Conservative party gained overall control of the council from no overall control.
The 2002 West Oxfordshire District Council election took place on 2 May 2002 to elect members of West Oxfordshire District Council in Oxfordshire, England. The whole council was up for election with boundary changes since the last election in 2000. The Conservative party stayed in overall control of the council.
The 2003 West Oxfordshire District Council election took place on 1 May 2003 to elect members of West Oxfordshire District Council in Oxfordshire, England. One third of the council was up for election and the Conservative party stayed in overall control of the council.
The 2004 West Oxfordshire District Council election took place on 10 June 2004 to elect members of West Oxfordshire District Council in Oxfordshire, England. One third of the council was up for election and the Conservative party stayed in overall control of the council.
The 2006 West Oxfordshire District Council election took place on 4 May 2006 to elect members of West Oxfordshire District Council in Oxfordshire, England. One third of the council was up for election and the Conservative party stayed in overall control of the council.
The 2007 West Oxfordshire District Council election took place on 3 May 2007 to elect members of West Oxfordshire District Council in Oxfordshire, England. One third of the council was up for election and the Conservative party stayed in overall control of the council.
The 2008 West Oxfordshire District Council election took place on 1 May 2008 to elect members of West Oxfordshire District Council in Oxfordshire, England. One third of the council was up for election and the Conservative party stayed in overall control of the council.
The 2011 West Oxfordshire District Council election took place on 5 May 2011 to elect members of West Oxfordshire District Council in Oxfordshire, England. One third of the council was up for election and the Conservative party stayed in overall control of the council.
The 2012 West Oxfordshire District Council election took place on 3 May 2012 to elect members of West Oxfordshire District Council in Oxfordshire, England. One third of the council was up for election and the Conservative party stayed in overall control of the council.
The 2014 West Oxfordshire District Council election took place on 22 May 2014 to elect members of West Oxfordshire District Council in Oxfordshire, England. One third of the council was up for election and the Conservative party stayed in overall control of the council.
The 2015 West Oxfordshire District Council election took place on 22 May 2015 to elect members of West Oxfordshire District Council in Oxfordshire, England. One third of the council was up for election and the Conservative party stayed in overall control of the council.
The 2003 Richmondshire District Council election took place on 1 May 2003 to elect members of Richmondshire District Council in North Yorkshire, England. The whole council was up for election with boundary changes since the last election in 1999. The council stayed under no overall control.