Sunderland City Council election, 2010

Last updated

Sunderland City Council election, 2010
Flag of England.svg
  2008 6 May 2010 2011  

One third of 75 seats on Sunderland City Council
38 seats needed for a majority

 First partySecond partyThird party
 
Party Labour Conservative Independent
Seats before48215
Seats won2230
Seats after52184
Seat changeIncrease2.svg4Decrease2.svg3Decrease2.svg1

 Fourth party
 
Party Liberal Democrat
Seats before1
Seats won0
Seats after1
Seat changeSteady2.svg0

Sunderland UK local election 2010 map.svg
Map of the 2010 Sunderland City Council election results. Labour in red and Conservatives in blue.

Majority party before election

Labour

Majority party after election

Labour

The 2010 Sunderland Council election took place on 6 May 2010 to elect members of Sunderland Metropolitan Borough Council in Tyne and Wear, England. One third of the council was up for election and the Labour party stayed in overall control of the council. [1] The election took place on the same day as the 2010 General Election.

City of Sunderland City and metropolitan borough in England

The City of Sunderland is a local government district of Tyne and Wear, in North East England, with the status of a city and metropolitan borough. It is named after its largest settlement, Sunderland, but covers a far larger area which includes the towns of Hetton-le-Hole, Houghton-le-Spring, and Washington, as well as a range of suburban villages.

Tyne and Wear County of England

Tyne and Wear ( ) is a metropolitan county in the North East region of England around the mouths of the rivers Tyne and Wear. It came into existence in 1974 after the passage of the Local Government Act 1972. It consists of the five metropolitan boroughs of South Tyneside, North Tyneside, City of Newcastle upon Tyne, Gateshead and City of Sunderland. It is bounded on the east by the North Sea, and has borders with Northumberland to the north and County Durham to the south.

England Country in north-west Europe, part of the United Kingdom

England is a country that is part of the United Kingdom. It shares land borders with Wales to the west and Scotland to the north-northwest. The Irish Sea lies west of England and the Celtic Sea lies to the southwest. England is separated from continental Europe by the North Sea to the east and the English Channel to the south. The country covers five-eighths of the island of Great Britain, which lies in the North Atlantic, and includes over 100 smaller islands, such as the Isles of Scilly and the Isle of Wight.

Contents

Campaign

Before the election Sunderland council had 48 Labour, 21 Conservative, 1 Liberal Democrat and 5 Independent councillors. [2] The Independents were made up of 4 in an alliance and 1, Eddie Wake, described as an "Independent Conservative" having been suspended from the Conservative Party in the period since the last local elections in May 2008. [3]

Conservative Party (UK) Political party in the United Kingdom

The Conservative Party, officially the Conservative and Unionist Party, is a centre-right political party in the United Kingdom. Presently led by Theresa May, it has been the governing party since 2010. It presently has 314 Members of Parliament in the House of Commons, 249 members of the House of Lords, and 18 members of the European Parliament. It also has 31 Members of the Scottish Parliament, 12 members of the Welsh Assembly, eight members of the London Assembly and 9,008 local councillors. One of the major parties of UK politics, it has formed the government on 45 occasions, more than any other party.

Liberal Democrats (UK) Political party in the United Kingdom

The Liberal Democrats are a liberal, centrist political party in the United Kingdom. They presently have 11 Members of Parliament in the House of Commons, 96 members of the House of Lords, and one member of the European Parliament. They also have five Members of the Scottish Parliament and a member each in the Welsh Assembly and London Assembly. The party reached the height of its influence in the early 2010s, forming a junior partner in a coalition government from 2010 to 2015. It is presently led by Vince Cable.

A Councillor is a member of a local government council.

In total 89 candidates stood for the 25 seats being contested, with a full 25 from the Labour party, 23 Conservatives, 23 Liberal Democrats, 12 British National Party, 2 Green Party and 4 Independents. [2] This was a substantial decline in candidates for the British National Party, which in previous years had contested every ward. [2] The 2 seats not contested by the Conservative party in Copt Hill and Houghton were where Independent candidates had been successful in previous years, with the Conservative party leader on the council Lee Martin saying the party would not have been able to win the seats. [2] The seats were again contested by Independents campaigning against the Houghton Quarry landfill site. [2]

The British National Party (BNP) is a far-right, fascist political party in the United Kingdom. It is headquartered in Wigton, Cumbria, and its current leader is Adam Walker. A minor party, it has no elected representatives at any level of UK government. Founded in 1982, the party reached its greatest level of success in the 2000s, when it had over fifty seats in local government, one seat on the London Assembly, and two Members of the European Parliament.

Green Party of England and Wales Political party in England and Wales

The Green Party of England and Wales is a green, left-wing political party in England and Wales. Headquartered in London, since September 2018, its Co-Leaders are Siân Berry and Jonathan Bartley. The Green Party has one Member of Parliament in the House of Commons, one representative in the House of Lords, and three Members of the European Parliament. It has various councillors in UK local government and two members of the London Assembly.

Houghton-le-Spring town in the City of Sunderland in the county of Tyne and Wear, England

Houghton-le-Spring is a town in North East England, which has its recorded origins in Norman times. Historically in County Durham, it is now administered as part of the local government district of the City of Sunderland, in Tyne and Wear. It is situated almost equidistant between the cathedral city of Durham 7 miles southwest and Sunderland about 7 mi (11 km) northeast. The town of Seaham and the North Sea lie about 5 mi (8 km) directly east. The villages and towns of Newbottle, Fencehouses and Hetton-le-Hole lie nearby. It has a population of 36,746.

Labour were confident of making gains, pointing to the lowest council tax in the North East and efforts to improve schools and address unemployment. [2] However the Conservatives were also looking to make gains and particularly targeted seats they had previously won in Doxford, Ryhope and Washington South. [2]

North East England Place in England

North East England is one of nine official regions of England at the first level of NUTS for statistical purposes. It covers Northumberland, County Durham, Tyne and Wear, and the area of the former county of Cleveland in North Yorkshire. The region is home to three large conurbations: Teesside, Wearside, and Tyneside, the last of which is the largest of the three and the eighth most populous conurbation in the United Kingdom. There are three cities in the region: Newcastle upon Tyne, the largest, with a population of just under 280,000; Sunderland, also in the metropolitan county of Tyne and Wear; and Durham. Other large towns include Darlington, Gateshead, Hartlepool, Middlesbrough, South Shields, Stockton-on-Tees and Washington.

Unemployment when people are without work and actively seeking work

Unemployment or joblessness is the situation of actively looking for employment, but not being currently employed.

Doxford Park human settlement in United Kingdom

Doxford Park is a suburb of Sunderland, Tyne and Wear, located to the south-west of the city centre. Doxford Park is also the name of a wooded area of land located within the suburb.

Election results

The results saw the Labour party increase their majority on the council after gaining 4 seats to hold 52 of the 75 seats. [4] Labour held every seat they had been defending, while gaining seats from the Conservatives in Barnes, St Peter's and Washington East, and taking Millfield from an Independent, Peter Maddison. [5] Peter Maddison, who was deputy leader of the Independent group, came last in Millfield with 133 votes and independents also failed to take Copt Hill and Houghton. [6] Meanwhile, the Liberal Democrats failed to win any seats, but did see an increase in votes for the party. [6] Overall turnout was 55.02%, compared to 34.9% at the 2008 election, with the highest turnout in Fulwell at 68%. [7]

Voter turnout percentage of eligible voters who cast a ballot in an election

Voter turnout is the percentage of eligible voters who cast a ballot in an election. Eligibility varies by country, and the voting-eligible population should not be confused with the total adult population. Age and citizenship status are often among the criteria used to determine eligibility, but some countries further restrict eligibility based on sex, race, or religion.

Fulwell, Sunderland area and former civil parish in the City of Sunderland, England

Fulwell is an affluent area and former civil parish in the City of Sunderland. The parish was abolished in 1928 as a result of the Sunderland Corporation Act 1927, and the area incorporated into the former County Borough of Sunderland. It borders Seaburn, Southwick, Monkwearmouth, and Roker, and the district border between Sunderland and South Tyneside. Fulwell ward, including South Bents and Seaburn, is the least socially deprived of the city's 25 wards.

The Conservative leader on the council Lee Martin put his parties failure down to a higher turnout due to the election taking place at the same time as the general election and a higher than usual vote share for the Liberal Democrats. [5] Following the election Lee Martin resigned as leader of the Conservative group and was succeeded by Tony Morrissey. [8]

Sunderland Local Election Result 2010 [9] [10]
PartySeatsGainsLossesNet gain/lossSeats %Votes %Votes+/−
  Labour 2240Increase2.svg4884957,058Increase2.svg9.4%
  Conservative 303Decrease2.svg31225.229,358Decrease2.svg6.8%
  Liberal Democrat 000Steady2.svg0018.321,290Increase2.svg6.7%
  Independent 001Decrease2.svg1044,621Decrease2.svg2.4%
  BNP 000Steady2.svg003.33,886Decrease2.svg6.9%
  Green 000Steady2.svg000.3325Increase2.svg0.3%

This resulted in the following composition of the Council: [10]

PartyPrevious CouncilNew Council
Labour4852
Conservatives2118
Independent54
Liberal Democrats11
Total7575
Working majority 21  29 

Ward by ward results

Barnes ward

Barnes [9]
PartyCandidateVotes%±
Labour Michael Essl2,28041.2+16.8
Conservative Angela Barkess1,99136.0-15.6
Liberal Democrat Gouilnara Dixon1,00118.1+3.4
BNP Ethan Maggiore2654.8-4.5
Majority2895.2
Turnout 5,53762.6+24.6
Labour gain from Conservative Swing

Castle ward

Castle [9]
PartyCandidateVotes%±
Labour Doris MacKnight2,17351.3-1.5
Independent Tony Clarke77418.3+8.2
Liberal Democrat Jon Dewart50511.9+4.9
Conservative Geoffrey Scott44910.6-2.6
BNP Ian McDonald3388.0-5.4
Majority1,39933.0-6.4
Turnout 4,23950.0+19.5
Labour hold Swing

Copt Hill ward

Copt Hill [9]
PartyCandidateVotes%±
Labour Bob Heron2,17445.0+10.5
Independent Paul Marriner1,97140.8-4.8
Liberal Democrat Louise Powell68714.2+14.2
Majority2034.2
Turnout 4,83255.2+18.5
Labour hold Swing

Doxford ward

Doxford [9]
PartyCandidateVotes%±
Labour Betty Gibson2,46352.0+17.0
Conservative John Wiper1,41129.8-11.8
Liberal Democrat David Sullivan86718.3+5.2
Majority1,05222.2
Turnout 4,74160.7+25.0
Labour hold Swing

Fulwell ward

Fulwell [9]
PartyCandidateVotes%±
Conservative George Howe2,79745.2-8.0
Labour Barry Curran2,20835.7+9.5
Liberal Democrat Geoffrey Pryke1,18619.2+7.5
Majority5899.5-17.4
Turnout 6,19168.4+24.9
Conservative hold Swing

Hendon ward

Hendon [9]
PartyCandidateVotes%±
Labour Barbara McClennan1,97652.7+16.3
Conservative Sammy Doran99426.5+5.0
Liberal Democrat Nathan Hazlett77920.8+11.7
Majority98226.2+13.0
Turnout 3,74944.7+15.2
Labour hold Swing

Hetton ward

Hetton [9]
PartyCandidateVotes%±
Labour David Tate2,46556.1-13.1
Liberal Democrat Philip Dowell96622.0+22.0
Conservative Paula Wilkinson57513.1-17.7
BNP John Richardson3898.9+8.9
Majority1,49934.1-4.3
Turnout 4,39550.4+19.8
Labour hold Swing

Houghton ward

Houghton [9]
PartyCandidateVotes%±
Labour Dennis Richardson2,29047.1+10.1
Independent John Ellis1,74335.9-8.9
Liberal Democrat David Snowball82417.0+17.0
Majority54711.3
Turnout 4,85754.7+18.9
Labour hold Swing

Millfield ward

Millfield [9]
PartyCandidateVotes%±
Labour Iain Kay1,36338.6+14.3
Liberal Democrat Jim Major1,24135.1-10.9
Conservative Vijaya Das58016.4+1.4
BNP Edward McFarlane2176.1-1.7
Independent Peter Maddison†1333.8+0.1
Majority1223.5
Turnout 3,53448.0+15.7
Labour gain from Liberal Democrat Swing

†Peter Maddison had been elected in 2006 as a Liberal Democrat candidate, but subsequently left the party to sit as an Independent councillor. As such, this win for Labour was technically a gain from the Liberal Democrats.

Pallion ward

Pallion [9]
PartyCandidateVotes%±
Labour Cecilia Gofton1,86651.4+7.1
Conservative Peter O'Connor73920.3-6.8
Liberal Democrat Amanda Robinson70919.5+6.7
BNP Lynne Hudson3188.8-7.0
Majority1,12731.0+13.8
Turnout 3,63248.7+17.1
Labour hold Swing

Redhill ward

Redhill [9]
PartyCandidateVotes%±
Labour Paul Stewart2,66969.5+20.0
Conservative Martin Anderson68417.8+7.3
BNP Terence Woolford49012.8-6.7
Majority1,98551.7+21.6
Turnout 3,84345.2+14.2
Labour hold Swing

Ryhope ward

Ryhope [9]
PartyCandidateVotes%±
Labour Alan Emerson2,90462.7+30.0
Conservative Shaun Cudworth1,72737.3+3.6
Majority1,17725.4
Turnout 4,63158.1+21.8
Labour hold Swing

Sandhill ward

Sandhill [9]
PartyCandidateVotes%±
Labour David Allan2,19757.6+10.6
Conservative Paul Tweddle84222.1-3.9
Liberal Democrat Robert Peel77820.4+7.5
Majority1,35535.5+14.5
Turnout 3,81746.5+15.8
Labour hold Swing

Shiney Row ward

Shiney Row [9]
PartyCandidateVotes%±
Labour Mel Speding2,97454.3+5.9
Conservative Malcolm Vardy1,42025.9-1.8
Liberal Democrat Carol Attewell1,08319.8+6.7
Majority1,55428.4+7.7
Turnout 5,47756.1+22.7
Labour hold Swing

Silksworth ward

Silksworth [9]
PartyCandidateVotes%±
Labour Philip Tye2,74057.7+8.4
Conservative Dominic McDonough1,12623.7-4.7
Liberal Democrat Andy Bex88118.6+9.6
Majority1,61434.0+13.1
Turnout 4,74756.7+20.0
Labour hold Swing

Southwick ward

Southwick [9]
PartyCandidateVotes%±
Labour Norma Wright2,14554.1+10.6
Conservative Terry Docherty85821.6-4.9
Liberal Democrat Anne Griffin61515.5+5.6
BNP John McCaffrey3508.8-11.2
Majority1,28732.4+15.4
Turnout 3,96848.7+16.0
Labour hold Swing

St Anne's ward

St Annes [9]
PartyCandidateVotes%±
Labour Thomas Wright2,26358.8+13.5
Liberal Democrat Simon Dawes78120.3+4.9
Conservative Neil Robinson65617.0-5.0
Green Emily Blyth1513.9+3.9
Majority1,48238.5+15.2
Turnout 3,85146.3+16.8
Labour hold Swing

St Chad's ward

St Chads [9]
PartyCandidateVotes%±
Conservative Robert Oliver2,16547.2-3.1
Labour Darryl Dixon1,84840.3+3.8
Liberal Democrat Sus Wilson57212.5+6.9
Majority3176.9-6.9
Turnout 4,58558.9+17.2
Conservative hold Swing

St Michael's ward

St Michaels [9]
PartyCandidateVotes%±
Conservative Paul Maddison2,32842.4-17.8
Labour Juliana Heron1,77332.3+8.9
Liberal Democrat Paul Edgeworth1,01318.4+8.3
BNP Paul Anderson2063.7-2.7
Green John Lowther1743.2+3.2
Majority55510.1-26.6
Turnout 5,49464.2+23.4
Conservative hold Swing

St Peter's ward

St Peters [9]
PartyCandidateVotes%±
Labour Stephen Bonallie1,91737.2+10.5
Conservative Shirley Leadbitter1,84335.8-12.0
Liberal Democrat Diana Matthew1,03820.1+6.0
BNP Derek Wright3576.9-4.5
Majority741.4
Turnout 5,15560.4+22.6
Labour gain from Conservative Swing

Washington Central ward

Washington Central [9]
PartyCandidateVotes%±
Labour Linda Williams2,79953.1+12.8
Conservative Tina Richardson1,25623.8-2.4
Liberal Democrat John Mclelland1,22023.1-0.2
Majority1,54329.3+15.2
Turnout 5,27560.2+23.9
Labour hold Swing

Washington East ward

Washington East [9]
PartyCandidateVotes%±
Labour Neville Padgett2,37845.0+4.7
Conservative Hilary Johnson1,68131.8-11.4
Liberal Democrat Malcolm Bannister99018.7+6.2
BNP Linda Birtwell2404.5+0.4
Majority69713.2
Turnout 5,28960.7+23.6
Labour gain from Conservative Swing

Washington North ward

Washington North [9]
PartyCandidateVotes%±
Labour Jill Fletcher2,53757.2+4.2
Liberal Democrat Steve Thomas87519.7+6.7
Conservative Tracy Young62414.1-8.1
BNP James Reed3968.9-2.8
Majority1,66237.5+6.7
Turnout 4,43251.2+18.9
Labour hold Swing

Washington South ward

Washington South [9]
PartyCandidateVotes%±
Labour Graeme Miller2,06241.4+3.8
Conservative Joyce Wake1,58631.8-10.7
Liberal Democrat David Griffin1,33326.8+14.3
Majority4769.6
Turnout 4,98160.7+23.2
Labour hold Swing

Washington West ward

Washington West [9]
PartyCandidateVotes%±
Labour Dorothy Trueman2,59449.4+3.3
Liberal Democrat Irene Bannister1,31625.0+7.2
Conservative Olwyn Bird1,02619.5-5.8
BNP Rian Birtwell3206.1-4.7
Majority1,27824.3+3.5
Turnout 5,25658.4+24.5
Labour hold Swing

Related Research Articles

2003 St Helens Metropolitan Borough Council election

The 2003 St Helens Metropolitan Borough Council election took place on 1 May 2003 to elect members of St Helens Metropolitan Borough Council in Merseyside, England. One third of the council was up for election and the Labour party stayed in overall control of the council.

Sunderland City Council Local government body in England

Sunderland City Council is the local authority of the City of Sunderland in Tyne and Wear, England. It is a metropolitan district council, one of five in Tyne and Wear and one of 36 in the metropolitan counties of England, and provides the majority of local government services in Sunderland.

The 2000 Winchester Council election took place on 4 May 2000 to elect members of Winchester District Council in Hampshire, England. One third of the council was up for election and the Liberal Democrats stayed in overall control of the council.

The 2010 West Lancashire Borough Council election took place on 6 May 2010 to elect members of West Lancashire Borough Council in Lancashire, England. One third of the council was up for election and the Conservative party stayed in overall control of the council.

2008 Cheltenham Borough Council election

The 2008 Cheltenham Council election took place on 1 May 2008 to elect members of Cheltenham Borough Council in Gloucestershire, England. Half of the council was up for election and the council stayed under no overall control.

The 1999 Sunderland Council election took place on 6 May 1999 to elect members of Sunderland Metropolitan Borough Council in Tyne and Wear, England. One third of the council was up for election and the Labour party stayed in overall control of the council.

The 2002 Sunderland Council election took place on 2 May 2002 to elect members of Sunderland Metropolitan Borough Council in Tyne and Wear, England. One third of the council was up for election and the Labour party stayed in overall control of the council.

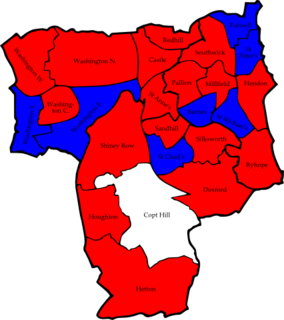
The 2003 Sunderland Council election took place on 1 May 2003 to elect members of Sunderland Metropolitan Borough Council in Tyne and Wear, England. One third of the council was up for election and the Labour party stayed in overall control of the council.

2004 Sunderland City Council election

The 2004 Sunderland City Council election took place on 10 June 2004 to elect members of Sunderland City Council Council in Tyne and Wear, England. The whole council was up for election following boundary changes since the last election in 2003. The Labour party stayed in overall control of the council.

2006 Sunderland City Council election

The 2006 Sunderland Council election took place on 4 May 2006 to elect members of Sunderland City Council in Tyne and Wear, England. One third of the Council was up for election and the Labour party stayed in overall control.

2007 Sunderland City Council election

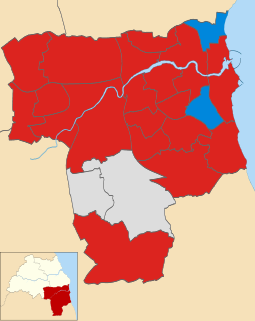
The 2007 Sunderland Council election took place on 3 May 2007 to elect members of Sunderland Metropolitan Borough Council in Tyne and Wear, England. One third of the council was up for election and the Labour party stayed in overall control of the council.

2008 Sunderland City Council election

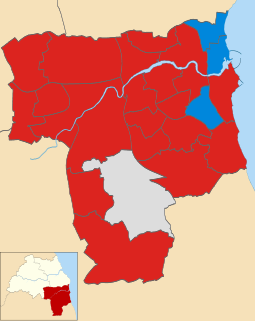
The 2008 Sunderland Council election took place on 1 May 2008 to elect members of Sunderland Metropolitan Borough Council in Tyne and Wear, England. One third of the council was up for election and the Labour party stayed in overall control of the council.

2008 Stroud District Council election

The 2008 Stroud Council election took place on 1 May 2008 to elect members of Stroud District Council in Gloucestershire, England. One third of the council was up for election and the Conservative party stayed in overall control of the council.

2010 Southampton City Council election

The 2010 Southampton Council election took place on 6 May 2010 to elect members of Southampton Unitary Council in Hampshire, England. One third of the council was up for election and the Conservative party stayed in overall control of the council.

2008 Basildon District Council election

The 2008 Basildon District Council election took place on 1 May 2008 to elect members of Basildon District Council in Essex, England. One third of the council was up for election and the Conservative party stayed in overall control of the council.

2011 Sunderland City Council election

The 2011 Sunderland Council election took place on 5 May 2011 to elect members of Sunderland Metropolitan Borough Council in Tyne and Wear, England. One third of the council was up for election and the Labour party stayed in overall control of the council.

2012 Sunderland City Council election

The 2012 Sunderland Council election took place on 3 May 2012 to elect members of Sunderland City Council in England. It was held on the same day as other United Kingdom local elections, 2012.

2014 Sunderland City Council election

The 2014 Sunderland City Council Election took place on 22 May 2014 to elect members of Sunderland Metropolitan Borough Council in Tyne and Wear, England, as part of the wider United Kingdom local elections, 2014. A third of the council were up for election, the Labour Party stayed in overall control of the council.

2016 Sunderland City Council election

The 2016 Sunderland City Council election took place on 5 May 2016 to elect one-third of the members of Sunderland City Council in England. This was on the same day as other local elections held across the United Kingdom.

2018 Sunderland City Council election

The 2018 Sunderland City Council election took place on 3 May 2018 to elect members of Sunderland City Council in England. The election took place on the same day as other local elections.

References

  1. "Sunderland". BBC News Online . 2009-04-19. Retrieved 2010-12-31.
  2. 1 2 3 4 5 6 7 Robertson, Ross (2010-04-09). "Battle begins for your vote". Sunderland Echo.
  3. "Rape joke councillor suspended" . Retrieved 2018-07-03.
  4. Hunt, Amy (2010-05-08). "Labour victorious in local elections". The Journal. p. 9.
  5. 1 2 "Good night for Labour in local elections". Sunderland Echo. 2010-05-07.
  6. 1 2 "Bad night for independents in council elections". Sunderland Echo. 2010-05-07.
  7. "All the results from Tyneside and Wearside's local councils". Evening Chronicle. 2010-05-08. p. 2.
  8. "City Tories name new leader". Sunderland Echo. 2010-05-18.
  9. 1 2 3 4 5 6 7 8 9 10 11 12 13 14 15 16 17 18 19 20 21 22 23 24 25 26 "Results of Poll". Sunderland City Council. Retrieved 2010-12-31.
  10. 1 2 "Local elections 2010". London: guardian.co.uk . 2010-05-07. Retrieved 2010-12-31.
Preceded by
Sunderland City Council election, 2008
Sunderland City Council elections Succeeded by
Sunderland City Council election, 2011