Sunderland City Council election, 2006

Last updated

Sunderland City Council election, 2006
Flag of England.svg
  2004 4 May 2006 2007  

One third of 75 seats on Sunderland City Council
38 seats needed for a majority

 First partySecond partyThird party
 
Party Labour Conservative Liberal Democrat
Seats before60122
Seats won1951
Seats after59132
Seat changeDecrease2.svg1Increase2.svg1Steady2.svg0

 Fourth party
 
Party Independent
Seats before1
Seats won0
Seats after1
Seat changeSteady2.svg0

Sunderland 2006 election map.png
Map of the 2006 Sunderland City Council election results. Labour in red, Conservatives in blue, and Liberal Democrats in yellow.

Majority party before election

Labour

Majority party after election

Labour

The 2006 Sunderland Council election took place on 4 May 2006 to elect members of Sunderland City Council in Tyne and Wear, England. One third of the Council was up for election and the Labour party stayed in overall control. [1] [2]

Sunderland City Council Local government body in England

Sunderland City Council is the local authority of the City of Sunderland in Tyne and Wear, England. It is a metropolitan district council, one of five in Tyne and Wear and one of 36 in the metropolitan counties of England, and provides the majority of local government services in Sunderland.

Tyne and Wear County of England

Tyne and Wear ( ) is a metropolitan county in the North East region of England around the mouths of the rivers Tyne and Wear. It came into existence in 1974 after the passage of the Local Government Act 1972. It consists of the five metropolitan boroughs of South Tyneside, North Tyneside, City of Newcastle upon Tyne, Gateshead and City of Sunderland. It is bounded on the east by the North Sea, and has borders with Northumberland to the north and County Durham to the south.

England Country in north-west Europe, part of the United Kingdom

England is a country that is part of the United Kingdom. It shares land borders with Wales to the west and Scotland to the north-northwest. The Irish Sea lies west of England and the Celtic Sea lies to the southwest. England is separated from continental Europe by the North Sea to the east and the English Channel to the south. The country covers five-eighths of the island of Great Britain, which lies in the North Atlantic, and includes over 100 smaller islands, such as the Isles of Scilly and the Isle of Wight.

Contents

Campaign

Before the election the council was composed of 60 Labour, 12 Conservative, 2 Liberal Democrat and 1 independent councillors. [3] In the period since the previous local elections in May 2004, there had been two by-elections, in Barnes Ward and Millfield Ward (with seats held by the Conservatives and Liberal Democrats respectively), and Doxford councillor Mike Tansey had left the Labour Party to sit as an Independent. [4]

Conservative Party (UK) Political party in the United Kingdom

The Conservative Party, officially the Conservative and Unionist Party, is a centre-right political party in the United Kingdom. Presently led by Theresa May, it has been the governing party since 2010. It presently has 314 Members of Parliament in the House of Commons, 249 members of the House of Lords, and 18 members of the European Parliament. It also has 31 Members of the Scottish Parliament, 12 members of the Welsh Assembly, eight members of the London Assembly and 9,008 local councillors. One of the major parties of UK politics, it has formed the government on 45 occasions, more than any other party.

Liberal Democrats (UK) Political party in the United Kingdom

The Liberal Democrats are a liberal, centrist political party in the United Kingdom. They presently have 11 Members of Parliament in the House of Commons, 96 members of the House of Lords, and one member of the European Parliament. They also have five Members of the Scottish Parliament and a member each in the Welsh Assembly and London Assembly. The party reached the height of its influence in the early 2010s, forming a junior partner in a coalition government from 2010 to 2015. It is presently led by Vince Cable.

A Councillor is a member of a local government council.

In total 99 candidates stood in the election for the 25 seats that were being contested, with the Labour Party, Conservative Party and British National Party contesting every seat. [5] Other candidates included 22 from the Liberal Democrats and 1 from the Official Monster Raving Loony Party. [6] The council was safe for Labour, but the Conservatives were hoping to make gains in the wards of Doxford, St Peters, Washington East and Washington South. [3]

The British National Party (BNP) is a far-right, fascist political party in the United Kingdom. It is headquartered in Wigton, Cumbria, and its current leader is Adam Walker. A minor party, it has no elected representatives at any level of UK government. Founded in 1982, the party reached its greatest level of success in the 2000s, when it had over fifty seats in local government, one seat on the London Assembly, and two Members of the European Parliament.

Official Monster Raving Loony Party political party established in the United Kingdom in 1983

The Official Monster Raving Loony Party is a political party established in the United Kingdom in 1983 by the musician David Sutch, better known as "Screaming Lord Sutch, 3rd Earl of Harrow" or simply "Lord Sutch". It is notable for its deliberately bizarre policies and it effectively exists to satirise British politics, and to offer itself as an alternative for protest voters, especially in constituencies where the party holding the safe seat is unlikely to lose it.

Doxford Park human settlement in United Kingdom

Doxford Park is a suburb of Sunderland, Tyne and Wear, located to the south-west of the city centre. Doxford Park is also the name of a wooded area of land located within the suburb.

Sunderland was one of 4 local councils which had early polling stations available so voters could vote up to 2 weeks before the election. [7]

Election results

The results saw Labour keep a strong majority on the council after finishing just one seat down with 59 councillors. [6] The Labour leader of the council, Robert Symonds, was among those to hold his seat in Castle ward, but the party did lose 2 seats including St Peters to the Conservatives. [6] [8] The other Labour loss was to the Liberal Democrats in Millfield, but Labour also gained Washington South from the Liberal Democrats. [8] [9] This meant the Conservatives had 13 seats, the Liberal Democrats 2 and 1 independent. [6] Meanwhile, the British National Party failed to win any seats, but did win almost 15% of the vote. [9] [10] Overall turnout was 32.2%, with 1,436 voters having used the early voting scheme, while 30,304 people used postal voting, which was 67.54% of those registered to vote by post. [6] [10]

Voter turnout percentage of eligible voters who cast a ballot in an election

Voter turnout is the percentage of eligible voters who cast a ballot in an election. Eligibility varies by country, and the voting-eligible population should not be confused with the total adult population. Age and citizenship status are often among the criteria used to determine eligibility, but some countries further restrict eligibility based on sex, race, or religion.

Postal voting voting, election, ballot papers, distributed to electors or returned by post, mail

Postal voting is voting in an election whereby ballot papers are distributed to electors or returned by post, in contrast to electors voting in person at a polling station or electronically via an electronic voting system. Historically, postal votes must be distributed and placed in return mail before the scheduled election day, it is sometimes referred to as a form of early voting. It can also be used as an absentee ballot. However, in recent times the model in the US has morphed, in municipalities that use postal voting exclusively, to be one of ballots being mailed out to voters, but the return method taking on alternatives of return by mail or dropping off the ballot in person via secure drop boxes and/or voting centers.

Following the election the leader of the Conservative group, Peter Wood, was challenged for the leadership by Lee Martin, but held on by one vote. [11]

Sunderland Local Election Result 2006 [12] [13]
PartySeatsGainsLossesNet gain/lossSeats %Votes %Votes+/−
  Labour 1912Decrease2.svg176.040.527,546Decrease2.svg14.9
  Conservative 510Increase2.svg120.028.419,280Decrease2.svg0.5
  Liberal Democrat 111Steady2.svg04.015.710,683Increase2.svg7.7
  BNP 000Steady2.svg0014.69,948Increase2.svg8
  Independent 000Steady2.svg000.7449Decrease2.svg0.2
  Monster Raving Loony 000Steady2.svg000.148Increase2.svg0.1

This resulted in the following composition of the Council:

PartyPrevious CouncilNew Council
Labour6059
Conservatives1213
Liberal Democrats22
Independent11
Total7575
Working majority 45  43 

Ward by ward results

Barnes [12]
PartyCandidateVotes%±
Conservative Michael Arnott1,54046.6
Labour David Errington77923.6
Liberal Democrat Peter Taylor65219.7
BNP Jason Dent33410.1
Majority76123.0
Turnout 3,30537.3-11.2
Conservative hold Swing
Castle [12]
PartyCandidateVotes%±
Labour Robert Symonds1,20349.7
BNP Ian McDonald51521.3
Independent Stephen Hanratty44918.6
Conservative Alice Mclaren25310.5
Majority68828.4
Turnout 2,42028.4-7.9
Labour hold Swing
Copt Hill [12]
PartyCandidateVotes%±
Labour Robert Heron1,37250.7
Conservative David Wilson89833.2
BNP Michael Webb43816.2
Majority47417.5
Turnout 2,70829.8-7.4
Labour hold Swing
Doxford [12]
PartyCandidateVotes%±
Labour Elizabeth Gibson1,02039.1
Conservative Peter Elliot-West75829.1
Liberal Democrat James Major43816.8
BNP Peter Swain39115.0
Majority26210.0
Turnout 2,60732.5-6.4
Labour hold Swing
Fulwell [12]
PartyCandidateVotes%±
Conservative George Howe1,99652.2
Labour Robert Price97725.5
Liberal Democrat Leslie Wascoe45912.0
BNP Joseph Dobbie39210.3
Majority1,01926.6
Turnout 3,82442.7-9.0
Conservative hold Swing
Hendon [12]
PartyCandidateVotes%±
Labour Mary Smith1,06241.9
BNP David Guynan53421.1
Conservative Alistair Newton52820.8
Liberal Democrat John Jackson36114.3
Monster Raving Loony Rosalyn Warner481.9
Majority52820.8
Turnout 2,53331.4-4.6
Labour hold Swing
Hetton [12]
PartyCandidateVotes%±
Labour Richard Tate1,36456.8
BNP John Richardson54422.6
Conservative George Brown49420.6
Majority82034.1
Turnout 2,40227.4-9.8
Labour hold Swing
Houghton [12]
PartyCandidateVotes%±
Labour Dennis Richardson1,31250.6
Liberal Democrat Avril Snowball47618.4
Conservative Jane Wilson42816.5
BNP Lesley Dathan37614.5
Majority83632.3-6.0
Turnout 2,59229.6
Labour hold Swing
Millfield [12]
PartyCandidateVotes%±
Liberal Democrat Peter Maddison85641.0
Labour Kevin O'Connor66031.6
Conservative Leslie Dobson31315.0
BNP Christopher Lathan25812.4
Majority1969.4
Turnout 2,08729.2-6.7
Liberal Democrat gain from Labour Swing
Pallion [12]
PartyCandidateVotes%±
Labour Cecilia Gofton1,01343.5
Liberal Democrat Margaret Hollern45319.4
BNP James Davison44118.9
Conservative Gwennyth Gibson42418.2
Majority56024.0
Turnout 2,33129.7-6.3
Labour hold Swing
Redhill [12]
PartyCandidateVotes%±
Labour Paul Stewart1,31351.1
BNP Ian Leadbitter68726.8
Liberal Democrat David Griffin30211.8
Conservative Gillian Connor26610.4
Majority62624.4
Turnout 2,56829.7-6.8
Labour hold Swing
Ryhope [12]
PartyCandidateVotes%±
Labour David Wares1,07741.2
Conservative Stephen Daughton74028.3
BNP William Brown41515.9
Liberal Democrat Jane Walters38314.6
Majority33712.9
Turnout 2,61532.6-5.0
Labour hold Swing
Sandhill [12]
PartyCandidateVotes%±
Labour David Allan1,03342.7
Conservative Richard Vardy57723.8
Liberal Democrat Gary Hollern43918.1
BNP Joseph Dobbie37315.4
Majority45618.8
Turnout 2,42229.0-7.7
Labour hold Swing
Shiney Row [12]
PartyCandidateVotes%±
Labour Melville Speding1,47750.0
Conservative Douglas Middlemiss55218.7
Liberal Democrat Paul Forster54818.5
BNP Sharon Leadbitter37912.8
Majority92531.3
Turnout 2,95630.5-8.3
Labour hold Swing
Silksworth [12]
PartyCandidateVotes%±
Labour Philip Tye1,34545.6
Conservative Paula Wilkinson69123.4
Liberal Democrat Sandra Hall47916.2
BNP Anthony James43314.7
Majority65422.2
Turnout 2,94834.9-8.3
Labour hold Swing
Southwick [12]
PartyCandidateVotes%±
Labour Norma Wright1,06342.1
Conservative Terence Docherty53621.3
BNP Alan Brettwood53221.1
Liberal Democrat Christine Griffin39115.5
Majority52720.9
Turnout 2,52230.8-7.0
Labour hold Swing
St Annes [12]
PartyCandidateVotes%±
Labour Thomas Wright97745.5
Conservative Marjorie Matthews44020.5
Liberal Democrat Emma Pryke36817.1
BNP John Boyd36216.9
Majority53725.0
Turnout 2,14727.7-7.4
Labour hold Swing
St Chads [12]
PartyCandidateVotes%±
Conservative Robert Oliver1,74354.0
Labour Alan Whitwham1,01731.5
BNP Carol Dobbie2507.7
Liberal Democrat Diana Lambton2186.8
Majority72622.5
Turnout 3,22841.0-5.4
Conservative hold Swing
St Michaels [12]
PartyCandidateVotes%±
Conservative Paul Maddison1,68053.1
Labour Garry Dent64020.2
Liberal Democrat Lesley Dixon52316.5
BNP Ian Sayers32110.1
Majority1,04032.9
Turnout 3,16438.5-9.8
Conservative hold Swing
St Peters [12]
PartyCandidateVotes%±
Conservative Shirley Leadbitter1,28941.5
Labour Christine Shattock94730.5
Liberal Democrat Geoffrey Pryke47015.1
BNP John McCaffrey40212.9
Majority34211.0
Turnout 3,10838.1-7.1
Conservative gain from Labour Swing
Washington Central [12]
PartyCandidateVotes%±
Labour Denis Whalen1,26344.1
Liberal Democrat Edward Keogh62221.7
Conservative Jacqueline Atkinson57620.1
BNP Kevin Lathan40414.1
Majority64122.4
Turnout 2,86532.4-7.8
Labour hold Swing
Washington East [12]
PartyCandidateVotes%±
Labour Neil MacKnight1,10338.3
Conservative Ian Cuthbert1,00534.9
Liberal Democrat Avril Grundy48716.9
BNP Derek Wright2869.9
Majority983.4
Turnout 2,88133.2-3.8
Labour hold Swing
Washington North [12]
PartyCandidateVotes%±
Labour Jill Fletcher1,34354.8
Liberal Democrat Paul Hillman45518.6
Conservative Russell Bloxsom35414.4
BNP David Laing29912.2
Majority88836.2
Turnout 2,45128.1-8.5
Labour hold Swing
Washington South [12]
PartyCandidateVotes%±
Labour Graeme Miller78630.9
Conservative Kathyrn Chamberlin75129.5
Liberal Democrat Robert Boyce72028.3
BNP Deborah Boyd29011.4
Majority351.4
Turnout 2,54730.9-6.0
Labour gain from Liberal Democrat Swing
Washington West [12]
PartyCandidateVotes%±
Labour Jean Stephenson1,40051.4
Liberal Democrat Irene Bannister58321.4
Conservative Olwyn Bird44816.5
BNP Frederick Donkin29210.7
Majority81730.0
Turnout 2,72330.5-7.0
Labour hold Swing

Related Research Articles

The 2003 Gateshead Council election was held on 1 May 2003 to elect members of Gateshead Council in Tyne and Wear, England. One third of the council was up for election and the Labour party kept overall control of the council.

The 2008 Derby City Council election took place on 1 May 2008 to elect members of Derby City Council in England. One third of the council was up for election and the council stayed under no overall control. Overall turnout was 34.6%.

2002 St Albans City and District Council election

The 2002 St Albans City and District Council election took place on 2 May 2002 to elect members of St Albans District Council in Hertfordshire, England. One third of the council was up for election and the council stayed under no overall control.

2006 St Albans City and District Council election

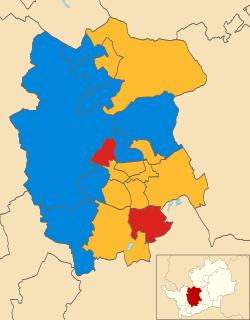
The 2006 St Albans City and District Council election took place on 4 May 2006 to elect members of St Albans District Council in Hertfordshire, England. One third of the council was up for election and the Liberal Democrats gained overall control of the council from no overall control.

2007 St Albans City and District Council election

The 2007 St Albans City and District Council election took place on 3 May 2007 to elect members of St Albans District Council in Hertfordshire, England. One third of the council was up for election and the Liberal Democrats lost overall control of the council to no overall control.

The 2000 Burnley Borough Council election took place on 4 May 2000 to elect members of Burnley Borough Council in Lancashire, England. One third of the council was up for election and the Labour party lost overall control of the council to no overall control.

2007 Winchester City Council election

The 2007 Winchester Council election took place on 3 May 2007 to elect members of Winchester District Council in Hampshire, England. One third of the council was up for election and the Conservative party stayed in overall control of the council.

The 2003 South Tyneside Metropolitan Borough Council election took place on 1 May 2003 to elect members of South Tyneside Metropolitan Borough Council in Tyne and Wear, England. One third of the council was up for election and the Labour party kept overall control of the council.

The 2004 South Tyneside Metropolitan Borough Council election took place on 10 June 2004 to elect members of South Tyneside Metropolitan Borough Council in Tyne and Wear, England. The whole council was up for election with boundary changes since the last election in 2003 reducing the number of seats by 6. The Labour party stayed in overall control of the council.

The 2006 South Tyneside Metropolitan Borough Council election took place on 4 May 2006 to elect members of South Tyneside Metropolitan Borough Council in Tyne and Wear, England. One third of the council was up for election and the Labour party stayed in overall control of the council.

2006 Solihull Metropolitan Borough Council election

The 2006 Solihull Metropolitan Borough Council election took place on 4 May 2006 to elect members of Solihull Metropolitan Borough Council in the West Midlands, England. One third of the council was up for election and the Conservative party stayed in overall control of the council.

The 2003 Sunderland Council election took place on 1 May 2003 to elect members of Sunderland Metropolitan Borough Council in Tyne and Wear, England. One third of the council was up for election and the Labour party stayed in overall control of the council.

2004 Sunderland City Council election

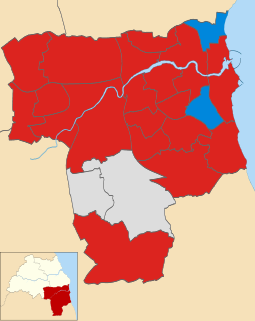
The 2004 Sunderland City Council election took place on 10 June 2004 to elect members of Sunderland City Council Council in Tyne and Wear, England. The whole council was up for election following boundary changes since the last election in 2003. The Labour party stayed in overall control of the council.

2007 Sunderland City Council election

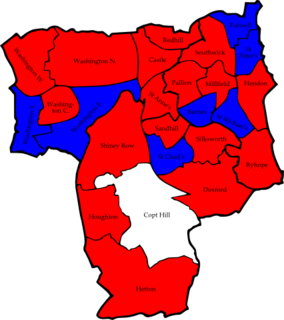
The 2007 Sunderland Council election took place on 3 May 2007 to elect members of Sunderland Metropolitan Borough Council in Tyne and Wear, England. One third of the council was up for election and the Labour party stayed in overall control of the council.

2008 Sunderland City Council election

The 2008 Sunderland Council election took place on 1 May 2008 to elect members of Sunderland Metropolitan Borough Council in Tyne and Wear, England. One third of the council was up for election and the Labour party stayed in overall control of the council.

2010 Sunderland City Council election

The 2010 Sunderland Council election took place on 6 May 2010 to elect members of Sunderland Metropolitan Borough Council in Tyne and Wear, England. One third of the council was up for election and the Labour party stayed in overall control of the council. The election took place on the same day as the 2010 General Election.

2011 Sunderland City Council election

The 2011 Sunderland Council election took place on 5 May 2011 to elect members of Sunderland Metropolitan Borough Council in Tyne and Wear, England. One third of the council was up for election and the Labour party stayed in overall control of the council.

2012 Sunderland City Council election

The 2012 Sunderland Council election took place on 3 May 2012 to elect members of Sunderland City Council in England. It was held on the same day as other United Kingdom local elections, 2012.

2018 Sunderland City Council election

The 2018 Sunderland City Council election took place on 3 May 2018 to elect members of Sunderland City Council in England. The election took place on the same day as other local elections.

References

  1. "Local elections: Sunderland". BBC News Online . Retrieved 2010-12-25.
  2. "Local elections 2006: Results in full". The Guardian. 2006-05-06. p. 20.
  3. 1 2 "Stakes are high in authorities around the North". The Journal. 2006-04-18. p. 8.
  4. Administrator, journallive (2006-08-10). "Councillor `treated like a pariah'". journallive. Retrieved 2018-07-02.
  5. Young, Peter (2006-04-04). "Tories miss election boat". Evening Chronicle. p. 6.
  6. 1 2 3 4 5 "Sunderland". The Journal. 2006-05-05. p. 4.
  7. "Cast your vote early". Evening Chronicle. 2006-04-11. p. 13.
  8. 1 2 "Lib Dems' grip on city strengthened". Evening Chronicle. 2006-05-05. p. 4.
  9. 1 2 "All smiles as Labour comes through unscathed". Sunderland Echo . 2006-05-05. Retrieved 2010-12-26.
  10. 1 2 "Labour keep control of Sunderland". BBC News Online . 2006-05-05. Retrieved 2010-12-26.
  11. "Councillor criticises his own party". The Journal. 2006-05-10. p. 15.
  12. 1 2 3 4 5 6 7 8 9 10 11 12 13 14 15 16 17 18 19 20 21 22 23 24 25 26 "Results of Poll". Sunderland City Council. Retrieved 2010-12-25.
  13. "Local elections". The Times. 2006-05-06. p. 64.
Preceded by
Sunderland City Council election, 2004
Sunderland City Council elections Succeeded by
Sunderland City Council election, 2007