Wigan Metropolitan Borough Council election, 2006

Last updated

Map of the results of the 2006 Wigan council election. Labour in red, Conservatives in blue, Community Action Party in green and Liberal Democrats in yellow. Wigan UK local election 2006 map.svg
Map of the results of the 2006 Wigan council election. Labour in red, Conservatives in blue, Community Action Party in green and Liberal Democrats in yellow.

Elections to Wigan Council were held on 4 May 2006. One-third of the council was up for election and the Labour party kept overall control of the council. [1] Overall turnout was 29.2%. [2] [3] [4]

Metropolitan Borough of Wigan Metropolitan borough in England

The Metropolitan Borough of Wigan is a metropolitan borough of Greater Manchester, in North West England. It is named after its largest component town and former county borough, Wigan and includes the towns and villages of Leigh, part of Ashton-in-Makerfield, Ince-in-Makerfield, Hindley, Orrell, Standish, Atherton, Tyldesley, Golborne, Lowton, Billinge, Astley, Haigh and Aspull. The borough was formed in 1974 and is an amalgamation of several former local government districts and parishes. The borough has three civil parishes and lies directly to the west of the City of Salford and southwest of the Metropolitan Borough of Bolton. The local authority is Wigan Metropolitan Borough Council.

The Labour Party is a centre-left political party in the United Kingdom that has been described as an alliance of social democrats, democratic socialists and trade unionists. The party's platform emphasises greater state intervention, social justice and strengthening workers' rights.

Contents

Election result

Wigan Local Election Result 2006
PartySeatsGainsLossesNet gain/lossSeats %Votes %Votes+/−
  Labour 14 3 2 +1 56.0 42.8 29,588 +0.8%
  Conservative 4 2 0 +2 16.0 21.7 15,014 +4.2%
  Community Action 4 0 3 -3 16.0 16.8 11,622 -7.9%
  Liberal Democrat 3 0 0 0 12.0 11.8 8,142 +1.3%
  BNP 0 0 0 0 0 2.8 1,948 +0.6%
  UKIP 0 0 0 0 0 1.6 1,105 +1.6%
  Independent 0 0 0 0 0 1.2 828 -0.5%
  Green 0 0 0 0 0 0.9 610 -0.5%
  Legalise Cannabis 0 0 0 0 0 0.1 91 +0.1%

This result had the following consequences for the total number of seats on the Council after the elections:

PartyPrevious councilNew council
Labour 42 43
Community Action 18 15
Conservative 7 9
Liberal Democrat 8 8
BNP 0 0
UKIP 0 0
Independent 0 0
Green 0 0
Legalise Cannabis 0 0
Total 75 75
Working majority 9  11 

Ward results

Abram [2] [3] [4]
PartyCandidateVotes%±
Labour Carl Sweeney 1,327 52.1 -6.0
Community Action John Shale 541 21.3 +21.3
BNP Dennis Shambley 421 16.5 -4.2
Conservative Marion Green 243 9.5 -10.5
Rejected ballots 13 0.5 -0.5
Majority 786 30.9 -6.4
Turnout 2,545 25.0 -6.6
Labour hold Swing -13.6
Ashton [2] [3] [4]
PartyCandidateVotes%±
Labour Nigel Ash 1,261 45.3 +13.5
Community Action Claire Daington 1,200 43.1 -14.7
Conservative Marie Winstanley 320 11.5 +1.7
Rejected ballots 0 0.0 -0.5
Majority 61 2.2 -23.8
Turnout 2,781 30.4 -14.2
Labour gain from Community Action Swing +14.1
Aspull, New Springs, Whelley [2] [3] [4]
PartyCandidateVotes%±
Liberal Democrat Jean Beswick 1,403 43.8 -1.5
Labour Michael McLoughlin 1,291 40.3 -11.8
Conservative Deborah Fairhurst 506 15.8 +15.8
Rejected ballots 0 0.0 -2.5
Majority 112 3.5 -3.3
Turnout 3,200 31.9 -2.7
Liberal Democrat hold Swing +5.1
Astley, Mosley Common [2] [3] [4]
PartyCandidateVotes%±
Liberal Democrat Joseph Haley 1,472 48.9 +12.7
Labour Alan Stephenson 865 28.7 -11.0
Conservative Sean Ell 674 22.4 +22.4
Rejected ballots 0 0.0 -1.0
Majority 607 20.2 +16.7
Turnout 3,011 31.1 -8.6
Liberal Democrat hold Swing +11.8
Atherleigh [2] [3] [4]
PartyCandidateVotes%±
Labour Anne Turnock 906 46.0 -2.4
Liberal Democrat Peter Bowdler 676 34.3 +34.3
Conservative Malcolm Parr 387 19.7 -3.5
Rejected ballots 0 0.0 -1.3
Majority 230 11.7 -9.6
Turnout 1,969 25.8 -7.9
Labour hold Swing -18.3
Atherton [2] [3] [4]
PartyCandidateVotes%±
Labour Karen Aldred 1,507 49.7 +12.3
Liberal Democrat Susan Wilson 960 31.7 -11.3
Conservative Rosina Oxley 331 10.9 -0.4
Green Nicholas Redmond 232 7.7 -0.1
Rejected ballots 0 0.0 -0.5
Majority 547 18.1 +12.6
Turnout 3,030 27.6 -8.7
Labour hold Swing +11.8
Bryn [2] [3] [4]
PartyCandidateVotes%±
Community Action Brian Merry 1,429 45.2 -15.0
Labour George Harrison 1,050 33.2 +1.9
BNP Kenneth Haslam 457 14.5 +14.5
Conservative William Winstanley 171 5.4 -2.8
New Party Duane Phillips 45 1.4 +1.4
Rejected ballots 7 0.2 -0.1
Majority 379 12.0 -16.9
Turnout 3,159 33.7 -8.6
Community Action hold Swing -8.4
Douglas [2] [3] [4]
PartyCandidateVotes%±
Labour Shirley Dewhurst 1,369 59.1 +7.8
Community Action Edna Hulme 933 40.3 -6.3
Rejected ballots 15 0.6 -1.5
Majority 436 18.8 +14.1
Turnout 2,317 24.7 -5.4
Labour hold Swing +7.0
Golborne and Lowton West [2] [3] [4]
PartyCandidateVotes%±
Labour Gerard Bretherton 1,410 52.0 +12.9
Community Action Peter Solinas 953 35.2 -14.3
Conservative Jeanette Leigh 347 12.8 +2.1
Rejected ballots 0 0.0 -0.7
Majority 457 16.9 +6.6
Turnout 2,710 30.7 -7.6
Labour gain from Community Action Swing +13.6
Hindley [2] [3] [4]
PartyCandidateVotes%±
Labour James Talbot 1,217 48.4 +9.2
Community Action Debbie Grace 913 36.3 +7.7
Conservative Joan Pietre 387 15.4 +5.4
Rejected ballots 0 0.0 -0.6
Majority 304 12.1 +1.6
Turnout 2,517 25.6 -19.5
Labour gain from Community Action Swing +0.7
Hindley Green [2] [3] [4]
PartyCandidateVotes%±
Community Action Barry Fagan 1,100 47.4 +12.6
Labour John Holland 832 35.9 +0.8
Conservative Denise Young 388 16.7 +3.3
Rejected ballots 0 0.0 -0.7
Majority 268 11.6 +11.4
Turnout 2,320 25.9 -16.2
Community Action hold Swing +5.9
Ince [2] [3] [4]
PartyCandidateVotes%±
Labour James Moodie 1,279 60.7 -5.8
Community Action Syd Hall 639 30.3 -0.5
Conservative Alicia Eccles 173 8.2 +8.2
Rejected ballots 15 0.7 -1.9
Majority 640 30.4 -5.2
Turnout 2,106 24.6 -1.8
Labour hold Swing -2.6
Leigh East [2] [3] [4]
PartyCandidateVotes%±
Labour Fred Walker 1,120 46.1 -0.5
Liberal Democrat Gordon Jackson 912 37.5 +37.5
Conservative Dorothy Angell 399 16.4 -4.9
Rejected ballots 0 0.0 -1.0
Majority 208 8.6 -6.7
Turnout 2,431 26.8 -7.3
Labour hold Swing -19.0
Leigh South [2] [3] [4]
PartyCandidateVotes%±
Labour Charles Rigby 1,273 39.8 -0.8
Conservative Andrew Oxley 763 23.9 -3.2
Community Action Stephen Ellison 621 19.4 -11.4
BNP Richard Close 448 14.0 +14.0
Legalise Cannabis Thomas Hampson 91 2.8 +2.8
Rejected ballots 0 0.0 -1.4
Majority 510 16.0 +6.2
Turnout 3,196 30.7 -6.6
Labour hold Swing +1.2
Leigh West [2] [3] [4]
PartyCandidateVotes%±
Labour Peter Smith 1,377 54.9 -3.2
Liberal Democrat Kevin Jones 721 28.7 +28.7
Conservative Alan Lowe 410 16.3 +16.3
Rejected ballots 0 0.0 -1.7
Majority 656 26.2 -9.1
Turnout 2,508 23.4 -4.3
Labour hold Swing -15.9
Lowton East [2] [3] [4]
PartyCandidateVotes%±
Community Action Edward Houlton 1,075 34.1 -10.4
Conservative James Grundy 1,041 33.0 +11.2
Labour Trevor Ward 1,034 32.8 +0.8
Rejected ballots 0 0.0 -1.6
Majority 34 1.1 -11.4
Turnout 3,150 32.2 -8.7
Community Action hold Swing -10.8
Orrell [2] [3] [4]
PartyCandidateVotes%±
Conservative Peter Thompson 1,308 38.4 -1.0
Labour Michael Barnes 1,266 37.2 +5.6
BNP Charles Mather 622 18.3 +3.1
UKIP Stephen Hawkins 208 6.1 +6.1
Rejected ballots 0 0.0 -0.4
Majority 42 1.2 -6.6
Turnout 3,404 37.1 -12.4
Conservative gain from Labour Swing -3.3
Pemberton [2] [3] [4]
PartyCandidateVotes%±
Labour Paul Prescott 1,452 64.8 +18.0
Community Action Robert Beale 320 14.3 -23.3
Liberal Democrat Darren Atherton 281 12.5 +12.5
UKIP Aspey David 189 8.4 +8.4
Rejected ballots 0 0.0 -1.3
Majority 1,132 50.5 +41.3
Turnout 2,242 22.7 -8.4
Labour hold Swing +20.6
Shevington with Lower Ground [2] [3] [4]
PartyCandidateVotes%±
Conservative Angela Bland 1,827 57.4 +21.6
Labour Michael Crosby 1,311 41.2 -4.1
Rejected ballots 46 1.4 +0.7
Majority 516 16.2 +6.7
Turnout 3,184 33.8 -10.2
Conservative gain from Labour Swing +12.8
Standish with Langtree [2] [3] [4]
PartyCandidateVotes%±
Conservative Neil Whittingham 1,866 54.8 +21.6
Labour Diana Davies 1,029 30.2 -4.4
UKIP Gregory Atherton 493 14.5 +14.5
Rejected ballots 17 0.5 -0.2
Majority 837 24.6 +23.1
Turnout 3,405 36.0 -6.5
Conservative hold Swing +13.0
Tyldesley [2] [3] [4]
PartyCandidateVotes%±
Liberal Democrat Richard Derricutt 1,717 58.7 +4.0
Labour Pamela Stewart 565 19.3 -14.1
Green Craig Cohen 378 12.9 +12.9
Conservative Hilary Hayden 266 9.1 -2.2
Rejected ballots 0 0.0 -0.6
Majority 1,152 39.4 +18.1
Turnout 2,926 28.9 -11.2
Liberal Democrat hold Swing +9.0
Wigan Central [2] [3] [4]
PartyCandidateVotes%±
Conservative Gareth Fairhurst 1,905 60.0 +5.9
Labour Marcia Dooley 1,270 40.0 -3.0
Rejected ballots 0 0.0 -2.9
Majority 635 20.0 +8.9
Turnout 3,175 34.6 -8.6
Conservative hold Swing +4.4
Wigan West [2] [3] [4]
PartyCandidateVotes%±
Labour Joe Shaw 1,354 49.0N/A
Independent Philip Parkes 783 28.3N/A
Conservative Keith Jones 613 22.2N/A
Rejected ballots 16 0.6N/A
Majority 571 20.6N/A
Turnout 2,766 27.0N/A
Labour hold Swing N/A
Winstanley [2] [3] [4]
PartyCandidateVotes%±
Community Action William Wilkes 1,160 43.5 -4.9
Labour Philip Kelly 905 33.9 -3.3
Conservative Charles Cartwright 382 14.3 +0.3
UKIP Alan Freeman 215 8.1 +8.1
Rejected ballots 7 0.3 -0.2
Majority 255 9.6 -1.5
Turnout 2,669 30.1 -12.5
Community Action hold Swing -0.8
Worsley Mesnes [2] [3] [4]
PartyCandidateVotes%±
Labour Patricia Holland 1,318 55.4 +6.6
Community Action Leanne Brotherton 738 31.0 -6.0
Conservative Thomas Sutton 307 12.9 -0.5
Rejected ballots 15 0.6 -0.1
Majority 580 24.4 +12.5
Turnout 2,378 26.0 -10.0
Labour hold Swing +6.3

Related Research Articles

2000 Wigan Metropolitan Borough Council election

Elections to Wigan Council were held on 4 May 2000. One-third of the council was up for election, as well as an extra vacancy in Norley - both of which were uncontested. Since the election, there had been a by-election in which the Liberal Democrats gained the seat being fought in Hindsford from Labour.

2002 Wigan Metropolitan Borough Council election

Elections to Wigan Council were held on 2 May 2002, with one-third of the council to be re-elected. There had been a number of by-elections in the gap year, with a Labour gain from the Liberal Democrats in Hindsford, effectively cancelling out an earlier loss to them in Atherton. A Labour hold in Hope Carr in-between left both parties unchanged going into the election.

2003 Wigan Metropolitan Borough Council election

Elections to Wigan Council were held on 1 May 2003 with one-third of the council was up for election. Prior to the election, there had been two vacancies in Leigh Central, with Labour winning a by-election in June and the seat being fought in this election filled unopposed by Barbara Jarvis.

2004 Wigan Metropolitan Borough Council election

Elections to Wigan Council were held on 10 June 2004. The whole council was up for election with boundary changes since the last election in 2003 increasing the number of councillors by three. The Labour party kept overall control of the council.

1998 Barnsley Metropolitan Borough Council election

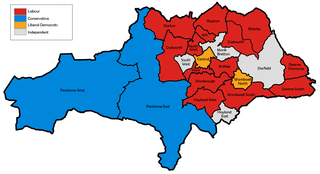
Elections to Barnsley Metropolitan Borough Council were held on 7 May 1998. One third of the council was up for election and the Labour party kept overall control of the council.

2008 Wigan Metropolitan Borough Council election

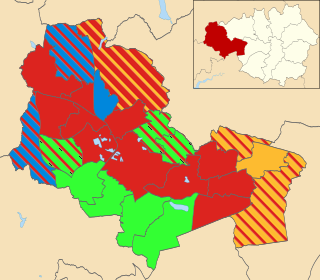
Elections to Wigan Council were held on 1 May 2008. One-third of the council was up for election.

2000 Barnsley Metropolitan Borough Council election

The 2000 Barnsley Metropolitan Borough Council election took place on 4 May 2000 to elect members of Barnsley Metropolitan Borough Council in South Yorkshire, England. Prior to the election, Labour has suffered a by-election loss in South West and two defections to Independent. One third of the council was up for election and the Labour party stayed in overall control of the council.

2002 Barnsley Metropolitan Borough Council election

The 2002 Barnsley Metropolitan Borough Council election took place on 2 May 2002 to elect members of Barnsley Metropolitan Borough Council in South Yorkshire, England. One third of the council was up for election and the Labour party stayed in overall control of the council.

2003 Barnsley Metropolitan Borough Council election

The 2003 Barnsley Metropolitan Borough Council election took place on 1 May 2003 to elect members of Barnsley Metropolitan Borough Council in South Yorkshire, England. One third of the council was up for election and the Labour party stayed in overall control of the council.

2006 Barnsley Metropolitan Borough Council election

The 2006 Barnsley Metropolitan Borough Council election took place on 4 May 2006 to elect members of Barnsley Metropolitan Borough Council in South Yorkshire, England. One third of the council was up for election, with an extra vacancy in Penistone East caused by a resignation, and the Labour party stayed in overall control of the council.

1973 Wigan Metropolitan Borough Council election

The 1973 Wigan Council elections for the First Wigan Metropolitan Borough Council were held on 10 May 1973, with the entirety of the 72 seat council - three seats for each of the 24 wards - up for vote. It was the first council election as the newly formed metropolitan borough under a new constitution. The Local Government Act 1972 stipulated that the elected members were to shadow and eventually take over from the predecessor corporation on 1 April 1974. The order in which the councillors were elected dictated their term serving, with third-place candidates serving two years and up for re-election in 1975, second-placed three years expiring in 1976 and 1st-placed five years until 1978.

1975 Wigan Metropolitan Borough Council election

Elections to Wigan Council were held on 1 May 1975, with one third of the council up for the election - although only 21 seats were contested, as Labour were unopposed in Ward 12, 21 and 24. Labour suffered six losses on the night - five to the Conservatives and one to the Liberals - with a gain from the sole Independent in Ward 23 as consolation. Overall turnout fell by nearly a quarter, to 27%.

2007 Wigan Metropolitan Borough Council election

Elections to Wigan Council were held on 3 May 2007 with one third of the seats up for election.

2010 Wigan Metropolitan Borough Council election

Elections to Wigan Council were held on 6 May 2010. One-third of the council was up for election.

2011 Wigan Metropolitan Borough Council election

Elections to Wigan Council were held in May 2011. One-third of the council was up for election. These elections were held as part of the United Kingdom local elections, 2011.

1982 Wigan Metropolitan Borough Council election

Elections to the Wigan Council were held on Thursday, 6 May 1982, with one third of the council up for election. The newly formed Alliance made three gains, replacing the Conservatives as the main opposition to Labour. The Alliance massively increased upon the Liberals' past participation, contesting every ward, in marked contrast to a year in which candidate variety fell to a low, with only the former Labour councillor, standing again as Independent Labour in Hindley ward, not representing the three aforementioned choices. Overall turnout was down 2.6% to 33.6%.

1983 Wigan Metropolitan Borough Council election

Elections to the Wigan Council were held on Thursday, 5 May 1983, with one third of the council up for election. The election seen only the main three parties contesting for the first time and one gain in Tyldesley East with Alliance winning their seventh seat from Labour. The Conservatives, contesting a low of seventeen wards, managed their lowest voter share since the council's creation. Overall turnout rose to a relative high of 39.1%.

1984 Wigan Metropolitan Borough Council election

Elections to the Wigan council were held on Thursday, 3 May 1984, with one third of the seats up for vote. Three wards – Abram, Hindley and Lightshaw – were unopposed, leaving only twenty one of the twenty four wards going to vote – a number not seen since 1975. Also of note was the re-emergence of a fourth party, in the way of persistent Communist candidate H. Kedward contesting Leigh Central after a three-year absence. The election itself seen a Labour gain in Orrell from the Conservatives, which cancelled out the simultaneous Alliance gain from Labour in Aspell-Standish, leaving their majority unchanged. Overall turnout slumped to 29.2%, the lowest level since the aforementioned 1975 election.

2006 Leeds City Council election

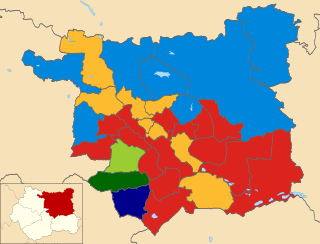
The Leeds City Council election took place on 4 May 2006 to elect members of City of Leeds Metropolitan Borough Council in West Yorkshire, England. One third of the council was up for election with the council remaining under no overall control. Overall turnout was 35.9%

References