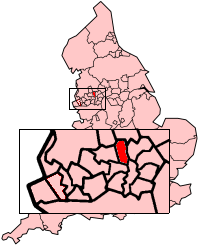
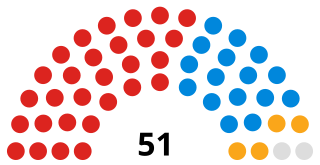
Elections to Bury Metropolitan Borough Council were held on 3 May 2007. One third of the council was up for election, and the council remained in No Overall Control, with the Conservative Party overtaking the Labour Party as the largest group.
Bury Metropolitan Borough Council is the local authority of the Metropolitan Borough of Bury in Greater Manchester, England. It is a metropolitan district council, one of ten in Greater Manchester and one of 36 in the metropolitan counties of England. It provides the majority of local government services in Bury.
The Conservative Party, officially the Conservative and Unionist Party, is a centre-right political party in the United Kingdom. Presently led by Theresa May, it has been the governing party since 2010. It presently has 314 Members of Parliament in the House of Commons, 249 members of the House of Lords, and 18 members of the European Parliament. It also has 31 Members of the Scottish Parliament, 12 members of the Welsh Assembly, eight members of the London Assembly and 9,008 local councillors. One of the major parties of UK politics, it has formed the government on 45 occasions, more than any other party.
The Labour Party is a centre-left political party in the United Kingdom which has been described as an alliance of social democrats, democratic socialists and trade unionists. The party's platform emphasises greater state intervention, social justice and strengthening workers' rights.
After the election, the composition of the council was
Party | Seats | Gains | Losses | Net gain/loss | Seats % | Votes % | Votes | +/− | |
---|---|---|---|---|---|---|---|---|---|
Conservative | 7 | 1 | 0 | +1 | 41.4 | 22,078 | -0.6 | ||
Labour | 7 | 0 | 3 | -3 | 33.9 | 18,110 | +0.1 | ||
Liberal Democrat | 3 | 1 | 0 | +1 | 18.4 | 9,814 | -3.2 | ||
BNP | 5.9 | 3,162 | +5.9 | ||||||
Independent | 0.3 | 180 | -2.2 | ||||||
Party | Candidate | Votes | % | ± | |
---|---|---|---|---|---|
Labour | Alan Matthews | 1,138 | 47.5 | +0.0 | |
Conservative | Valerie Morris | 829 | 34.6 | +8.5 | |
Liberal Democrat | Fiona Davison | 431 | 18.0 | +0.7 | |
Majority | 309 | 12.9 | -8.4 | ||
Turnout | 2,398 | ||||
Labour hold | Swing | ||||
Party | Candidate | Votes | % | ± | |
---|---|---|---|---|---|
Conservative | Jack Walton | 2,032 | 55.3 | -2.5 | |
Labour | Ben Shatliff | 898 | 24.4 | +0.5 | |
Liberal Democrat | Gaynor Clarkson | 386 | 10.5 | -7.8 | |
BNP | Julie Kay | 359 | 9.8 | +9.8 | |
Majority | 1,134 | 30.9 | -8.0 | ||
Turnout | 3,675 | ||||
Conservative hold | Swing | ||||
Party | Candidate | Votes | % | ± | |
---|---|---|---|---|---|
Labour | Michael Connolly | 1,216 | 49.7 | -3.2 | |
Conservative | Azmat Husain | 753 | 30.8 | +1.3 | |
Liberal Democrat | Nissa Finney | 296 | 12.1 | -6.5 | |
Independent | Ron Miles | 180 | 7.4 | +7.4 | |
Majority | 463 | 18.9 | -4.5 | ||
Turnout | 2,445 | ||||
Labour hold | Swing | ||||
Party | Candidate | Votes | % | ± | |
---|---|---|---|---|---|
Conservative | Denise Bigg | 1,555 | 52.3 | +4.6 | |
Labour | Steven Treadgold | 936 | 31.5 | -2.2 | |
Liberal Democrat | Robert Sloss | 485 | 16.3 | -3.3 | |
Majority | 619 | 20.8 | +6.8 | ||
Turnout | 2,976 | ||||
Conservative hold | Swing | ||||
Party | Candidate | Votes | % | ± | |
---|---|---|---|---|---|
Liberal Democrat | Wilf Davison | 1,661 | 54.6 | +2.6 | |
Labour | Alan Quinn | 698 | 23.0 | -0.1 | |
Conservative | Marilyn Vincent | 681 | 22.4 | -2.6 | |
Majority | 963 | 31.7 | +4.7 | ||
Turnout | 3,040 | ||||
Liberal Democrat hold | Swing | ||||
Party | Candidate | Votes | % | ± | |
---|---|---|---|---|---|
Labour | Keith Rothwell | 1,230 | 39.1 | +3.7 | |
Conservative | Angela Crane | 1,077 | 34.2 | -6.0 | |
Liberal Democrat | Victor Hagan | 505 | 16.0 | -8.4 | |
BNP | Phillip Sedman | 336 | 10.7 | +10.7 | |
Majority | 153 | 4.9 | |||
Turnout | 3,148 | ||||
Labour hold | Swing | ||||
Party | Candidate | Votes | % | ± | |
---|---|---|---|---|---|
Conservative | David Higgin | 2,411 | 62.7 | +0.8 | |
Labour | Roy Hardy | 753 | 19.6 | +1.0 | |
Liberal Democrat | Ewan Arthur | 498 | 12.9 | -6.6 | |
BNP | Jonathan Barbour | 184 | 4.8 | +4.8 | |
Majority | 1,658 | 43.1 | +0.7 | ||
Turnout | 3,846 | ||||
Conservative hold | Swing | ||||
Party | Candidate | Votes | % | ± | |
---|---|---|---|---|---|
Conservative | Peter Redstone | 1,828 | 61.3 | -0.4 | |
Labour | Steve Perkins | 793 | 26.6 | -2.9 | |
Liberal Democrat | Maureen Davison | 362 | 12.1 | +3.3 | |
Majority | 1,035 | 34.7 | +2.4 | ||
Turnout | 2,983 | ||||
Conservative hold | Swing | ||||
Party | Candidate | Votes | % | ± | |
---|---|---|---|---|---|
Labour | Siobhan Costello | 1,077 | 35.8 | -0.5 | |
Conservative | Mat Hague | 972 | 32.3 | -6.5 | |
BNP | Tom Rosser | 586 | 19.5 | +19.5 | |
Liberal Democrat | Michael Halsall | 377 | 12.5 | -4.9 | |
Majority | 105 | 3.5 | |||
Turnout | 3,012 | ||||
Labour hold | Swing | ||||
Party | Candidate | Votes | % | ± | |
---|---|---|---|---|---|
Conservative | Stuart Penketh | 1,452 | 40.8 | -0.9 | |
Labour | Daisy Johnston | 1,373 | 38.6 | -3.6 | |
BNP | Peter Hallows | 477 | 13.4 | +13.4 | |
Liberal Democrat | Emma Davison | 259 | 7.3 | -3.5 | |
Majority | 79 | 2.2 | |||
Turnout | 3,561 | ||||
Conservative gain from Labour | Swing | ||||
Party | Candidate | Votes | % | ± | |
---|---|---|---|---|---|
Labour | Tony Cummings | 1,299 | 50.3 | -4.6 | |
Conservative | Bernard Slingsby | 582 | 22.6 | -9.0 | |
BNP | Jean Purdy | 503 | 19.5 | +19.5 | |
Liberal Democrat | Mary D'Albert | 196 | 7.6 | +7.6 | |
Majority | 717 | 27.8 | +4.5 | ||
Turnout | 2,580 | ||||
Labour hold | Swing | ||||
Party | Candidate | Votes | % | ± | |
---|---|---|---|---|---|
Conservative | Sheila Magnall | 1,766 | 55.7 | -0.6 | |
Labour | Val Robinson | 1,007 | 31.8 | +1.8 | |
Liberal Democrat | Janet Turner | 398 | 12.6 | -0.7 | |
Majority | 759 | 23.9 | -2.3 | ||
Turnout | 3,171 | ||||
Conservative hold | Swing | ||||
Party | Candidate | Votes | % | ± | |
---|---|---|---|---|---|
Labour | John Smith | 1,172 | 37.1 | -0.4 | |
Conservative | Ijaz Ahmed | 1,074 | 34.0 | -1.8 | |
Liberal Democrat | Bill Brison | 454 | 17.2 | -9.5 | |
BNP | Eric Marshall | 372 | 11.8 | +11.8 | |
Majority | 98 | 3.1 | +1.5 | ||
Turnout | 3,163 | ||||
Labour hold | Swing | ||||
Party | Candidate | Votes | % | ± | |
---|---|---|---|---|---|
Liberal Democrat | Richard Baum | 1,424 | 43.0 | +1.0 | |
Labour | Keith Grime | 1,102 | 33.2 | +5.0 | |
Conservative | Stephen Morris | 789 | 23.8 | +0.9 | |
Majority | 322 | 9.7 | -4.1 | ||
Turnout | 3,315 | ||||
Liberal Democrat gain from Labour | Swing | ||||
Party | Candidate | Votes | % | ± | |
---|---|---|---|---|---|
Liberal Democrat | Steven Wright | 1,402 | 38.2 | -0.9 | |
Conservative | Jonathan Grosskopf | 1,148 | 31.2 | +2.7 | |
Labour | Gill Campbell | 1,124 | 30.6 | -1.8 | |
Majority | 254 | 6.9 | +0.2 | ||
Turnout | 3,674 | ||||
Liberal Democrat gain from Labour | Swing | ||||
Party | Candidate | Votes | % | ± | |
---|---|---|---|---|---|
Conservative | Ivonne Wright | 1,565 | 52.3 | -4.9 | |
Labour | Jane Lewis | 726 | 24.3 | -1.3 | |
Liberal Democrat | David Foss | 354 | 11.8 | -5.4 | |
BNP | Stewart Clough | 345 | 11.5 | +11.5 | |
Majority | 839 | 28.1 | -3.5 | ||
Turnout | 2,990 | ||||
Conservative hold | Swing | ||||
Party | Candidate | Votes | % | ± | |
---|---|---|---|---|---|
Labour | Joan Grimshaw | 1,568 | 46.6 | +6.1 | |
Conservative | Nicola Arnold | 1,564 | 46.5 | +4.0 | |
Liberal Democrat | Theodor Tymczyna | 235 | 7.0 | -5.2 | |
Majority | 4 | 0.1 | |||
Turnout | 3,367 | ||||
Labour hold | Swing | ||||
The 2003 West Lancashire District Council election took place on 1 May 2003 to elect members of West Lancashire District Council in Lancashire, England. One third of the council was up for election and the Conservative party stayed in overall control of the council.
The 1998 Tamworth Borough Council election took place on 7 May 1998 to elect members of Tamworth District Council in Staffordshire, England. One third of the council was up for election and the Labour party stayed in overall control of the council.
Elections to Preston City Council took place on 1 May 2008.
Elections to Calderdale Metropolitan Borough Council were held on 1 May 2008. One third of the council was up for election and the council stayed under no overall control with a minority Conservative administration.
The 2010 West Lancashire Borough Council election took place on 6 May 2010 to elect members of West Lancashire Borough Council in Lancashire, England. One third of the council was up for election and the Conservative party stayed in overall control of the council.
The 2010 Pendle Borough Council election took place on 6 May 2010 to elect members of Pendle Borough Council in Lancashire, England. One third of the council was up for election and the council stayed under no overall control.
The 2008 Sandwell Metropolitan Borough Council election took place on 1 May 2008 to elect members of Sandwell Metropolitan Borough Council in the West Midlands, England. One third of the council was up for election and the Labour party stayed in overall control of the council.
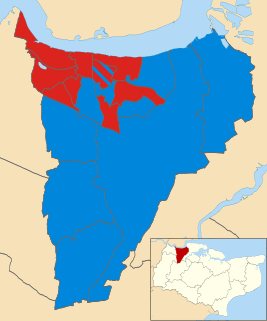
The 2011 Gravesham Borough Council election took place on 5 May 2011 to elect members of Gravesham Borough Council in Kent, England. The whole council was up for election and the Labour party gained overall control of the council from the Conservative party.
The 2012 Calderdale Metropolitan Borough Council election took place on 3 May 2012 to elect members of Calderdale Metropolitan Borough Council in West Yorkshire, England. This was on the same day as other United Kingdom local elections, 2012. After the election the council continued to have no overall control and continue to be run by a coalition between the Labour Party and the Liberal Democrats.
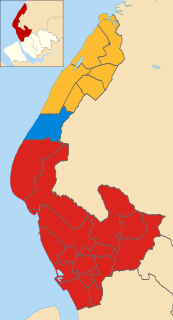
The 2012 Sefton Metropolitan Borough Council election took on 3 May 2012 to elect members of Sefton Metropolitan Borough Council in England, as part of the United Kingdom local elections, 2012. 22 seats, representing one third of the total Council membership, were up for election in single-member wards. Ten - nearly half - of the members elected were newcomers to the Council; five of these defeated sitting Councillors seeking re-election, whilst in the other five wards, the incumbent retired. Two incumbents stood under different labels to those they were elected under in 2008; both were defeated in their wards.
The 2012 Plymouth City Council election took place on 3 May 2012 to elect members of Plymouth City Council in England. This was on the same day as other local elections. The election was won by the Labour Party, who gained control of the council from the Conservative Party.
The 2012 St Albans City and District Council election took place on 3 May 2012 to elect members of St Albans District Council in Hertfordshire, England. One third of the council was up for election and the council stayed under no overall control.
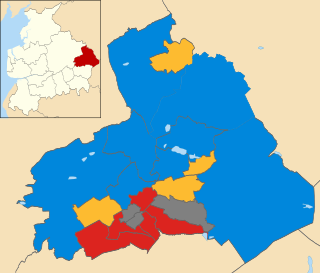
The 2011 Pendle Borough Council election took place on 5 May 2011 to elect members of Pendle Borough Council in Lancashire, England. One third of the council was up for election and the council stayed under no overall control.
The 2012 Harlow District Council election took place on 3 May 2012 to elect members of Harlow District Council in Essex, England. One third of the council was up for election and the Labour party gained overall control of the council from the Conservative party.
The 2014 Harlow District Council election took place on 22 May 2014 to elect members of Harlow District Council in Essex, England. One third of the council was up for election and the Labour party stayed in overall control of the council.
The 2014 Brent London Borough Council election took place on 22 May 2014 to elect members of Brent London Borough Council in London, England. The whole council was up for election and the Labour Party stayed in overall control of the council.
The 2015 Calderdale Metropolitan Borough Council election took place on 7 May 2015 to elect members of Calderdale in England. This was on the same day as other local elections and a general election. One councillor was elected in each ward for a four-year term so the councillors elected in 2015 last stood for election in 2011. Each ward is represented by three councillors, the election of which is staggered, so only one third of the councillors were elected in this election. Before the election there was no overall control with a minority Labour administration which was over-ruled at a Budget vote by a coalition of Conservatives & Liberal Democrats leading to a Conservative minority administration. After the election there was still no overall control & a Labour minority administration was formed again.
Elections for the London Borough of Merton were held on 4 May 1978 to elect members of Merton London Borough Council in London, England. This was on the same day as other local elections in England and Scotland.
Elections for the London Borough of Merton were held on 6 May 1982 to elect members of Merton London Borough Council in London, England. This was on the same day as other local elections in England and Scotland.
An election to the County Council of London took place on 7 April 1949. The council was elected by First Past the Post with each elector having three votes in the three-member seats. The Conservative Party made substantial gains, achieving the same number of seats as the Labour Party. However, Labour held the chair of the council, and was thus able to retain control.