The 2015 Bury Metropolitan Borough Council took place on 7 May 2015 to elect members of the Metropolitan Borough of Bury in England. [1] This was on the same day as other local elections. [2]
The Metropolitan Borough of Bury is a metropolitan borough of Greater Manchester in North West England, just north of Manchester, which consists of six towns: Bury, Ramsbottom, Tottington, Radcliffe, Whitefield and Prestwich. Bury bounds the Lancashire districts of Rossendale and Blackburn with Darwen to the north.
17 seats were contested. The Labour Party won 10 seats, the Conservatives won 6 seats, and the Liberal Democrats won 1 seat.
After the election, the total composition of the council was as follows:
The Labour Party is a centre-left political party in the United Kingdom which has been described as an alliance of social democrats, democratic socialists and trade unionists. The party's platform emphasises greater state intervention, social justice and strengthening workers' rights.
The Conservative Party, officially the Conservative and Unionist Party, is a centre-right political party in the United Kingdom. Presently led by Theresa May, it has been the governing party since 2010. It presently has 314 Members of Parliament in the House of Commons, 249 members of the House of Lords, and 18 members of the European Parliament. It also has 31 Members of the Scottish Parliament, 12 members of the Welsh Assembly, eight members of the London Assembly and 9,008 local councillors. One of the major parties of UK politics, it has formed the government on 45 occasions, more than any other party.
The Liberal Democrats are a liberal political party in the United Kingdom. They presently have 11 Members of Parliament in the House of Commons, 96 members of the House of Lords, and one member of the European Parliament. They also have five Members of the Scottish Parliament and a member each in the Welsh Assembly and London Assembly. The party reached the height of its influence in the early 2010s, forming a junior partner in a coalition government from 2010 to 2015. It is presently led by Vince Cable.
Party | Seats | Gains | Losses | Net gain/loss | Seats % | Votes % | Votes | +/− | |
---|---|---|---|---|---|---|---|---|---|
Labour | 10 | 1 | 2 | -1 | 40.3 | 37,842 | -1.7 | ||
Conservative | 6 | 1 | 0 | +1 | 33.3 | 31,269 | +1.1 | ||
UKIP | 0 | 0 | 0 | 14.4 | 13,553 | +3.6 | |||
Liberal Democrat | 2 | 1 | 0 | +1 | 7.0 | 6,557 | -1.0 | ||
Green | 0 | 0 | 0 | 0 | 0 | 4.5 | 4,253 | -1.5 | |
English Democrat | 0 | 0 | 0 | 0 | 0 | 0.1 | 67 | -0.8 | |
Independent | 0 | 0 | 1 | -1 | 0 | 0.3 | 290 | +0.3 | |
Party | Candidate | Votes | % | ± | |
---|---|---|---|---|---|
Labour | Alan Matthews | 2,628 | 44.7 | -7.7 | |
Conservative | Guy Levy | 1,114 | 18.9 | -0.2 | |
Liberal Democrat | Steve Middleton | 1,098 | 18.7 | +13.6 | |
UKIP | Phillip Husband | 799 | 13.6 | +13.6 | |
Green | Zarrin Shannon | 177 | 3.0 | -3.9 | |
English Democrat | Stephen Morris | 67 | 1.1 | -15.3 | |
Majority | 1114 | 25.7 | -7.6 | ||
Turnout | 5,883 | 60.2 | +29.7 | ||
Labour hold | Swing | ||||
Party | Candidate | Votes | % | ± | |
---|---|---|---|---|---|
Conservative | Jackie Harris | 2,933 | 48.2 | -6.2 | |
Labour | Andrew McAnulty | 1,997 | 32.8 | -1.2 | |
UKIP | Bernard Hagan | 788 | 13.0 | +13.0 | |
Green | Reece Spencer | 193 | 3.2 | -5.4 | |
Liberal Democrat | Lynda Arthur | 167 | 2.7 | -0.2 | |
Majority | 936 | 15.4 | -5.0 | ||
Turnout | 6,078 | 71.8 | +29.2 | ||
Conservative hold | Swing | ||||
Party | Candidate | Votes | % | ± | |
---|---|---|---|---|---|
Labour | Mike Connolly | 2,748 | 60.0 | +4.6 | |
UKIP | John Axon | 853 | 18.6 | -6.7 | |
Conservative | Sham Akhtar | 762 | 16.6 | +2.4 | |
Green | Paul Jenkins | 220 | 4.8 | -0.3 | |
Majority | 1,895 | 41.3 | +11.2 | ||
Turnout | 4,583 | 56.7 | +23.5 | ||
Labour hold | Swing | ||||
Party | Candidate | Votes | % | ± | |
---|---|---|---|---|---|
Conservative | Michael Hankey | 2,334 | 40.2 | +6.7 | |
Labour | Martin Hayes | 2,270 | 39.1 | +3.1 | |
UKIP | Walter Southworth | 864 | 14.9 | -7.7 | |
Green | Julie Southworth | 191 | 3.3 | -1.6 | |
Liberal Democrat | Benjamin Ward | 146 | 2.5 | -0.4 | |
Majority | 64 | 1.1 | |||
Turnout | 5,805 | 65.9 | +28.8 | ||
Conservative gain from Labour | Swing | ||||
Party | Candidate | Votes | % | ± | |
---|---|---|---|---|---|
Liberal Democrat | Mary D'Albert | 2,112 | 35.6 | -14.8 | |
Labour | Geraldine Greene | 2,066 | 34.9 | -5.2 | |
Conservative | Katy Rothwell | 784 | 13.2 | +4.4 | |
UKIP | Michael Zwierzanski | 623 | 10.5 | +10.5 | |
Green | Peter Curati | 340 | 5.7 | +5.7 | |
Majority | 46 | 0.8 | |||
Turnout | 5,925 | 67.0 | +25.3 | ||
Liberal Democrat gain from Labour | Swing | ||||
Party | Candidate | Votes | % | ± | |
---|---|---|---|---|---|
Labour | Sarah Southworth | 2,535 | 50.4 | -1.6 | |
Conservative | Nabila Afilal | 1,253 | 24.9 | +8.6 | |
UKIP | Victor Hagan | 994 | 19.8 | -6.5 | |
Green | Larissa Heath | 248 | 4.9 | -0.5 | |
Majority | 1,282 | 25.5 | -0.2 | ||
Turnout | 5,030 | 57.9 | +25.8 | ||
Labour hold | Swing | ||||
Party | Candidate | Votes | % | ± | |
---|---|---|---|---|---|
Conservative | Khalid Hussain | 3,087 | 49.0 | -1.3 | |
Labour | Steven Treadgold | 1,721 | 27.3 | +4.2 | |
UKIP | Tanya Kay | 790 | 12.5 | -4.0 | |
Green | Mary Heath | 356 | 5.6 | -0.6 | |
Liberal Democrat | Ewan Arthur | 344 | 5.5 | +1.6 | |
Majority | 1,366 | 21.7 | -5.6 | ||
Turnout | 6,298 | 75.0 | +31.2 | ||
Conservative hold | Swing | ||||
Party | Candidate | Votes | % | ± | |
---|---|---|---|---|---|
Conservative | Robert Caserta | 2,632 | 49.9 | +10.7 | |
Labour | Debra Green | 1,872 | 35.5 | -4.4 | |
UKIP | John Parkinson | 507 | 9.6 | -3.8 | |
Green | Zachery Garsia | 262 | 5.0 | +1.0 | |
Majority | 760 | 14.4 | |||
Turnout | 5,273 | 68.6 | +29.9 | ||
Conservative hold | Swing | ||||
Party | Candidate | Votes | % | ± | |
---|---|---|---|---|---|
Labour | Catherine Preston | 1,837 | 37.7 | -13.8 | |
Conservative | Greg Keeley | 1,285 | 26.4 | -3.8 | |
UKIP | Russell Turner | 1,012 | 20.8 | +20.8 | |
Independent | Matt Bailey | 290 | 5.9 | +5.9 | |
Green | Nicole Haydock | 239 | 4.9 | -9.7 | |
Liberal Democrat | Robert Graham | 205 | 4.2 | +0.5 | |
Majority | 602 | 12.3 | -8.9 | ||
Turnout | 4,868 | 56.9 | +26.9 | ||
Labour gain from Independent | Swing | ||||
Party | Candidate | Votes | % | ± | |
---|---|---|---|---|---|
Labour | Jamie Walker | 2,193 | 39.3 | -9.8 | |
Conservative | Zain Shah | 1,734 | 31.1 | -2.2 | |
UKIP | Ian Hayes | 1,244 | 22.3 | +22.3 | |
Liberal Democrat | Rodney Rew | 212 | 3.8 | -2.0 | |
Green | Ann Beckett | 192 | 3.4 | -8.6 | |
Majority | 459 | 8.2 | -7.5 | ||
Turnout | 5,575 | 64.8 | +30.0 | ||
Labour hold | Swing | ||||
Party | Candidate | Votes | % | ± | |
---|---|---|---|---|---|
Labour | Rachel Skillen | 2,164 | 45.9 | -12.1 | |
Conservative | David Lewis | 1,294 | 27.5 | +1.1 | |
UKIP | Christopher Turner | 968 | 20.5 | +20.5 | |
Green | Stephen Dillon | 195 | 4.1 | -8.8 | |
Liberal Democrat | Kamran Islam | 90 | 1.9 | -0.7 | |
Majority | 870 | 18.5 | -13.1 | ||
Turnout | 4,711 | 56.1 | +28.4 | ||
Labour hold | Swing | ||||
Party | Candidate | Votes | % | ± | |
---|---|---|---|---|---|
Conservative | Rob Hodkinson | 3,090 | 47.1 | +0.1 | |
Labour | Karen Leach | 2,308 | 35.2 | +2.1 | |
UKIP | David Barker | 753 | 11.5 | -4.3 | |
Green | Laura Chepner | 404 | 6.2 | +3.0 | |
Majority | 782 | 11.9 | -1.9 | ||
Turnout | 6,555 | 72.3 | +31.8 | ||
Conservative hold | Swing | ||||
Party | Candidate | Votes | % | ± | |
---|---|---|---|---|---|
Labour | Judith Kelly | 2,948 | 52.8 | +1.7 | |
Conservative | Sue Smith | 1,416 | 25.4 | +9.7 | |
UKIP | Mike Harling | 861 | 15.4 | -9.4 | |
Green | Paul Deaville | 189 | 3.4 | -1.7 | |
Liberal Democrat | Gareth Lloyd-Johnson | 168 | 3.0 | -0.2 | |
Majority | 1,532 | 27.4 | +1.1 | ||
Turnout | 5,582 | 62.9 | +25.1 | ||
Labour hold | Swing | ||||
Party | Candidate | Votes | % | ± | |
---|---|---|---|---|---|
Labour | Michael James | 2,579 | 43.8 | -13.9 | |
Conservative | David Silbiger | 2,113 | 35.9 | +13.2 | |
UKIP | Jennifer Jamieson | 480 | 8.1 | +8.1 | |
Liberal Democrat | Steve Wright | 395 | 6.7 | -3.6 | |
Green | Karen Wood | 316 | 5.3 | -3.9 | |
Majority | 466 | 7.9 | -27.0 | ||
Turnout | 5,883 | 65.7 | +27.3 | ||
Labour hold | Swing | ||||
Party | Candidate | Votes | % | ± | |
---|---|---|---|---|---|
Labour | Noel Bayley | 2,135 | 40.2 | -3.7 | |
Liberal Democrat | Donal O'Hanlon | 1,243 | 23.4 | -8.6 | |
Conservative | Zadok Day | 1,051 | 19.8 | +3.9 | |
UKIP | Robert Cahill | 562 | 10.6 | +10.6 | |
Green | Andrew McKee | 317 | 6.0 | -2.2 | |
Majority | 892 | 16.8 | +5.0 | ||
Turnout | 5,308 | 65.5 | +26.4 | ||
Labour hold | Swing | ||||
Party | Candidate | Votes | % | ± | |
---|---|---|---|---|---|
Conservative | Yvonne Wright | 2,682 | 48.8 | +7.3 | |
Labour | Andrew Jones | 1,592 | 28.9 | -3.8 | |
UKIP | Ian Henderson | 785 | 14.3 | -5.1 | |
Green | Samantha Deas | 247 | 4.5 | +1.0 | |
Liberal Democrat | David Foss | 194 | 3.5 | +0.7 | |
Majority | 1,090 | 19.8 | +11.0 | ||
Turnout | 5,500 | 68.9 | +29.5 | ||
Conservative hold | Swing | ||||
Party | Candidate | Votes | % | ± | |
---|---|---|---|---|---|
Labour | Joan Grimshaw | 2,249 | 45.2 | +0.1 | |
Conservative | Bernard Vincent | 1,705 | 34.3 | +10.9 | |
UKIP | Ged Smith | 670 | 13.5 | -11.1 | |
Liberal Democrat | Katriona Middleton | 183 | 3.7 | +1.2 | |
Green | Carm Bithell | 167 | 3.3 | +3.3 | |
Majority | 544 | 10.9 | -9.6 | ||
Turnout | 4,974 | 67.6 | +28.2 | ||
Labour hold | Swing | ||||
The 1998 Bolton Metropolitan Borough Council election took place on 7 May 1998 to elect members of Bolton Metropolitan Borough Council in Greater Manchester, England. One third of the council was up for election and the Labour party kept overall control of the council.
The 2008 St Helens Metropolitan Borough Council election took place on 1 May 2008 to elect members of St Helens Metropolitan Borough Council in Merseyside, England. One third of the council was up for election and the council stayed under no overall control.
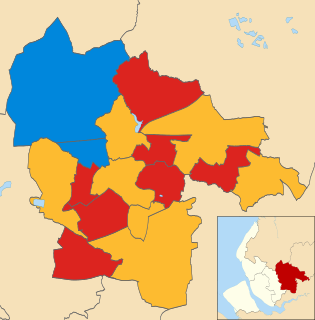
The 2007 St Helens Metropolitan Borough Council election took place on 3 May 2007 to elect members of St Helens Metropolitan Borough Council in Merseyside, England. One third of the council was up for election and the council stayed under no overall control.
The 2000 Sandwell Metropolitan Borough Council election took place on 4 May 2000 to elect members of Sandwell Metropolitan Borough Council in the West Midlands, England. One third of the council was up for election and the Labour party stayed in overall control of the council.
The 2011 Sandwell Metropolitan Borough Council election took place on 5 May 2011 to elect members of Sandwell Metropolitan Borough Council in the West Midlands, England. One third of the council was up for election and the Labour party stayed in overall control of the council.
The 2007 Walsall Metropolitan Borough Council election took place on 3 May 2007 to elect members of Walsall Metropolitan Borough Council in the West Midlands, England. One third of the council was up for election and the Conservative party stayed in overall control of the council.
Elections to Bolton Metropolitan Borough Council were held on 3 May 2012. One third of the council was up for election, with each successful candidate to serve a four-year term of office, expiring in 2016.
The 1996 Bolton Metropolitan Borough Council election took place on 2 May 1996 to elect members of Bolton Metropolitan Borough Council in Greater Manchester, England. One third of the council was up for election and the Labour party kept overall control of the council
The 1995 Bolton Metropolitan Borough Council election took place on 4 May 1995 to elect members of Bolton Metropolitan Borough Council in Greater Manchester, England. One third of the council was up for election and the Labour party kept overall control of the council
The 1990 Bolton Metropolitan Borough Council election took place on 4 May 1990 to elect members of Bolton Metropolitan Borough Council in Greater Manchester, England. One third of the council was up for election and the Labour party kept overall control of the council
The 1991 Bolton Metropolitan Borough Council election took place on 6 May 1991 to elect members of Bolton Metropolitan Borough Council in Greater Manchester, England. One third of the council was up for election and the Labour party kept overall control of the council.
The 1992 Bolton Metropolitan Borough Council election took place on 7 May 1992 to elect members of Bolton Metropolitan Borough Council in Greater Manchester, England. One third of the council was up for election and the Labour party kept overall control of the council.
The 1994 Bolton Metropolitan Borough Council election took place on 5 May 1994 to elect members of Bolton Metropolitan Borough Council in Greater Manchester, England. One third of the council was up for election and the Labour party kept overall control of the council.
Elections to Bolton Metropolitan Borough Council were held on 22 May 2014, along with the European Parliament elections, 2014. One third of the council was up for election, with each successful candidate to serve a four-year term of office, expiring in 2018.
The 2010 St Helens Metropolitan Borough Council election took place on 6 May 2010 to elect members of St Helens Metropolitan Borough Council in Merseyside, England. One third of the council was up for election and the Labour party gained overall control of the council from no overall control.
The 2011 St Helens Metropolitan Borough Council election took place on 5 May 2011 to elect members of St Helens Metropolitan Borough Council in Merseyside, England. One third of the council was up for election and the Labour party stayed in overall control of the council.
The 2012 St Helens Metropolitan Borough Council election took place on 3 May 2012 to elect members of St Helens Metropolitan Borough Council in Merseyside, England. One third of the council was up for election and the Labour party stayed in overall control of the council.
The 2014 St Helens Metropolitan Borough Council election took place on 22 May 2014 to elect members of St Helens Metropolitan Borough Council in Merseyside, England. One third of the council was up for election and the Labour party stayed in overall control of the council.
The 2015 Bolton Metropolitan Borough Council election were held on 7 May 2015 to elect members of Bolton Metropolitan Borough Council in Greater Manchester, England. This took place on the same day as other local elections
The 2016 Bury Metropolitan Borough Council election took place on 5 May 2016 to elect members of Bury Metropolitan Borough Council in England. This was on the same day as other local elections.