Elections to Bury Council were held on 22 May 2014, along with the European Parliament elections, 2014. One third of the council was up for election, with each successful candidate to serve a four-year term of office, expiring in 2018. The Labour Party retained control of the Council.
The Metropolitan Borough of Bury is a metropolitan borough of Greater Manchester in North West England, just north of Manchester, which consists of six towns: Bury, Ramsbottom, Tottington, Radcliffe, Whitefield and Prestwich. Bury bounds the Lancashire districts of Rossendale and Blackburn with Darwen to the north.
17 seats were contested. The Labour Party won 12 seats, the Conservatives won 4 seats, and the Liberal Democrats won 1 seat.
After the election, the total composition of the council was as follows:
The Labour Party is a centre-left political party in the United Kingdom which has been described as an alliance of social democrats, democratic socialists and trade unionists. The party's platform emphasises greater state intervention, social justice and strengthening workers' rights.
The Conservative Party, officially the Conservative and Unionist Party, is a centre-right political party in the United Kingdom. Presently led by Theresa May, it has been the governing party since 2010. It presently has 314 Members of Parliament in the House of Commons, 249 members of the House of Lords, and 18 members of the European Parliament. It also has 31 Members of the Scottish Parliament, 12 members of the Welsh Assembly, eight members of the London Assembly and 9,008 local councillors. One of the major parties of UK politics, it has formed the government on 45 occasions, more than any other party.
The Liberal Democrats are a liberal political party in the United Kingdom. They presently have 11 Members of Parliament in the House of Commons, 96 members of the House of Lords, and one member of the European Parliament. They also have five Members of the Scottish Parliament and a member each in the Welsh Assembly and London Assembly. The party reached the height of its influence in the early 2010s, forming a junior partner in a coalition government from 2010 to 2015. It is presently led by Vince Cable.
Party | Seats | Gains | Losses | Net gain/loss | Seats % | Votes % | Votes | +/− | |
---|---|---|---|---|---|---|---|---|---|
Labour | 12 | 3 | 0 | +3 | 42.0 | 22,832 | -9.0 | ||
Conservative | 4 | 0 | 2 | -2 | 32.2 | 17,504 | +3.6 | ||
UKIP | 0 | 0 | 0 | 10.8 | 5,891 | +2.0 | |||
Liberal Democrat | 1 | 0 | 1 | -1 | 8.0 | 4,340 | +1.3 | ||
Green | 0 | 0 | 0 | 0 | 0 | 6.0 | 3,260 | +4.9 | |
English Democrat | 0 | 0 | 0 | 0 | 0 | 0.9 | 514 | +0.2 | |
Party | Candidate | Votes | % | ± | |
---|---|---|---|---|---|
Labour | Mary Whitby | 1,313 | 52.4 | -9.4 | |
Conservative | Zadok Day | 479 | 19.1 | +4.2 | |
English Democrat | Stephen Morris | 412 | 16.4 | +1.1 | |
Green | Larissa Heath | 172 | 6.9 | +6.9 | |
Liberal Democrat | Steve Middleton | 127 | 5.1 | -2.5 | |
Majority | 834 | 33.3 | -12.2 | ||
Turnout | 2,503 | 30.5 | +1.9 | ||
Labour hold | Swing | ||||
Party | Candidate | Votes | % | ± | |
---|---|---|---|---|---|
Conservative | Susan Nuttall | 1,944 | 54.4 | +3.4 | |
Labour | Andrew McNaulty | 1,216 | 34.0 | +0.1 | |
Green | Patrick Neill | 309 | 8.6 | +8.6 | |
Liberal Democrat | Ann Garner | 105 | 2.9 | -0.8 | |
Majority | 728 | 20.4 | +3.3 | ||
Turnout | 3,574 | 42.6 | +3.7 | ||
Conservative hold | Swing | ||||
Party | Candidate | Votes | % | ± | |
---|---|---|---|---|---|
Labour | Trevor Holt | 1,494 | 55.4 | -1.7 | |
UKIP | Shaf Mahmood | 682 | 25.3 | +2.7 | |
Conservative | Gregory Keeley | 384 | 14.2 | -5.8 | |
Green | Eva Stewart | 137 | 5.1 | +5.1 | |
Majority | 812 | 30.1 | -4.4 | ||
Turnout | 2,697 | 33.2 | +2.3 | ||
Labour hold | Swing | ||||
Party | Candidate | Votes | % | ± | |
---|---|---|---|---|---|
Labour | Sarah Kerrison | 1,153 | 36.0 | -9.2 | |
Conservative | Michael Hankey | 1,075 | 33.5 | -2.2 | |
UKIP | Graeme Kerby | 726 | 22.6 | +7.4 | |
Green | Julie Southworth | 159 | 4.9 | +4.9 | |
Liberal Democrat | Andrew Garner | 93 | 2.9 | -0.7 | |
Majority | 78 | 2.4 | -7.1 | ||
Turnout | 3,206 | 37.1 | +3.7 | ||
Labour gain from Conservative | Swing | ||||
Party | Candidate | Votes | % | ± | |
---|---|---|---|---|---|
Liberal Democrat | Timothy Pickstone | 1,800 | 50.4 | +9.5 | |
Labour | Catherine Preston | 1,458 | 40.1 | -5.3 | |
Conservative | Zain Shah | 315 | 8.8 | +1.0 | |
Majority | 342 | 9.6 | |||
Turnout | 3,573 | 41.7 | +4.7 | ||
Liberal Democrat hold | Swing | ||||
Party | Candidate | Votes | % | ± | |
---|---|---|---|---|---|
Labour | Sandra Walmsley | 1,495 | 52.0 | -13.2 | |
UKIP | Victor Hagan | 756 | 26.3 | +11.7 | |
Conservative | Nabila Afilal | 469 | 16.3 | +0.2 | |
Green | Anne Beckett | 155 | 5.4 | +5.4 | |
Majority | 739 | 25.7 | -23.4 | ||
Turnout | 2,875 | 32.1 | +3.9 | ||
Labour hold | Swing | ||||
Party | Candidate | Votes | % | ± | |
---|---|---|---|---|---|
Conservative | James Daly | 1,781 | 50.3 | -6.3 | |
Labour | Steven Treadgold | 816 | 23.1 | -4.1 | |
UKIP | Tanya Kay | 583 | 16.5 | +16.5 | |
Green | Mary Heath | 221 | 6.2 | -4.5 | |
Liberal Democrat | Ewan Arthur | 137 | 3.9 | -1.4 | |
Majority | 965 | 27.3 | -2.1 | ||
Turnout | 3,538 | 43.8 | +3.1 | ||
Conservative hold | Swing | ||||
Party | Candidate | Votes | % | ± | |
---|---|---|---|---|---|
Labour | John Mallon | 1,312 | 39.9 | -6.5 | |
Conservative | Bernie Vincent | 1,149 | 39.2 | -7.2 | |
UKIP | John Parkinson | 392 | 13.4 | +13.4 | |
Green | Peter Curati | 118 | 4.0 | +4.0 | |
Liberal Democrat | Wilfred Davison | 102 | 3.5 | -1.3 | |
Majority | 19 | 0.6 | |||
Turnout | 2,929 | 38.7 | +4.0 | ||
Labour gain from Conservative | Swing | ||||
Party | Candidate | Votes | % | ± | |
---|---|---|---|---|---|
Labour | Nick Parnell | 1,299 | 51.5 | -7.6 | |
Conservative | Samantha Davies | 763 | 30.2 | +9.2 | |
Green | Nicole Haydock | 368 | 14.6 | +14.6 | |
Liberal Democrat | Joanne O'Hanlon | 93 | 3.7 | +0.2 | |
Majority | 536 | 21.2 | -16.9 | ||
Turnout | 2,523 | 30.0 | +2.3 | ||
Labour hold | Swing | ||||
Party | Candidate | Votes | % | ± | |
---|---|---|---|---|---|
Labour | Jane Lewis | 1,480 | 49.1 | -2.3 | |
Conservative | Carl Curran | 1,005 | 33.3 | -0.8 | |
Green | John Southworth | 361 | 12.0 | +12.0 | |
Liberal Democrat | Rod Rew | 168 | 5.8 | +3.0 | |
Majority | 475 | 15.7 | -1.6 | ||
Turnout | 3,014 | 34.8 | -0.4 | ||
Labour hold | Swing | ||||
Party | Candidate | Votes | % | ± | |
---|---|---|---|---|---|
Labour | Rishi Shori | 1,361 | 58.0 | -11.3 | |
Conservative | Katy Rothwell | 619 | 26.4 | +11.3 | |
Green | Stephen Dillon | 303 | 12.9 | +12.9 | |
Liberal Democrat | Kamran Islam | 62 | 2.6 | -0.2 | |
Majority | 742 | 31.6 | -22.6 | ||
Turnout | 2,345 | 27.7 | +2.2 | ||
Labour hold | Swing | ||||
Party | Candidate | Votes | % | ± | |
---|---|---|---|---|---|
Conservative | Ian Bevan | 1,710 | 47.0 | +8.9 | |
Labour | Sarah Southworth | 1,206 | 33.1 | -16.1 | |
UKIP | David Barker | 574 | 15.8 | +6.6 | |
Green | Glynn Heath | 115 | 3.2 | +3.2 | |
Liberal Democrat | Mary D'Albert | 33 | 0.9 | -2.3 | |
Majority | 504 | 13.8 | |||
Turnout | 3,638 | 40.5 | +3.8 | ||
Conservative hold | Swing | ||||
Party | Candidate | Votes | % | ± | |
---|---|---|---|---|---|
Labour | Tamoor Tariq | 1,691 | 51.1 | -6.0 | |
UKIP | Mike Harling | 820 | 24.8 | +8.5 | |
Conservative | Luis McBriar | 521 | 15.7 | -4.7 | |
Green | Bill Brison | 168 | 5.1 | +5.1 | |
Liberal Democrat | Gareth Lloyd-Johnson | 107 | 3.2 | -2.5 | |
Majority | 871 | 26.3 | -13.4 | ||
Turnout | 3,307 | 37.8 | +4.7 | ||
Labour hold | Swing | ||||
Party | Candidate | Votes | % | ± | |
---|---|---|---|---|---|
Labour | Alan Quinn | 1,903 | 57.7 | -2.6 | |
Conservative | David Lewis | 750 | 22.7 | +4.5 | |
Liberal Democrat | Steve Wright | 340 | 10.3 | -10.2 | |
Green | Kamila Laing | 307 | 9.3 | +9.3 | |
Majority | 1,153 | 34.9 | -5.0 | ||
Turnout | 3,300 | 38.4 | -4.8 | ||
Labour hold | Swing | ||||
Party | Candidate | Votes | % | ± | |
---|---|---|---|---|---|
Labour | Eamonn O'Brien | 1,381 | 43.9 | -3.1 | |
Liberal Democrat | Donal O'Hanlon | 1008 | 32.0 | -2.0 | |
Conservative | Denise Ormrod | 500 | 15.9 | +4.3 | |
Green | Paul Deaville | 258 | 8.2 | +1.2 | |
Majority | 373 | 11.8 | -1.2 | ||
Turnout | 3,147 | 39.1 | +4.8 | ||
Labour gain from Liberal Democrat | Swing | ||||
Party | Candidate | Votes | % | ± | |
---|---|---|---|---|---|
Conservative | Iain Gartside | 1,295 | 41.5 | +4.0 | |
Labour | Judith Kelly | 1,019 | 32.7 | -9.5 | |
UKIP | Walter Southworth | 605 | 19.4 | +7.7 | |
Green | Zarrin Shannon | 109 | 3.5 | +3.5 | |
Liberal Democrat | David Foss | 88 | 2.8 | -2.4 | |
Majority | 276 | 8.8 | |||
Turnout | 3,116 | 39.4 | +7.6 | ||
Conservative hold | Swing | ||||
Party | Candidate | Votes | % | ± | |
---|---|---|---|---|---|
Labour | Paul Adams | 1,379 | 45.1 | -15.3 | |
UKIP | Steve Evans | 753 | 24.6 | +14.5 | |
Conservative | Richard Cohen | 745 | 23.4 | -2.8 | |
English Democrat | Valerie Morris | 102 | 3.3 | +3.3 | |
Liberal Democrat | Katriona Middleton | 77 | 2.5 | -0.3 | |
Majority | 626 | 20.5 | -13.7 | ||
Turnout | 3,056 | 39.4 | +2.1 | ||
Labour hold | Swing | ||||
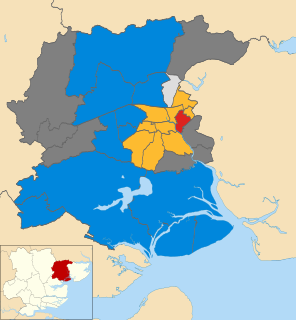
The 2006 Colchester Borough Council election took place on 4 May 2006 to elect members of Colchester Borough Council in Essex, England. One third of the council was up for election and the council stayed under no overall control.
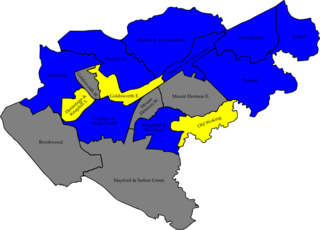
The 2007 Woking Council election took place on 3 May 2007 to elect members of Woking Borough Council in Surrey, England. One third of the council was up for election and the Conservative party gained overall control of the council from no overall control.
The 1998 Pendle Borough Council election took place on 7 May 1998 to elect members of Pendle Borough Council in Lancashire, England. One third of the council was up for election and the Liberal Democrats stayed in overall control of the council.
The 2004 Pendle Borough Council election took place on 10 June 2004 to elect members of Pendle Borough Council in Lancashire, England. One third of the council was up for election and the Liberal Democrats gained overall control of the council from no overall control.
The 2007 Pendle Borough Council election took place on 3 May 2007 to elect members of Pendle Borough Council in Lancashire, England. One third of the council was up for election and the Liberal Democrats stayed in overall control of the council.
The 2011 Aylesbury Vale District Council election took place on 5 May 2011 to elect members of Aylesbury Vale District Council in Buckinghamshire, England. The whole council was up for election and the Conservative party stayed in overall control of the council.
The 2011 Wealden District Council election took place on 5 May 2011 to elect members of Wealden District Council in East Sussex, England. The whole council was up for election and the Conservative party stayed in overall control of the council.
Elections to Bolton Metropolitan Borough Council were held on 3 May 2012. One third of the council was up for election, with each successful candidate to serve a four-year term of office, expiring in 2016.
The 2014 St Albans City and District Council election took place on 22 May 2014 to elect members of St Albans District Council in Hertfordshire, England. One third of the council was up for election and the council stayed under no overall control.
Elections to Bolton Metropolitan Borough Council were held on 22 May 2014, along with the European Parliament elections, 2014. One third of the council was up for election, with each successful candidate to serve a four-year term of office, expiring in 2018.
The 2014 Harrow Council election took place on 22 May 2014 to elect members of Harrow Council in England. This was on the same day as other local elections.
The 2014 Basingstoke and Deane Borough Council election took place on 22 May 2014 to elect members of Basingstoke and Deane Borough Council in England. This was on the same day as other local elections.
The 2008 Colchester Borough Council election took place on 1 May 2008 to elect members of Colchester Borough Council in Essex, England. One third of the council was up for election and the Conservative party lost overall control of the council to no overall control.
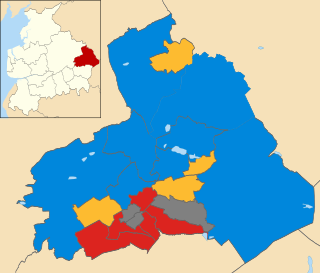
The 2011 Pendle Borough Council election took place on 5 May 2011 to elect members of Pendle Borough Council in Lancashire, England. One third of the council was up for election and the council stayed under no overall control.
The 2012 Pendle Borough Council election took place on 3 May 2012 to elect members of Pendle Borough Council in Lancashire, England. One third of the council was up for election and the council stayed under no overall control.
The 2014 Pendle Borough Council election took place on 22 May 2014 to elect members of Pendle Borough Council in Lancashire, England. One third of the council was up for election and the council stayed under no overall control.
The 2007 Havant Borough Council election took place on 3 May 2007 to elect members of Havant Borough Council in Hampshire, England. One third of the council was up for election and the Conservative party stayed in overall control of the council.
The 2014 Havant Borough Council election took place on 22 May 2014 to elect members of Havant Borough Council in Hampshire, England. One third of the council was up for election and the Conservative party stayed in overall control of the council.
The 2014 West Oxfordshire District Council election took place on 22 May 2014 to elect members of West Oxfordshire District Council in Oxfordshire, England. One third of the council was up for election and the Conservative party stayed in overall control of the council.