| |||||||||||||||||||||||||||||||||
One third (21 of 63) seats to Doncaster Metropolitan Borough Council 32 seats needed for a majority | |||||||||||||||||||||||||||||||||
---|---|---|---|---|---|---|---|---|---|---|---|---|---|---|---|---|---|---|---|---|---|---|---|---|---|---|---|---|---|---|---|---|---|
| |||||||||||||||||||||||||||||||||
Map showing the results of the 2014 Doncaster Council elections. | |||||||||||||||||||||||||||||||||
|
The 2014 Doncaster Metropolitan Borough Council election took place on 22 May 2014 as part of the 2014 local elections in the United Kingdom. [1] One third of 63 seats were up for election. The 2014 European Parliament Elections were also held on the same day.
The election resulted in the Labour Party retaining its control of the council, with a slightly reduced majority after losing two seats overall. UKIP won a substantial number of votes at this election, increasing its vote share by 30.5%, but only won a single seat. The Liberal Democrats lost the only seat they were defending. After the election, the composition of the council was: [2]
The Labour Party is a centre-left political party in the United Kingdom which has been described as an alliance of social democrats, democratic socialists and trade unionists. The party's platform emphasises greater state intervention, social justice and strengthening workers' rights.
The UK Independence Party is a hard Eurosceptic, right-wing political party in the United Kingdom. It currently has one representative in the House of Lords and seven Members of the European Parliament (MEPs). It has four Assembly Members (AMs) in the National Assembly for Wales and one member in the London Assembly. The party reached its greatest level of success in the mid-2010s, when it gained two Members of Parliament and was the largest UK party in the European Parliament.
The Liberal Democrats are a liberal political party in the United Kingdom. They presently have 11 Members of Parliament in the House of Commons, 96 members of the House of Lords, and one member of the European Parliament. They also have five Members of the Scottish Parliament and a member each in the Welsh Assembly and London Assembly. The party reached the height of its influence in the early 2010s, forming a junior partner in a coalition government from 2010 to 2015. It is presently led by Vince Cable.
Party | Seats | Gains | Losses | Net gain/loss | Seats % | Votes % | Votes | +/− | |
---|---|---|---|---|---|---|---|---|---|
Labour | 15 | 1 | 3 | -2 | 38.2 | 26,552 | |||
Conservative | 3 | 0 | 0 | 0 | 12.8 | 8,880 | |||
UKIP | 1 | 1 | 0 | +1 | 31.7 | 22,046 | |||
Mexborough First | 1 | 1 | 0 | +1 | 1.7 | 1,193 | |||
Independent | 1 | 1 | 0 | +1 | 2.9 | 1,981 | |||
Liberal Democrat | 0 | 0 | 1 | -1 | 3.6 | 2,519 | |||
TUSC | 0 | 0 | 0 | 0 | 2.2 | 1,556 | |||
Doncaster First Independents Group | 0 | 0 | 0 | 0 | 2.1 | 1,469 | |||
Green | 0 | 0 | 0 | 0 | 1.9 | 1,341 | |||
English Democrat | 0 | 0 | 0 | 0 | 1.8 | 1,241 | |||
Community Group | 0 | 0 | 0 | 0 | 1 | 673 | |||
The results in each ward are shown below. Changes are compared with the previous election in 2010. [3]
Party | Candidate | Votes | % | ± | |
---|---|---|---|---|---|
Labour | John Mounsey | 1,559 | 50.7 | -1.3 | |
UKIP | Ian Stewart | 896 | 29.1 | N/A | |
TUSC | Jason Lee Fawley | 259 | 8.4 | N/A | |
English Democrat | Joanne Allen | 180 | 5.9 | -11.8 | |
Liberal Democrat | John Victor Butterfield | 180 | 5.9 | -12.9 | |
Turnout | 3,074 | 28.4 | -24.4 | ||
Labour hold | Swing | ||||
Party | Candidate | Votes | % | ± | |
---|---|---|---|---|---|
Labour | Chris McGuinness | 1,286 | 39.3 | +0.1 | |
UKIP | Louise Emery | 975 | 29.8 | N/A | |
Independent | Scott Andrew Pickles | 666 | 20.3 | N/A | |
Conservative | Kenneth Allen | 231 | 7.1 | -6.9 | |
TUSC | Joyce Mary Sheppard | 116 | 3.5 | N/A | |
Turnout | 3,274 | 30 | -25.6 | ||
Labour hold | Swing | ||||
Party | Candidate | Votes | % | ± | |
---|---|---|---|---|---|
Labour | Iris Beech | 1,473 | 46.5 | -2.1 | |
UKIP | Phyllis Calladine | 1,229 | 38.8 | N/A | |
Liberal Democrat | Adrian Jonathan McLeay | 469 | 14.8 | N/A | |
Turnout | 3,171 | 32.8 | |||
Labour hold | Swing | ||||
Party | Candidate | Votes | % | ± | |
---|---|---|---|---|---|
Labour | Andrew Bosmans | 1,330 | 42.5 | +0.4 | |
UKIP | Steve Shukla | 1,075 | 34.3 | N/A | |
Conservative | Alex Allen | 430 | 13.7 | -10.9 | |
Green | Jordan Ingram | 180 | 5.7 | N/A | |
Liberal Democrat | Edwin Simpson | 118 | 3.8 | N/A | |
Turnout | 3,133 | 28.2 | -25.4 | ||
Labour hold | Swing | ||||
Party | Candidate | Votes | % | ± | |
---|---|---|---|---|---|
Labour | Frank Jackson | 1,333 | 48.5 | +1.5 | |
UKIP | Eddie Storey | 1,170 | 42.6 | N/A | |
Liberal Democrat | Rene Paterson | 124 | 4.5 | N/A | |
TUSC | Julia Welbourn | 122 | 4.4 | N/A | |
Turnout | 2,749 | 27.5 | -22.1 | ||
Labour hold | Swing | ||||
Party | Candidate | Votes | % | ± | |
---|---|---|---|---|---|
Labour | Neil Gethin | 1,022 | 25.8 | +3.1 | |
UKIP | Bernie Aston | 880 | 22.2 | N/A | |
Liberal Democrat | Diana Simpson | 858 | 21.7 | -13.1 | |
Conservative | Barbara Fletcher | 695 | 17.6 | -8.8 | |
English Democrat | Barbara Hewitt | 263 | 6.6 | -9.4 | |
Green | Ali Hurworth | 124 | 3.1 | N/A | |
Doncaster First Independents Group | Richard Walker | 115 | 2.9 | N/A | |
Turnout | 3,957 | 35.2 | |||
Labour gain from Liberal Democrat | Swing | ||||
Party | Candidate | Votes | % | ± | |
---|---|---|---|---|---|
Labour | John McHale | 1,787 | 55.7 | +4.8 | |
UKIP | David Roy Harrison | 906 | 28.2 | N/A | |
Conservative | Nick Allen | 239 | 7.4 | -6.2 | |
TUSC | Mal Perkins | 148 | 4.6 | N/A | |
Independent | John Garner | 130 | 4 | N/A | |
Turnout | 3,210 | 29.7 | -19.5 | ||
Labour hold | Swing | ||||
Party | Candidate | Votes | % | ± | |
---|---|---|---|---|---|
Labour | Sandra Mary Holland | 1,568 | 49.6 | -8.2 | |
UKIP | William Shaw | 1,265 | 40 | N/A | |
TUSC | Steve Williams | 327 | 10.3 | N/A | |
Turnout | 3,160 | 30.7 | -23 | ||
Labour hold | Swing | ||||
Party | Candidate | Votes | % | ± | |
---|---|---|---|---|---|
UKIP | Fred Gee | 1,304 | 36.7 | N/A | |
Labour | David Nevett | 1,267 | 35.7 | +11.7 | |
Conservative | Chris Allen | 681 | 19.2 | -1.1 | |
English Democrat | Keith Hewitt | 198 | 5.6 | -10.6 | |
TUSC | Greg Beaumont | 102 | 2.9 | N/A | |
Turnout | 3,552 | 33.2 | -29.8 | ||
UKIP gain from Labour | Swing | ||||
Party | Candidate | Votes | % | ± | |
---|---|---|---|---|---|
Labour | Elsie Butler | 1,246 | 37.3 | -0.2 | |
UKIP | Kim Parkinson | 817 | 24.5 | N/A | |
Doncaster First Independents Group | Georgina Mullis | 746 | 22.4 | N/A | |
Conservative | Liz Jones | 202 | 6.1 | -8.3 | |
English Democrat | John Brennan | 121 | 3.6 | -13.5 | |
Green | David Ingram | 113 | 3.4 | N/A | |
TUSC | Nigel Leslie Jurgens | 92 | 2.8 | N/A | |
Turnout | 3,337 | 32.5 | -25.3 | ||
Labour hold | Swing | ||||
Party | Candidate | Votes | % | ± | |
---|---|---|---|---|---|
Conservative | Allan Jones | 1,473 | 34.1 | -2.9 | |
UKIP | Mick Andrews | 1,375 | 31.8 | N/A | |
Labour | Tony Bryan | 952 | 22 | +3.6 | |
Doncaster First Independents Group | Marc Bratcher | 300 | 6.9 | N/A | |
Liberal Democrat | David Pratt | 225 | 5.2 | -19.5 | |
Turnout | 4,325 | 35.6 | -32.3 | ||
Conservative hold | Swing | ||||
Party | Candidate | Votes | % | ± | |
---|---|---|---|---|---|
Labour | Kevin Rodgers | 1,828 | 47.8 | +11.3 | |
UKIP | Jack Kelley | 1,516 | 39.7 | N/A | |
Green | Stephen Platt | 477 | 12.5 | +3.6 | |
Turnout | 3,821 | 32.6 | -25.9 | ||
Labour hold | Swing | ||||
Party | Candidate | Votes | % | ± | |
---|---|---|---|---|---|
Labour | Linda Curran | 1,403 | 43.8 | +10 | |
UKIP | Mick Glynn | 1,258 | 39.3 | +33.9 | |
Conservative | Amy Atkinson | 468 | 14.6 | -5.1 | |
TUSC | Bob Venus | 75 | 2.3 | N/A | |
Turnout | 3,204 | 32.1 | |||
Labour hold | Swing | -26.8 | |||
Party | Candidate | Votes | % | ± | |
---|---|---|---|---|---|
Mexborough First | Andy Pickering | 1,193 | 35.3 | N/A | |
Labour | David Holland | 1,073 | 31.8 | -8.3 | |
UKIP | Frank Lloyd Calladine | 949 | 28.1 | N/A | |
English Democrat | Brian Whitmore | 82 | 2.4 | -4.7 | |
Green | Ann Gilbert | 82 | 2.4 | N/A | |
Turnout | 3,379 | 29.5 | -22.6 | ||
Mexborough First gain from Labour | Swing | ||||
Party | Candidate | Votes | % | ± | |
---|---|---|---|---|---|
Independent | John Cooke | 1,185 | 39.1 | N/A | |
Labour | John Healy | 871 | 28.7 | -3.9 | |
UKIP | Dave Matthews | 599 | 19.8 | N/A | |
Conservative | Kathleen Margaret Beard | 195 | 6.4 | -3.1 | |
English Democrat | Carol Young | 180 | 5.9 | -7.6 | |
Turnout | 3,030 | 30.7 | |||
Independent gain from Labour | Swing | -23.5 | |||
Party | Candidate | Votes | % | ± | |
---|---|---|---|---|---|
Conservative | Alan Smith | 1,240 | 35.3 | -2.5 | |
Labour | Nigel Ball | 958 | 27.3 | -0.9 | |
UKIP | Paul Bissett | 867 | 24.7 | N/A | |
Green | Bob Gilbert | 233 | 6.6 | -6.4 | |
English Democrat | David Allen | 217 | 6.2 | -14.8 | |
Turnout | 3,515 | 36.9 | -30.6 | ||
Conservative hold | Swing | ||||
Party | Candidate | Votes | % | ± | |
---|---|---|---|---|---|
Labour | Barbara Hedley | 1,036 | 40.9 | +2.9 | |
UKIP | Mike Overton | 989 | 39.1 | +31 | |
Conservative | Martin Drake | 373 | 14.7 | -5.5 | |
TUSC | Mary Jackson | 132 | 5.2 | N/A | |
Turnout | 2,530 | 26.4 | -25.7 | ||
Labour hold | Swing | ||||
Party | Candidate | Votes | % | ± | |
---|---|---|---|---|---|
Labour | Mark Houlbrook | 977 | 30.5 | +3 | |
UKIP | Tina O'Halloran | 955 | 29.8 | N/A | |
Conservative | John Brown | 519 | 16.2 | -6.8 | |
Community Group | Karen Redmile | 673 | 21 | +9.1 | |
TUSC | Brenda Denise Nixon | 77 | 2.4 | N/A | |
Turnout | 3,201 | 30 | -27.7 | ||
Labour hold | Swing | ||||
Party | Candidate | Votes | % | ± | |
---|---|---|---|---|---|
Conservative | James Vincent Hart | 1,306 | 34.3 | -7.8 | |
UKIP | Rebecca Walters | 1,120 | 29.4 | +21.8 | |
Labour | Eddie Dobbs | 805 | 21.2 | +1.7 | |
Liberal Democrat | David Adgar | 342 | 9 | -14.2 | |
Green | Andy Fisher | 132 | 3.5 | N/A | |
Doncaster First Independents Group | Ray Mullis | 99 | 2.6 | N/A | |
Turnout | 3,804 | 38.5 | -30.9 | ||
Conservative hold | Swing | ||||
Party | Candidate | Votes | % | ± | |
---|---|---|---|---|---|
Labour | Jane Kidd | 1,408 | 44.9 | +10.7 | |
UKIP | Charles Guy Aston | 975 | 31.1 | +26.3 | |
Conservative | Stephen Leslie Cox | 446 | 14.2 | -3.2 | |
Liberal Democrat | John Brown | 203 | 6.5 | -23.6 | |
TUSC | Rob Green | 106 | 3.4 | N/A | |
Turnout | 3,138 | 30.9 | -24.3 | ||
Labour hold | Swing | ||||
Party | Candidate | Votes | % | ± | |
---|---|---|---|---|---|
Labour | Dave Shaw | 1,370 | 46.9 | +6.4 | |
UKIP | Anne Rutherford | 961 | 32.9 | N/A | |
Conservative | Maurice Field | 382 | 13.1 | N/A | |
Doncaster First Independents Group | Gareth Shanks | 209 | 7.2 | N/A | |
Turnout | 2,922 | 29.3 | -21.8 | ||
Labour hold | Swing | ||||
The English Democrats is an English nationalist political party in England.
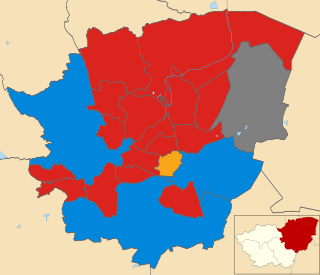
The 2012 Doncaster Metropolitan Borough Council election took place on 3 May 2012 to elect one third of Doncaster Metropolitan Borough Council in South Yorkshire, England. This was on the same day as other United Kingdom local elections, 2012.
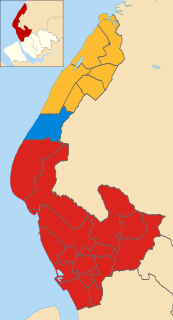
The 2012 Sefton Metropolitan Borough Council election took on 3 May 2012 to elect members of Sefton Metropolitan Borough Council in England, as part of the United Kingdom local elections, 2012. 22 seats, representing one third of the total Council membership, were up for election in single-member wards. Ten - nearly half - of the members elected were newcomers to the Council; five of these defeated sitting Councillors seeking re-election, whilst in the other five wards, the incumbent retired. Two incumbents stood under different labels to those they were elected under in 2008; both were defeated in their wards.
The 2013 United Kingdom local elections took place on Thursday 2 May 2013. Elections were held in 35 English councils: all 27 non-metropolitan county councils and eight unitary authorities, and in one Welsh unitary authority. Direct mayoral elections took place in Doncaster and North Tyneside. These elections last took place on the 4 June 2009 at the same time as the 2009 European Parliament Elections, except for County Durham, Northumberland and the Anglesey where elections last took place in 2008.
The 2014 United Kingdom local elections were held on 22 May 2014. Usually these elections are held on the first Thursday in May but were postponed to coincide with the 2014 European Parliament Elections. Direct elections were held for all 32 London boroughs, all 36 metropolitan boroughs, 74 district/borough councils, 20 unitary authorities and various mayoral posts in England and elections to the new councils in Northern Ireland.
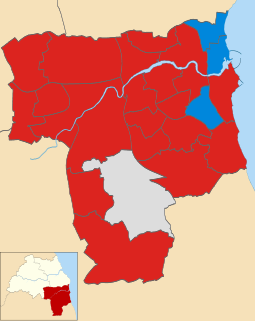
The 2014 Sunderland City Council Election took place on 22 May 2014 to elect members of Sunderland Metropolitan Borough Council in Tyne and Wear, England, as part of the wider United Kingdom local elections, 2014. A third of the council were up for election, the Labour Party stayed in overall control of the council.
The 2014 Barking and Dagenham Council election took place on 23 May 2014 to elect members of Barking and Dagenham Council in England. This was on the same day as other local elections.
The 2014 Calderdale Metropolitan Borough Council election took place on 22 May 2014 to elect members of Calderdale Metropolitan Borough Council in England. This was on the same day as local elections across the United Kingdom and a European election. One councillor was elected in each of the 17 wards for a four-year term. There are three councillors representing each ward elected on a staggered basis so one third of the councillor seats were up for re-election. The seats had previously been contested in 2010 which was held in conjunction with a general election. The turnout was significantly lower in 2014 than in 2010 which is not unusual when comparing local elections that coincide with general elections to ones that do not. Prior to the election Labour was the largest party in the council with 21 out of 51 seats, 5 seats short of an overall majority. After the election there was no overall control of the council. Labour had 25 seats, only one short of a majority and so Labour continued to operate a minority administration.
The 2015 United Kingdom local elections were held on Thursday 7 May 2015, the same day as the general election for the House of Commons of the United Kingdom.
The 2014 Colchester Borough Council election took place on 22 May 2014 to elect members of Colchester Borough Council in Essex, England. One third of the council was up for election and the council stayed under no overall control.
The 2014 Havant Borough Council election took place on 22 May 2014 to elect members of Havant Borough Council in Hampshire, England. One third of the council was up for election and the Conservative party stayed in overall control of the council.
The 2015 Cheshire West and Chester Council election took place on 7 May 2015, electing members of Cheshire West and Chester Council in England. This was on the same day as other local elections across the country as well as the general election.
The 2016 United Kingdom local elections were held on Thursday 5 May 2016 were a series of local elections which were held in 124 local councils and also saw 4 mayoral elections in England which also coincided with elections to the Scottish Parliament, the Welsh Assembly, the Northern Ireland Assembly, the London Assembly, the London mayoral election and the England and Wales Police and crime commissioners. By-elections for the Westminster seats of Ogmore and Sheffield Brightside and Hillsborough were also held. These proved to be David Cameron's last local elections as leader of the Conservative Party and Prime Minister as he resigned two months later following the defeat of Remain in the referendum on Britain's continuing membership of the European Union which was held seven weeks later.
A by-thirds Hyndburn Borough Council local election took place on 5 May 2016. Approximately one third of the local council's 35 seats fell up for election on that day. The fallow year sees Lancashire County Council elections for all residents of this borough.
The 2017 United Kingdom local elections were held on Thursday 4 May 2017. Local elections were held across Great Britain, with elections to 35 English local authorities and all councils in Scotland and Wales.
Council elections in England were held on Thursday 3 May 2018. Elections were held in all 32 London boroughs, 34 metropolitan boroughs, 67 district and borough councils and 17 unitary authorities. There were also direct elections for the mayoralties of Hackney, Lewisham, Newham, Tower Hamlets and Watford.
The 2011 Doncaster Metropolitan Borough Council election took place on 5 May 2011 to elect one third of Doncaster Metropolitan Borough Council as part of the 2011 local elections in the United Kingdom.
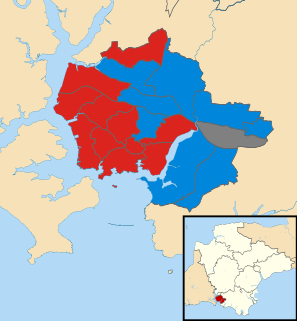
The 2018 Plymouth City Council election took place on 3 May 2018 to elect members of Plymouth City Council in England. The election was won by the Labour Party, who gained enough seats to achieve an overall majority and took control of the council.
This page includes the election results of the Yorkshire Party, a regional political party based in Yorkshire.