Birmingham City Council election, 2014

Last updated

Birmingham City Council election, 2014
Birmingham City Flag.svg
  2012 22 May 2014 2015  

One third (40) seats to Birmingham City Council
61 seats needed for a majority

  First party Second party Third party
 
Party Labour Conservative Liberal Democrat
Seats won 77 31 12
Seat changeIncrease2.svg 2Increase2.svg 2Decrease2.svg 3

Birmingham wards 2014.png

2014 local election results in Birmingham.

Council control before election

Labour

Council control after election

Labour

The 2014 Birmingham City Council election took place on 22 May 2014 to elect members of Birmingham City Council in England. [1] This was on the same day as other local elections.

Birmingham City Council Local government body for the English city

Birmingham City Council is the local government body responsible for the governance of the City of Birmingham in England, which has been a metropolitan district since 1974. It is the most populated local council in the United Kingdom with, following a reorganisation of boundaries in June 2004, 120 Birmingham City councillors representing over one million people, in 40 wards. This means that Birmingham is technically the largest city in the United Kingdom. The council headquarters are at the Council House in the city centre. The council is responsible for running nearly all local services, with the exception of those run by joint boards. The provision of certain services has in recent years been devolved to several council constituencies, which each have a constituency committee made up of councillors from that district.

Contents

All results [2] are compared to 2010 as that is the term which expired in 2014.

Result

Birmingham City Council Election Result 2014
PartySeatsGainsLossesNet gain/lossSeats %Votes %Votes+/−
  Labour 77Increase2.svg 2Steady2.svgIncrease2.svg 2
  Conservative 31Increase2.svg 2Steady2.svgIncrease2.svg 1
  Liberal Democrat 12Steady2.svgDecrease2.svg 3Decrease2.svg 3
  UKIP 0Steady2.svgSteady2.svgSteady2.svg 0
  Green 0Steady2.svgSteady2.svgSteady2.svg 0
  Respect 0Steady2.svgDecrease2.svg 1Decrease2.svg 1 0
  Socialist Labour 0Steady2.svgSteady2.svgSteady2.svg 0
  TUSC 0Steady2.svgSteady2.svgSteady2.svg 0
  Social Democratic 0Steady2.svgSteady2.svgSteady2.svg 0
  Communities Against the Cuts 0Steady2.svgSteady2.svgSteady2.svg 0
  BNP 0Steady2.svgSteady2.svgSteady2.svg 0

Council Composition

Prior to the election the composition of the council was:

772815
LabourConservativeLib Dem

After the election the composition of the council was:

773112
LabourConservativeLib Dem

Results by ward

Acocks Green

Acocks Green 2014
PartyCandidateVotes%±
Liberal Democrat Roger Harmer 2679 45.7 Increase2.svg 3.8
Labour Rachel Seabright 2041 34.8Increase2.svg 2.3
Green Amanda Baker 422 7.2Increase2.svg 4.5
Conservative Charlotte Hodivala 372 6.3Decrease2.svg 7.3
TUSC Eamonn Flynn 254 4.3N/A
Social Democratic Peter Johnson 98 1.7Increase2.svg 1.5
Majority 638 10.9Increase2.svg 1.5
Turnout 5866
Liberal Democrat hold Swing

Aston

Aston 2014
PartyCandidateVotes%±
Labour Ziaul Islam 4175 68.7 Increase2.svg 13.9
Liberal Democrat Sham Uddin 1341 22.1Decrease2.svg 10.3
Conservative Thomas Fraser Pike 452 7.4Increase2.svg 2.0
Independent Abdusalam Smith 108 1.8Decrease2.svg 1.3
Majority 2834 46.6Increase2.svg 24.2
Turnout 6076
Labour hold Swing

Bartley Green

Bartley Green 2014
PartyCandidateVotes%±
Conservative Bruce Lines 2637 49.5 Increase2.svg 4.5
UKIP Clair Felton 1308 24.6N/A
Labour Mike Zamorski 1108 20.8Decrease2.svg 12.1
Green Minnie Rahman 167 3.1Increase2.svg 1.7
Liberal Democrat Julia Garrett 106 2.0Decrease2.svg 10.8
Majority 1329 25.0Increase2.svg 12.9
Turnout 5326
Conservative hold Swing

Billesley

Billesley 2014
PartyCandidateVotes%±
Labour Alex Buchanan 2525 44.1 Increase2.svg 8.1
UKIP James Dalton 1499 26.2N/A
Conservative Andy Rudge 1480 25.9Decrease2.svg 8.6
Liberal Democrat Christopher Burgess 218 3.8Decrease2.svg 11.3
Majority 1026 17.9Increase2.svg 18.0
Turnout 5722
Labour hold Swing

Bordesley Green

Bordesley Green 2014
PartyCandidateVotes%±
Labour Mohammed Aikhlaq 3857 55.5 Increase2.svg 7.5
Liberal Democrat Mohammed Saeed 2310 33.2Decrease2.svg 5.0
UKIP Arthur Davis 386 5.6Increase2.svg 3.0
Green Alan Clawley 193 2.8Decrease2.svg 0.5
Conservative William Hordern 171 2.5Decrease2.svg 5.3
TUSC Theo Sharieff 35 0.5N/A
Majority 1547 22.3Increase2.svg 12.4
Turnout 6952
Labour hold Swing

Bournville

Bournville 2014
PartyCandidateVotes%±
Conservative Rob Sealey 3220 41.4 Increase2.svg 5.0
Labour Dee Smyth 2466 31.7Increase2.svg 0.6
UKIP Ash Mondair 883 11.4N/A
Green Cheryl Buxton-Sait 703 9.0Increase2.svg 3.3
Liberal Democrat Steve Haynes 295 3.8Decrease2.svg 17.9
Communities Against the Cuts Robert Nickson 203 2.6N/A
Majority 754 9.7Increase2.svg 4.3
Turnout 7770
Conservative hold Swing

Edgbaston

Edgbaston 2014
PartyCandidateVotes%±
Conservative Fergus Robinson 2,235
Labour Robbie Lea-Trengrouse 2,061
UKIP Keith Rowe 470
Liberal Democrat Kaneyalal Chudasama 313
Majority 174
Turnout

Erdington

Erdington 2014
PartyCandidateVotes%±
Conservative Robert Alden 2,743
Labour Co-op Keith Heron 1,699
UKIP Mel Ward 703
Liberal Democrat Philip Mills 115
TUSC Joe Foster 79
BNP Frances Waldron 66
Majority 1,044
Turnout

Hall Green

Hall Green 2014
PartyCandidateVotes%±
Labour Kerry Jenkins 2,317
Liberal Democrat Paula Smith 1,822
Conservative Steve Mee 1,046
Independent Bob Harvey 972
UKIP Vic East 814
Majority 495
Turnout

Handsworth Wood

Handsworth Wood 2014
PartyCandidateVotes%±
Labour Narinder Kooner 4,009
Conservative Sukhwinder Sungu 862
Green Eric Fairclough 438
Socialist Labour John Tyrrell 392
Liberal Democrat Paramjit Singh 200
Majority 3,147
Turnout

Harborne

Harborne 2014
PartyCandidateVotes%±
Conservative John Alden 2,816
Labour Nabila Zulfiqar 2,518
Green Phil Simpson 637
UKIP Charles Brecknell 574
Liberal Democrat Philip Banting 258
Majority 298
Turnout
Conservative hold Swing

Hodge Hill

Hodge Hill 2014
PartyCandidateVotes%±
Labour Fiona Williams 2,848
UKIP Adrian Duffen 1,246
Liberal Democrat Mohammad Azam 1,057
Conservative Cyrus Hodivala 495
Majority 1,602
Turnout

Kings Norton

Kings Norton 2014
PartyCandidateVotes%±
Conservative Simon Jevon 1,837
Labour Co-op Steve Bedser 1,722
UKIP Timothy Plumbe 1,222
Liberal Democrat Peter Lloyd 213
Communities Against the Cuts Christopher Hughes 207
Majority 115
Turnout

Kingstanding

Kingstanding 2014
PartyCandidateVotes%±
Conservative Ron Storer 1,578
Labour Desmond Hughes 1,546
UKIP Jan Higgins 1,128
BNP Frances Burke 92
Liberal Democrat Graham Lippiatt 77
Majority 32
Turnout

Ladywood

Ladywood 2014
PartyCandidateVotes%±
Labour Carl Rice 2,308
Conservative Tim Skidmore 655
UKIP John Hine 396
Green Hazel Clawley 371
Liberal Democrat Khondaker Alam 221
Majority 1,653
Turnout

Longbridge

Longbridge 2014
PartyCandidateVotes%±
Labour Co-op Ian Cruise 1,669
Conservative Derek Johnson 1,598
UKIP Steven Brookes 1,544
Green Aysha Turner 238
Liberal Democrat Kevin Hannon 157
TUSC Clive Walder 55
Majority 71
Turnout

N.B. Cruise left the Labour Party in August 2015 and now sits as an Independent. [3]

Lozells and East Handsworth

Lozells and East Handsworth 2014
PartyCandidateVotes%±
Labour Hendrina Quinnen 4,179
Liberal Democrat Talukder Hussain 953
Conservative Ravi Chumber 478
TUSC Alistair Wingate 307
Majority 3,226
Turnout

Moseley and Kings Heath

Moseley and Kings Heath 2014
PartyCandidateVotes%±
Labour Co-op Claire Spencer 3,099
Liberal Democrat Ernie Hendricks 1,963
Green Elly Stanton 768
Conservative Alistair Wingate 623
UKIP Alan Blumenthal 494
TUSC Michael Friel 494
Majority 3,226
Turnout

Nechells

Nechells 2014
PartyCandidateVotes%±
Labour Chauhdry Rashid 3,156
Conservative Abdi Elmi 574
Green Janet Assheton 556
Liberal Democrat Shazad Iqbal 307
Majority 2,582
Turnout

Northfield

Northfield 2014
PartyCandidateVotes%±
Conservative Randal Brew 2,697
Labour Co-op Carole Griffiths 1,768
UKIP Barrie Clews 1,366
Green Susan Pearce 308
Liberal Democrat Andrew Moles 145
Communities Against the Cuts Katherine Dunn 86
Majority 929
Turnout

Oscott

Oscott 2014
PartyCandidateVotes%±
Labour Barbara Dring 1,962
UKIP Roger Tempest 1,623
Conservative Graham Green 1,364
Green Harry Eyles 188
Liberal Democrat Nicholas Joliffe 117
Majority 339
Turnout

Perry Barr

Perry Barr 2014
PartyCandidateVotes%±
Liberal Democrat Karen Hamilton 2,437
Labour Co-op Sarfraiz Hussain 2,278
UKIP Charles Douglas 908
Conservative Georgina Chandler 392
Majority 159
Turnout

Quinton

Quinton 2014
PartyCandidateVotes%±
Labour Matthew Gregson 2,612
Conservative Ian Colpman 1,922
UKIP Laura Howard 1,096
Green Peter Beck 329
Liberal Democrat Ian Garrett 175
TUSC Nick Hart 34
Majority 690
Turnout

Selly Oak

Selly Oak 2014
PartyCandidateVotes%±
Labour Changese Khan 1,684 32 Decrease2.svg 12
Liberal Democrat David Radcliffe 1,609 31Decrease2.svg 1
Green Joe Rooney 711 14Increase2.svg 7
Conservative Monica Hardie 687 13Increase2.svg 1
UKIP Peter Hughes 498 10Increase2.svg 6
Majority 75
Turnout 5189
Labour gain from Liberal Democrat Swing

Shard End

Shard End 2014
PartyCandidateVotes%±
Labour John Cotton 1,791
UKIP Iain Roden 1,754
Conservative Roger King 446
Green Stephen Parker 301
BNP Kevin McHugh 134
Liberal Democrat Christopher Barber 132
TUSC Ken Marks 48
Majority 37
Turnout

Sheldon

Sheldon 2014
PartyCandidateVotes%±
Liberal Democrat Mike Ward 2,750
UKIP David Bridges 1,262
Labour Bob Collins 850
Conservative Keely Huxtable 338
TUSC Mark Andrews 80
Majority 1,488
Turnout

Soho

Soho 2014
PartyCandidateVotes%±
Labour Co-op Sharon Thompson 4,026
Conservative Robert Higginson 557
Liberal Democrat Cabdul Ruumi 353
Green Margaret Okole 310
Majority 3,469
Turnout

South Yardley

South Yardley 2014
PartyCandidateVotes%±
Liberal Democrat Zaker Choudhry 2,614
Labour Co-op Kate Booth 2,448
UKIP Albert Duffen 1,060
Conservative Julia Mackey 279
Independent Dave Willis 86
TUSC Siobhan Friel 38
Majority 3,469
Turnout

Sparkbrook

Sparkbrook 2014
PartyCandidateVotes%±
Labour Victoria Quinn 5,382
Liberal Democrat Asad Mehmood 750
Conservative John Turner 341
Majority 4,632
Turnout

Springfield

Springfield 2014
PartyCandidateVotes%±
Labour Mohammed Fazal 3,845
Liberal Democrat Tanveer Choudhry 2,641
UKIP Martin Barrett 395
Conservative David Agar 384
Majority 1,204
Turnout

Stechford and Yardley North

Stechford and Yardley North 2014
PartyCandidateVotes%±
Liberal Democrat Carol Jones 2,685
Labour Diane Donaldson 1,523
UKIP Graham Duffen 1,128
Conservative Robert Clark 271
Green Grant Bishop 164
Majority 1,162
Turnout

Stockland Green

Stockland Green 2014
PartyCandidateVotes%±
Labour Penny Holbrook 3,451
Conservative Daniel Caldicott 494
TUSC Ted Woodley 347
Liberal Democrat Franklyn Aaron 294
Majority 2,957
Turnout

Sutton Four Oaks

Sutton Four Oaks 2014
PartyCandidateVotes%±
Conservative Anne Underwood 3,628
UKIP Brendan Padmore 1,370
Labour Nick Preston 884
Green David Ratcliff 343
Liberal Democrat Hubert Duffy 302
Majority 2,258
Turnout

Sutton New Hall

Sutton New Hall 2014
PartyCandidateVotes%±
Conservative Ken Wood 2,659
UKIP Stewart Cotterill 1,429
Labour Ian Brindley 1,129
Liberal Democrat Trevor Holtom 296
Majority 1,230
Turnout

Sutton Trinity

Sutton Trinity 2014 (2)
PartyCandidateVotes%±
Conservative Ewan Mackey 2,985
Conservative Margaret Waddington 2,916
UKIP Marcus Brown 1,617
Labour Roger Barley 1,514
Labour Philip Innamorati 1,154
Liberal Democrat Sally Lippiatt 571
Majority
Turnout

Sutton Vesey

Sutton Vesey 2014
PartyCandidateVotes%±
Conservative Andrew Hardie 2,564
Labour Manish Puri 2,314
UKIP Albert Meehan 1,229
Liberal Democrat Lynn Williams 332
Majority 250
Turnout

Tyburn

Tyburn 2014
PartyCandidateVotes%±
Labour Lynda Clinton 2,171
Conservative Clifton Welch 864
Liberal Democrat Ann Holtom 647
TUSC James Redfern 379
Majority 1,307
Turnout

Washwood Heath

Washwood Heath 2014
PartyCandidateVotes%±
Labour Mohammed Idrees 6,598
Liberal Democrat Waheed Rafiq 537
Conservative Alexander Hall 352
Green John Bentley 374
Majority 6,061
Turnout

Weoley

Weoley 2014
PartyCandidateVotes%±
Conservative Peter Douglas 2,287
Labour Stephen Booton 1,780
UKIP Kevin Morris 1,205
Green Anna Masters 305
Liberal Democrat Sally Haynes-Preece 223
Majority 507
Turnout

Related Research Articles

One third of Birmingham City Council in the West Midlands, England is elected each year, followed by one year without election. Since the last boundary changes in 2004, 120 councillors have been elected from 40 wards.

Kirklees is a metropolitan borough of West Yorkshire, England. One third of the Council is elected each election year. Every fourth year there is no election. Since the last boundary changes in 2004, 69 councillors have been elected from 23 wards.

The 1998 Birmingham City Council election took place on 7 May 1998 to elect members of Birmingham City Council in the West Midlands, England. One third of the council was up for election and the Labour party kept overall control of the council.

2008 Birmingham City Council election

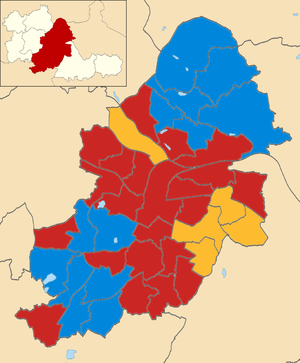
Elections to Birmingham City Council in England were held on 1 May 2008. One third of the council was up for election and the council stayed under no overall control as it had been since 2003.

The 1998 Derby City Council election took place on 7 May 1998 to elect members of Derby City Council in England. One third of the council was up for election and the Labour party kept overall control of the council.

The 1998 Wyre Forest District Council election took place on 7 May 1998 to elect members of Wyre Forest District Council in Worcestershire, England. One third of the council was up for election and the Labour party stayed in overall control of the council.

The 1998 Worcester City Council election took place on 7 May 1998 to elect members of Worcester District Council in Worcestershire, England. One third of the council was up for election and the Labour party stayed in overall control of the council.

The 2000 Worcester City Council election took place on 4 May 2000 to elect members of Worcester District Council in Worcestershire, England. One third of the council was up for election and the Labour party lost overall control of the council to no overall control.

The 2002 Worcester City Council election took place on 2 May 2002 to elect members of Worcester District Council in Worcestershire, England. One third of the council was up for election and the council stayed under no overall control.

2010 Birmingham City Council election

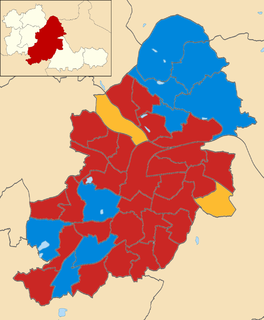
The 2010 Birmingham City Council Election took place on 6 May 2010 to elect members of Birmingham City Council in the West Midlands, England. One third of the council was up for election, one seat in each of the city's 40 council wards, with the election taking place at the same time as the general election.

2011 Sandwell Metropolitan Borough Council election

The 2011 Sandwell Metropolitan Borough Council election took place on 5 May 2011 to elect members of Sandwell Metropolitan Borough Council in the West Midlands, England. One third of the council was up for election and the Labour party stayed in overall control of the council.

2011 Walsall Metropolitan Borough Council election

The 2011 Walsall Metropolitan Borough Council election took place on 5 May 2011 to elect members of Walsall Metropolitan Borough Council in the West Midlands, England. One third of the council was up for election and the Conservative party lost overall control of the council to no overall control.

2014 Plymouth City Council election

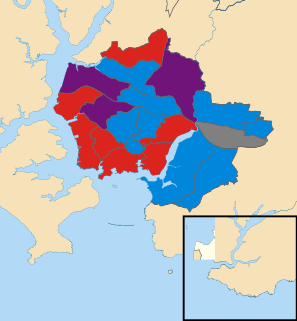
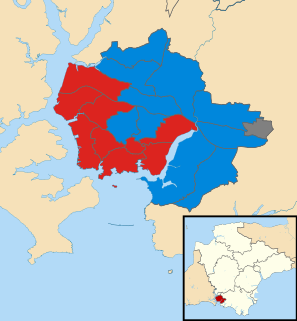
The 2014 Plymouth City Council election took place on 22 May 2014 to elect members of Plymouth City Council in England. This was on the same day as other local elections. The election was won by the Labour Party, who maintained their overall majority. The UK Independence Party gained representation on the council for the first time, and this was the only election in which the party won seats in Plymouth.

The 2014 Winchester City Council election took place on 22 May 2014 to elect members of Winchester City Council in England. This was on the same day as other local elections.

2015 Birmingham City Council election

The 2015 Birmingham City Council election took place on 7 May 2015 to elect members of Birmingham City Council in England. This was on the same day as other local elections, and also the 2015 UK General Election.

2015 Sunderland City Council election

The 2015 Sunderland City Council election took place on 7 May 2015 to elect members of Sunderland City Council in England. This was on the same day as other local elections, and the 2015 General Election.

2015 Plymouth City Council election

The 2015 Plymouth City Council election took place on 7 May 2015 to elect members of Plymouth City Council in England.

2014 Carlisle City Council election

The 2014 Carlisle City Council election took place on 22 May 2014 to elect members of Carlisle District Council in Cumbria, England. One third of the council was up for election and the Labour party stayed in overall control of the council.

2016 Birmingham City Council election

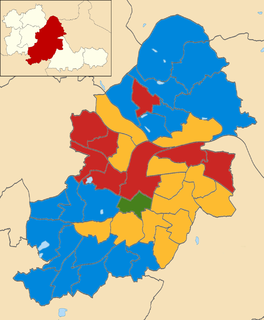
The 2016 Birmingham City Council election took place on 5 May 2016 to elect one third of the members of Birmingham City Council in England. The election was held on the same day as the election of a Police and Crime Commissioner for the West Midlands as part of the 2016 Police and Crime Commissioner elections.

Elections to Birmingham City Council in England were held in May 2007. One third of the council was up for election and the council stayed under no overall control as it had been since 2003.

References

  1. "England council results". BBC News. Retrieved 23 May 2014.
  2. "Election Results 2014". Birmingham City Council. Retrieved 5 April 2017.
  3. Neil Elkes (31 August 2015). "Councillor quits Birmingham Labour - with blast at 'indiscipline' and 'pettiness'". The Birmingham Mail. Retrieved 18 March 2018.