Worthing Borough Council election, 2014

Last updated

The 2014 Worthing Borough Council election took place on 22 May 2014 to elect members of Worthing Borough Council in West Sussex, England. The election took place on the same day as elections to the European Parliament, and saw one third of the council up for election. The Conservative Party retained overall control of the council, gaining four seats, but losing one to the UK Independence Party. The Liberal Democrats suffered five losses, including one to the Green Party, who gaining their first elected seats on the Council.

Worthing Town & Borough in England

Worthing is a large seaside town in England, and district with borough status in West Sussex. It is situated at the foot of the South Downs, 10 miles (16 km) west of Brighton, and 18 miles (29 km) east of the county town of Chichester. With an estimated population of 104,600 and an area of 12.5 square miles (32.37 km2) the borough is the second largest component of the Brighton/Worthing/Littlehampton conurbation, which makes it part of the 15th most populous urban area in the United Kingdom. Since 2010 northern parts of the borough, including the Worthing Downland Estate, have formed part of the South Downs National Park.

Borough status in the United Kingdom is granted by royal charter to local government districts in England, Wales and Northern Ireland. The status is purely honorary, and does not give any additional powers to the council or inhabitants of the district. In Scotland, similarly chartered communities were known as royal burghs, although the status is no longer granted.

West Sussex County of England

West Sussex is a county in the south of England, bordering East Sussex to the east, Hampshire to the west and Surrey to the north, and to the south the English Channel.

Contents

Election result

Worthing local election result 2014
PartySeatsGainsLossesNet gain/lossSeats %Votes %Votes+/−
  Conservative 10 4 1 +3 76.9 36.2 10365 -10.2
  UKIP 1 1 0 +1 7.7 28.9 8,277 +21.5
  Liberal Democrat 1 0 5 -5 7.7 12.6 3,600 -27.3
  Labour 0 0 0 0 0.0 11.7 3,348 +5.4
  Green 1 1 0 +1 7.7 10.6 3,049 +10.6

Ward results

Broadwater [1]
PartyCandidateVotes%±
Conservative Victoria Vaughan 754 34.2 -7.1
UKIP Elise Mason 691 31.3 +23.9
Labour John Turley 288 13.0 +2.6
Liberal Democrat John Apsey 272 12.3 -28.1
Green Richard Battson 202 9.2 +9.2
Majority 63 2.9 +2.0
Turnout 2,207 32.4 -30.6
Conservative hold Swing 15.5% Con to UKIP
Castle [1]
PartyCandidateVotes%±
Conservative Luke Proudfoot 702 32.2 -8.5
UKIP Dave Shipley 653 29.9 +29.9
Liberal Democrat Nick Wiltshire 414 18.9 -39.2
Labour Jim Deen 324 14.9 +14.9
Green Daniel Aherne 88 4.0 +4.0
Majority 49 2.2 +2.2
Turnout 2,181 35.1 -24.9
Conservative gain from Liberal Democrat Swing 15.4% LD to Con
Central [1]
PartyCandidateVotes%±
Green James Doyle 610 26.3 +26.3
Conservative Alex Harman 601 25.9 -10.5
UKIP Malcolm Milne 559 24.1 +17.6
Labour Peter Barnes 362 15.6 +4.1
Liberal Democrat Chris Allen 188 8.1 -34.8
Majority 9 0.4 +0.4
Turnout 2,320 31.8 -22.2
Green gain from Liberal Democrat Swing 30.6% LD to Green
Durrington [1]
PartyCandidateVotes%±
UKIP Susan Jelliss 526 33.6 +23.1
Conservative Steve Waight 494 31.5 -13.7
Liberal Democrat Jackie Cranefield 345 22.0 -21.7
Labour Guy Chadwick 152 9.7 +9.7
Green Fiona Ramasami 50 3.2 +3.2
Majority 32 2.0 +2.0
Turnout 1,567 34.7 -30.3
UKIP gain from Conservative Swing 18.4% Con to UKIP
Gaisford [1]
PartyCandidateVotes%±
Conservative Kevin Jenkins 874 37.4 -4.8
UKIP John Dawkins 537 22.9 +15.5
Green William Morris 317 15.8 +15.8
Labour Joe Thornton 312 13.3 +2.7
Liberal Democrat Dimitri Seirlis 300 12.8 -29.4
Majority 337 14.4 +14.4
Turnout 2,340 34.3 -29.7
Conservative gain from Liberal Democrat Swing 12.3% LD to Con
Goring [1]
PartyCandidateVotes%±
Conservative Mark Nolan 1,435 48.5 -8.1
UKIP Trevor England 817 27.6 +18.5
Labour Margaret Harris 305 10.3 -1.3
Green David Aherne 217 7.3 +7.3
Liberal Democrat Trudi Starling 186 6.3 -15.7
Majority 618 20.8 -13.9
Turnout 2,9620 43.8 -28.2
Conservative hold Swing 13.3% Con to UKIP
Heene [1]
PartyCandidateVotes%±
Conservative Diane Guest 714 34.0 -12.5
Green Stefan Sykes 507 24.2 +24.2
UKIP Rick Setford 498 23.7 +23.7
Labour Jill Guest 222 10.6 -4.5
Liberal Democrat Michael Finch 158 7.5 -30.3
Majority 207 9.9 +1.3
Turnout 2,099 32.8 -23.2
Conservative hold Swing 18.4% Con to Green
Marine [1]
PartyCandidateVotes%±
Conservative Edward Crouch 1,114 43.6 +15.4
UKIP Charles James 692 27.1 +20.5
Labour Alex Wagstaff 298 11.7 +11.7
Green Melanie Muir 264 10.3 +10.3
Liberal Democrat Pat Izod 189 7.4 -10.9
Majority 422
Turnout 2,557 38.9 -26.1
Conservative hold Swing 2.6% Con to UKIP
Northbrook [1]
PartyCandidateVotes%±
Conservative Sean McDonald 355 35.8 -9.8
UKIP Mike Jelliss 328 33.1 +33.1
Liberal Democrat Diane Jones 169 17.0 -36.6
Labour Philip Dufty 86 8.7 +8.7
Green Katherine Kohl 54 5.4 +5.4
Majority 27 2.7 +2.7
Turnout 992 27.9 -25.1
Conservative gain from Liberal Democrat Swing 21.5% Con to UKIP
Offington [1]
PartyCandidateVotes%±
Conservative Louise Murphy 1,240 47.9 -8.3
UKIP Toby Brothers 798 30.8 +20.1
Liberal Democrat Linda Williams 194 7.5 -16.7
Labour Ann Saunders 191 7.4 -0.9
Green Stephen Nethercott-Cable 164 6.3 +6.3
Majority 442 17.1 -14.0
Turnout 2,587 40.8 -31.2
Conservative hold Swing 14.2% Con to UKIP
Salvington [1]
PartyCandidateVotes%±
Conservative Heather Mercer 1,011 39.0 -11.6
UKIP Pauline James 988 38.2 +25.5
Labour David Lace 236 9.1 +9.1
Green Julia Owen 181 7.0 +7.0
Liberal Democrat Val Capon 173 6.9 -28.9
Majority 23 0.9 -13.9
Turnout 2,589 36.4 -27.6
Conservative hold Swing 18.6% Con to UKIP
Selden [1]
PartyCandidateVotes%±
Conservative Callum Buxton 601 30.4 -5.4
UKIP John Harwood 526 26.6 +19.5
Labour Mike Barrett 354 17.9 +5.5
Liberal Democrat Yvonne Leonard 298 15.1 -30.6
Green Valerie Ellis 199 10.1 +10.1
Majority 75 3.8 +3.8
Turnout 1,978 31.4 -28.6
Conservative gain from Liberal Democrat Swing
Tarring [1]
PartyCandidateVotes%±
Liberal Democrat Bob Smytherman 714 31.6 -20.9
UKIP Adrian Price 664 29.4 +18.1
Conservative David Messer 470 20.8 -14.5
Labour Michelle Forsyth 218 9.6 +9.6
Green Ross Johnson 196 8.7 +8.7
Majority 50 2.2 -15.0
Turnout 2,262 34.9 -29.1
Liberal Democrat hold Swing 19.5% LD to UKIP

Related Research Articles

The 2002 Worthing Borough Council election took place on 2 May 2002 to elect members of Worthing Borough Council in West Sussex, England. One third of the council was up for election and the Liberal Democrats gained overall control of the council from the Conservative party. Overall turnout was 30.67%.

The 2003 Worthing Borough Council election took place on 1 May 2003 to elect members of Worthing Borough Council in West Sussex, England. One third of the council was up for election and the Liberal Democrats lost overall control of the council to no overall control. Overall turnout was 28.61%.

2004 Worthing Borough Council election

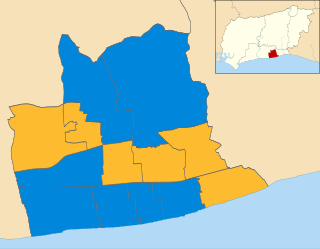
The 2004 Worthing Borough Council election took place on 10 June 2004 to elect members of Worthing Borough Council in West Sussex, England. The whole council was up for election with boundary changes since the last election 2003 increasing the number of seats by 1. The Conservative party gained overall control of the council from no overall control. Overall turnout was 38.23%.

2006 Worthing Borough Council election

The 2006 Worthing Borough Council election took place on 4 May 2006 to elect members of Worthing Borough Council in West Sussex, England. One third of the council was up for election and the Conservative party stayed in overall control of the council.

2007 Worthing Borough Council election

The 2007 Worthing Borough Council election took place on 3 May 2007 to elect members of Worthing Borough Council in West Sussex, England. One third of the council was up for election and the Conservative party stayed in overall control of the council.

2008 Worthing Borough Council election

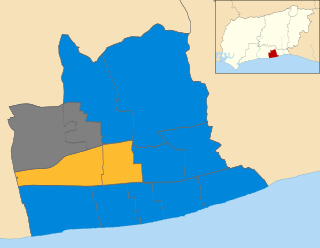
The 2008 Worthing Borough Council election took place on 1 May 2008 to elect members of Worthing Borough Council in West Sussex, England. One third of the council was up for election and the Conservative party stayed in overall control of the council. Overall turnout was 35%.

The 2000 Pendle Borough Council election took place on 4 May 2000 to elect members of Pendle Borough Council in Lancashire, England. One third of the council was up for election and the council stayed under no overall control.

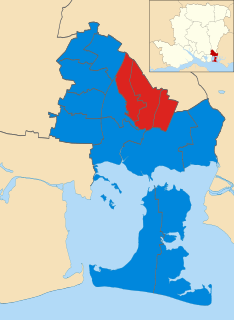
The 2002 Colchester Borough Council election took place on 2 May 2002 to elect members of Colchester Borough Council in Essex, England. This was the same day as the other 2002 local elections in the United Kingdom. Due to boundary changes, every seat was up for election and the council stayed under no overall control.

2013 West Sussex County Council election

The West Sussex County Council election, 2013 took place on 2 May 2013, as part of the United Kingdom local elections, 2013. All 71 electoral divisions were up for election, which returned one county councillor each by first-past-the-post voting for a four-year term of office. At this election, the Conservative Party was seeking to retain overall control of the council, and the Liberal Democrats to maintain their position as the main opposition party.

2004 Colchester Borough Council election

The 2004 Colchester Borough Council election took place on 10 June 2004 to elect members of Colchester Borough Council in Essex, England. This was the same day as the other 2004 United Kingdom local elections and as the 2004 European Parliament Elections. One third of the seats were up for election and the council stayed under no overall control.

The 2014 Fareham Borough Council elections took place on 22 May 2014 to elect half the members of Fareham Borough Council in Hampshire, England. The Conservative Party are currently the largest party on the council. The last time these seats were contested was in 2010.

2014 Enfield London Borough Council election

The 2014 Enfield Council election took place on 22 May 2014 to elect members of Enfield London Borough Council in London, England. The whole council was up for election and the Labour party retained overall control of the council, increasing their majority over the Conservative party by five seats.

2014 Weymouth and Portland Borough Council election

The 2014 Weymouth and Portland Borough Council election took place on 22 May 2014 to elect members of Weymouth and Portland Borough Council in England. This was on the same day as other local elections.

2003 Havant Borough Council election

The 2003 Havant Borough Council election took place on 1 May 2003 to elect members of Havant Borough Council in Hampshire, England. One third of the council was up for election and the Conservative party stayed in overall control of the council.

2010 Havant Borough Council election

The 2010 Havant Borough Council election took place on 6 May 2010 to elect members of Havant Borough Council in Hampshire, England. One third of the council was up for election and the Conservative party stayed in overall control of the council.

2012 Havant Borough Council election

The 2012 Havant Borough Council election took place on 3 May 2012 to elect members of Havant Borough Council in Hampshire, England. One third of the council was up for election and the Conservative party stayed in overall control of the council.

2007 Castle Point Borough Council election

The 2007 Castle Point Borough Council election took place on 3 May 2007 to elect members of Castle Point Borough Council in Essex, England. One third of the council was up for election and the Conservative party stayed in overall control of the council.

The 1964 Barnet Council election took place on 7 May 1964 to elect members of Barnet London Borough Council in London, England. The whole council was up for election and the Conservative party gained control of the council.

The 1964 Greenwich Council election took place on 7 May 1964 to elect members of Greenwich London Borough Council in London, England. The whole council was up for election and the Labour party gained control of the council.

The 1964 Hammersmith Council election took place on 7 May 1964 to elect members of Hammersmith London Borough Council in London, England. The whole council was up for election and the Labour party gained control of the council.

References

  1. 1 2 3 4 5 6 7 8 9 10 11 12 13 "2014 Election Results". Adur and Worthing Councils. Retrieved 7 May 2018.