West Sussex County Council election, 2001

Last updated

Elections to West Sussex County Council were held on 7 June 2001, alongside a parliamentary general election. The whole council was up for election, and the Conservative Party remained in control of the council. Turnout across the county ranged from 42.7% in Broadfield to 69.6% in Midhurst, with the county average standing at 60.8%. [1]

West Sussex County Council British administrative authority

West Sussex County Council (WSCC) is the authority that governs the non-metropolitan county of West Sussex. The county also contains 7 district and borough councils, and 159 town, parish and neighbourhood councils. The county council has 71 elected councillors. The Chief Executive and her/his team of Executive Directors are responsible for the day-to-day running of the council.

Conservative Party (UK) Political party in the United Kingdom

The Conservative Party, officially the Conservative and Unionist Party, is a centre-right political party in the United Kingdom. The governing party since 2010, it is the largest in the House of Commons, with 313 Members of Parliament, and also has 249 members of the House of Lords, 18 members of the European Parliament, 31 Members of the Scottish Parliament, 12 members of the Welsh Assembly, eight members of the London Assembly and 8,916 local councillors.

Contents

Election Result

West Sussex County Council Election Result 2001
PartySeatsGainsLossesNet gain/lossSeats %Votes %Votes+/−
  Conservative 4262+459.243.8155,338
  Liberal Democrat 1827-525.432.1113,902
  Labour 1120+215.522.479,370
  Green 00000.00.72,527
  Independent 001-10.00.62,155
  UKIP 00000.00.2876
  Socialist Labour 00000.00.1232
  Monster Raving Loony 00000.00.0113

Results by electoral division

Adur

Kingston Buci
PartyCandidateVotes%±
Conservative David Ashley1,55436.4
Labour Co-op David Munnery1,37932.4
Liberal Democrat Sydney Little1,32831.2
Majority1754.0
Turnout 4,26160.3
Conservative gain from Liberal Democrat Swing
Lancing
PartyCandidateVotes%±
Conservative Anthony Nicklen1,83437.5
Liberal Democrat Keith Dollemore1,77436.3
Labour David Rubin1,28426.2
Majority601.2
Turnout 4,89258.7
Conservative gain from Liberal Democrat Swing
Saltings
PartyCandidateVotes%±
Conservative Peter Mockridge2,53346.7
Labour Co-op Jeanette White1,58529.2
Liberal Democrat Patrick Beresford1,30224.0
Majority94817.8
Turnout 5,42060.2
Conservative hold Swing
Shoreham
PartyCandidateVotes%±
Conservative Clive Williams2,52644.9
Labour Co-op Geoffrey Howitt1,91634.0
Liberal Democrat Elisa Vaughan1,18621.1
Majority61010.9
Turnout 5,62865.4
Conservative hold Swing
Sompting
PartyCandidateVotes%±
Conservative Vilna Woolhead1,43036.1
Labour Peter Berry1,29832.8
Liberal Democrat Malcolm Brookes1,23531.1
Majority1323.3
Turnout 3,96359.5
Conservative gain from Liberal Democrat Swing
Southwick
PartyCandidateVotes%±
Labour Co-op Brian Whipp1,73841.4
Conservative Robert Dunn1,58037.7
Liberal Democrat John Hilditch87620.9
Majority1583.7
Turnout 4,19461.2
Labour Co-op hold Swing

Arun

Arun East
PartyCandidateVotes%±
Conservative Christopher Sedgwick2,88066.3
Liberal Democrat Margaret Munro1,44233.4
Majority1,43833.2
Turnout 4,32267.9
Conservative hold Swing
Arundel and Angmering
PartyCandidateVotes%±
Conservative Oliver Wingrove2,59851.8
Liberal Democrat Ivan Olney2,41848.2
Majority1803.6
Turnout 5,01661.2
Conservative hold Swing
Bersted
PartyCandidateVotes%±
Labour Simon Holland1,92836.8
Conservative Bernard Widger1,84035.1
Liberal Democrat Simon McDougall1,47028.1
Majority881.7
Turnout 5,23853.9
Labour gain from Liberal Democrat Swing
Bognor Regis
PartyCandidateVotes%±
Conservative Robin Brown2,41646.7
Liberal Democrat Kenneth Scutt1,72333.3
Labour Gail Walker1,02919.9
Majority69313.4
Turnout 5,16858.4
Conservative hold Swing
Felpham
PartyCandidateVotes%±
Conservative Alan-Jeffrey Stainton2,03540.2
Independent George Stride1,38327.3
Labour Melanie Webb84316.7
Liberal Democrat John Barstow79915.8
Majority65212.9
Turnout 5,06064.2
Conservative gain from Independent Swing
Fontwell
PartyCandidateVotes%±
Conservative Harold Hall2,79253.0
Liberal Democrat Stephen White1,34625.5
Labour Andrew Holliday1,13321.5
Majority1,44627.5
Turnout 5,27162.2
Conservative hold Swing
Hotham
PartyCandidateVotes%±
Labour Michael Jones1,39336.6
Conservative Hilary Flynn1,24632.7
Liberal Democrat Catherine Morrish1,16630.6
Majority1473.9
Turnout 3,80550.4
Labour gain from Liberal Democrat Swing
Littlehampton North
PartyCandidateVotes%±
Labour George O'Neill1,83848.3
Conservative Marian Ayres1,28633.8
Liberal Democrat David Jones67817.8
Majority55214.5
Turnout 3,80254.1
Labour hold Swing
Littlehampton Town
PartyCandidateVotes%±
Conservative Graham Tyler1,83835.6
Labour Alan Butcher1,71733.3
Liberal Democrat Nicholas Wiltshire1,35926.3
Independent Scott Horwood2444.7
Majority1212.3
Turnout 5,15853.1
Conservative hold Swing
Middleton
PartyCandidateVotes%±
Conservative Christina Freeman2,49451.2
Liberal Democrat Roslyn Kissell1,26626.0
Labour Tiggy Ayoub1,10722.7
Majority1,22825.2
Turnout 4,86760.0
Conservative hold Swing
Nyetimber
PartyCandidateVotes%±
Conservative Michael Coleman2,98047.9
Liberal Democrat Francis Oppler1,55725.0
Labour Pauline Nash1,39722.5
Independent Peter Cain2854.9
Majority1,42322.9
Turnout 6,21963.3
Conservative hold Swing
Preston Manor
PartyCandidateVotes%±
Conservative Peter Moor3,32158.9
Liberal Democrat John Richards2,31541.1
Majority1,00617.8
Turnout 5,63662.8
Conservative hold Swing
Rustington West
PartyCandidateVotes%±
Liberal Democrat James Walsh2,33241.1
Conservative David Marchant2,28040.2
Labour Edward Walsh1,05618.6
Majority520.9
Turnout 5,66864.6
Liberal Democrat hold Swing

Chichester

Bourne
PartyCandidateVotes%±
Conservative Thomas Dunn2,50146.1
Liberal Democrat Karen Juniper1,24823.0
Labour Oona Hickson1,06419.6
Green Judith Barr2504.6
UKIP Alicia Denny2033.7
Independent Mark Hoar1633.0
Majority1,25323.1
Turnout 5,42962.3
Conservative hold Swing
Chichester East
PartyCandidateVotes%±
Liberal Democrat Michael Hall1,66140.9
Conservative John Roffey1,14528.2
Labour Benjamin Earnshaw-Mansell90022.2
Green Carolyn Finbow1794.4
UKIP Elizabeth Bygrave1774.4
Majority51612.7
Turnout 4,06257.4
Liberal Democrat hold Swing
Chichester North
PartyCandidateVotes%±
Conservative Alan Phillips2,20346.1
Liberal Democrat Barry Fletcher1,80037.6
Labour Selma Barkham58012.1
Green Valerie Briginshaw1994.2
Majority4038.5
Turnout 4,78266.5
Conservative hold Swing
Chichester South
PartyCandidateVotes%±
Conservative Anthony Dignum1,80335.2
Liberal Democrat Alan Chaplin1,79835.1
Labour John Bennett1,07321.0
Green Josephine Eckhard2234.4
UKIP Nigel Muir2234.4
Majority50.1
Turnout 5,12062.6
Conservative gain from Liberal Democrat Swing
Chichester West
PartyCandidateVotes%±
Conservative Mary-Louise Goldsmith2,15839.7
Liberal Democrat David Siggs1,90435.0
Labour Ian Edwards86115.8
UKIP Douglas Denny2735.0
Green Gavin Graham2464.5
Majority2544.7
Turnout 5,44265.1
Conservative hold Swing
Fernhurst
PartyCandidateVotes%±
Conservative Terence Pemberton2,96056.0
Liberal Democrat William Quinn1,57629.8
Labour Bernard Hollowood75014.2
Majority1,38426.2
Turnout 5,28666.0
Conservative hold Swing
Midhurst
PartyCandidateVotes%±
Conservative Colin Walker2,95749.3
Liberal Democrat Andrew Shaxson2,35839.3
Labour Andrew Young68311.4
Majority59910.0
Turnout 5,99869.6
Conservative hold Swing
Petworth
PartyCandidateVotes%±
Conservative Sarah Greenwell3,44758.6
Liberal Democrat John Ireland1,71629.2
Labour Dave Morrison72312.3
Majority1,73129.4
Turnout 5,88665.7
Conservative hold Swing
Selsey and Sidlesham
PartyCandidateVotes%±
Conservative Peter Jones2,63947.4
Labour Ian Bell1,85833.4
Liberal Democrat Leonard Eyles1,07019.2
Majority78114.0
Turnout 5,56762.3
Conservative hold Swing
The Witterings
PartyCandidateVotes%±
Conservative John Daws-Chew3,28354.8
Liberal Democrat Roger Tilbury1,47724.7
Labour Patrick O'Sullivan1,22920.5
Majority1,80630.1
Turnout 5,98963.2
Conservative hold Swing

Crawley

Bewbush
PartyCandidateVotes%±
Labour Janet Scully2,28260.2
Conservative Matthew Cowdrey95025.1
Liberal Democrat Barry Hamilton55714.7
Majority1,33235.1
Turnout 3,78945.8
Labour hold Swing
Broadfield
PartyCandidateVotes%±
Labour Michael Briggs2,01055.2
Conservative David Bowen1,01627.9
Liberal Democrat Howard Llewelyn47713.1
Socialist Labour Martyn Badger1363.7
Majority99427.3
Turnout 3,63942.7
Labour hold Swing
Furnace Green
PartyCandidateVotes%±
Conservative Henry Smith3,48444.8
Labour Ian Irvine2,95138.0
Liberal Democrat Victoria Jones1,33717.2
Majority5336.8
Turnout 7,77258.8
Conservative hold Swing
Gossops Green
PartyCandidateVotes%±
Labour Christopher Mullins2,04051.3
Conservative Geoffrey Clarke1,34733.9
Liberal Democrat Darren Wise59214.9
Majority69317.4
Turnout 3,97955.5
Labour hold Swing
Ifield
PartyCandidateVotes%±
Labour John Mortimer1,88855.9
Conservative Christina Belben94027.8
Liberal Democrat Edward Reay54916.3
Majority94828.1
Turnout 3,37755.0
Labour hold Swing
Langley Green
PartyCandidateVotes%±
Labour James Smith2,48365.0
Conservative Lee Burke81221.2
Liberal Democrat Kevin Osborne52713.8
Majority1,67143.8
Turnout 3,82273.6
Labour hold Swing
Northgate Three Bridges
PartyCandidateVotes%±
Labour William Buck2,20049.4
Conservative Margaret Flatt1,29029.0
Liberal Democrat Gordon Robson96421.6
Majority91020.4
Turnout 4,45458.0
Labour hold Swing
Pound Hill
PartyCandidateVotes%±
Conservative David Dewdney2,27348.5
Labour David Shreeves1,51732.4
Liberal Democrat Nigel Aldridge81317.4
Independent Richard Symonds801.7
Majority75616.1
Turnout 4,68353.4
Conservative hold Swing
Tilgate
PartyCandidateVotes%±
Labour Colin Lloyd2,26656.1
Conservative Corinne Bowen1,08626.9
Liberal Democrat Roger McMurry59114.6
Socialist Labour Derek Isaacs962.4
Majority1,18029.2
Turnout 4,03954.6
Labour hold Swing

Horsham

Billingshurst
PartyCandidateVotes%±
Conservative Owen Davies1,98544.0
Liberal Democrat Geoffrey Lawes1,61735.8
Labour Peter Scott90920.2
Majority3688.2
Turnout 4,51162.9
Conservative hold Swing
Henfield
PartyCandidateVotes%±
Conservative Lionel Barnard3,27859.7
Labour Richard Hanford1,19321.7
Liberal Democrat Laurence Price1,01818.5
Majority2,08538.0
Turnout 5,48963.6
Conservative hold Swing
Holbrook
PartyCandidateVotes%±
Conservative Geoffrey Wilson3,76851.9
Liberal Democrat David Sheldon2,21730.6
Labour Raymond Chapman1,27017.5
Majority1,55121.3
Turnout 7,25569.2
Conservative hold Swing
Hurst
PartyCandidateVotes%±
Liberal Democrat Nigel Dennis2,27953.4
Conservative Christian Mitchell1,51835.6
Labour Philip Gander47011.0
Majority76117.8
Turnout 4,26767.8
Liberal Democrat hold Swing
Pulborough
PartyCandidateVotes%±
Conservative Patricia Arculus4,02862.5
Liberal Democrat Sarah Barstow1,46722.8
Labour Edward Pitt94914.7
Majority2,56139.7
Turnout 6,44467.4
Conservative hold Swing
Riverside
PartyCandidateVotes%±
Liberal Democrat Morwen Millson2,61150.6
Conservative Barbara Palmer1,80435.0
Labour Josephine Battersby74414.4
Majority80715.6
Turnout 5,15961.3
Liberal Democrat hold Swing
Roffey
PartyCandidateVotes%±
Liberal Democrat Jacobus Clausen2,49546.8
Conservative Hasan Imam2,04138.3
Labour Mervyn Hamilton79614.9
Majority4548.5
Turnout 5,33260.6
Liberal Democrat hold Swing
Southwater
PartyCandidateVotes%±
Conservative Brian Watson2,98343.5
Liberal Democrat Peter Stainton2,92642.6
Labour Diane Dumbrill95213.9
Majority570.9
Turnout 6,86162.8
Conservative gain from Liberal Democrat Swing
Steyning
PartyCandidateVotes%±
Liberal Democrat Derek Deedman2,29041.9
Conservative Michael Willett2,28441.8
Labour John Ridley88616.2
Majority60.1
Turnout 5,46064.1
Liberal Democrat gain from Conservative Swing
Storrington
PartyCandidateVotes%±
Conservative Frank Wilkinson2,91955.8
Liberal Democrat John Hewitt1,37426.3
Labour Phillipa Banks93417.9
Majority1,54529.5
Turnout 5,22764.9
Conservative hold Swing
Warnham
PartyCandidateVotes%±
Conservative Michael Hodgson2,48853.3
Liberal Democrat Richard Aris1,42430.5
Labour Richard Corthine75316.1
Majority1,06422.8
Turnout 4,66564.5
Conservative hold Swing

Mid Sussex

Burgess Hill Central
PartyCandidateVotes%±
Liberal Democrat Angela Chapman2,99849.8
Conservative Edward Holland1,96532.7
Labour Ann Bridges1,02917.1
Majority1,03317.1
Turnout 6,01861.2
Liberal Democrat hold Swing
Burgess Hill East
PartyCandidateVotes%±
Liberal Democrat Tony Balsdon2,35549.4
Conservative Christopher Hersey1,76837.1
Labour Nigel Sweet57512.1
Majority58712.3
Turnout 4,76964.8
Liberal Democrat hold Swing
Cuckfield Rural
PartyCandidateVotes%±
Conservative Michael Dennis2,75851.8
Liberal Democrat Diane Shevels1,54329.0
Labour Frederick Harrison98218.5
Majority1,21522.8
Turnout 5,32268.4
Conservative hold Swing
East Grinstead East
PartyCandidateVotes%±
Liberal Democrat Margaret Collins2,29049.5
Conservative Roger Horman1,81339.2
Labour Duncan Irvine47810.3
Majority47710.3
Turnout 4,62361.6
Liberal Democrat hold Swing
East Grinstead South
PartyCandidateVotes%±
Liberal Democrat Andrew Brock2,32146.3
Conservative Allan Beal2,15843.0
Labour Jeremey Tomlinson4999.9
Majority1630.3
Turnout 5,01664.6
Liberal Democrat hold Swing
Hassocks and Burgess Hill West
PartyCandidateVotes%±
Liberal Democrat Colin Wilsdon2,82743.5
Conservative Andrew Barrett-Miles2,62140.3
Labour Arleene Piercy1,01415.6
Majority2063.2
Turnout 6,50363.4
Liberal Democrat hold Swing
Haywards Heath East
PartyCandidateVotes%±
Conservative Joan Gayler1,74436.7
Labour Patrick Henry1,67535.3
Liberal Democrat Trevor Harman1,30227.5
Majority691.4
Turnout 4,74365.4
Conservative hold Swing
Haywards Heath West
PartyCandidateVotes%±
Liberal Democrat Brian Hall2,07542.3
Conservative Clive Chapman1,89638.7
Labour Rosemary Irvine78816.1
Monster Raving Loony Peter Berry1132.3
Majority1793.7
Turnout 4,90167.3
Liberal Democrat hold Swing
Imberdown
PartyCandidateVotes%±
Conservative Phillip Coote3,15748.5
Liberal Democrat Janette Wilson2,26934.8
Labour John Crawford1,03515.9
Majority88813.6
Turnout 6,51463.0
Conservative hold Swing
Lindfield
PartyCandidateVotes%±
Conservative Margaret Johnson2,51548.6
Liberal Democrat Anne-Marie Lucraft1,94337.5
Labour Pascal Atkins68413.2
Majority57211.1
Turnout 5,17769.4
Conservative hold Swing
Mid Sussex North
PartyCandidateVotes%±
Conservative William Acraman2,81353.3
Liberal Democrat Philip Brown1,43727.2
Labour Thaddeus Dell97118.4
Majority1,37626.1
Turnout 5,28263.1
Conservative hold Swing
Mid Sussex South
PartyCandidateVotes%±
Conservative John Oliver2,52553.9
Liberal Democrat Anthony Davies1,35929.0
Labour Dawn Houghton74716.0
Majority1,16624.9
Turnout 4,68366.4
Conservative hold Swing

Worthing

Broadwater
PartyCandidateVotes%±
Liberal Democrat Donald Lissenburg1,92748.2
Conservative Simon Paskin1,29632.4
Labour Gillian Thompson77519.4
Majority63115.8
Turnout 3,99854.3
Liberal Democrat hold Swing
Cissbury
PartyCandidateVotes%±
Conservative Collingwood O'Neill2,90654.4
Liberal Democrat Paul Daniels1,67931.4
Labour Ann Saunders75614.2
Majority1,22723.0
Turnout 5,34163.1
Conservative hold Swing
Durrington
PartyCandidateVotes%±
Liberal Democrat Nicholas Rodgers2,63959.1
Conservative David Goodyer1,54934.7
Green Lilian Taylor2786.2
Majority1,09024.4
Turnout 4,46654.2
Liberal Democrat hold Swing
East Worthing
PartyCandidateVotes%±
Liberal Democrat Irene Richards1,56337.6
Conservative Graham Fabes1,39533.5
Labour John Turley96523.2
Green Coral Pfluger2365.7
Majority1684.1
Turnout 4,15952.7
Liberal Democrat hold Swing
Goring-by-Sea
PartyCandidateVotes%±
Conservative Steven Waight2,91756.2
Liberal Democrat Robert Smytherman1,44927.9
Labour Brian Gill82315.9
Majority1,46828.3
Turnout 5,18965.4
Conservative hold Swing
Maybridge
PartyCandidateVotes%±
Liberal Democrat Robin Rogers1,54338.6
Conservative Andrew Garrett1,51337.8
Labour Antony Bignell94623.6
Majority300.8
Turnout 4,00256.4
Liberal Democrat hold Swing
Richmond
PartyCandidateVotes%±
Liberal Democrat Cecil Golds1,27839.1
Conservative Noël Atkins1,23637.8
Labour Richard Battson58117.8
Green Derek Colkett1745.3
Majority421.3
Turnout 3,26946.3
Liberal Democrat gain from Conservative Swing
Salvington
PartyCandidateVotes%±
Conservative Clement Stevens2,14746.1
Liberal Democrat Sheila Player1,56133.5
Labour Peter Barnes71315.3
Green Joan Glass2335.0
Majority58612.6
Turnout 4,65459.4
Conservative hold Swing
West Parade
PartyCandidateVotes%±
Conservative John Livermore2,53050.4
Liberal Democrat James Doyle1,34326.7
Labour Barrie Slater80816.1
Green Lucielle Cokett3406.8
Majority1,18723.7
Turnout 5,02158.6
Conservative hold Swing
West Tarring
PartyCandidateVotes%±
Liberal Democrat Peter Green1,89647.4
Conservative Arthur Andrews1,26331.6
Labour Ian Sandell67116.8
Green Marie Hillcoat1694.2
Majority63315.8
Turnout 3,99958.6
Liberal Democrat hold Swing

Related Research Articles

Adur District Non-metropolitan district in England

Adur is a local government district of West Sussex, England. It is named after its main river and is historically part of the English county of Sussex. The council is based in Shoreham-by-Sea and the district has a population of 59,627 according to the 2001 census.

Arun District Non-metropolitan district in England

Arun is a local government district in West Sussex, England. It contains the towns of Arundel, Bognor Regis and Littlehampton, and takes its name from the River Arun, which runs through the centre of the district.

Horsham District Non-metropolitan district in England

Horsham is a local government district in West Sussex, England. Its council is based in Horsham. The district borders those of Crawley, Mid Sussex, Mole Valley, Chichester, Arun and Adur.

Half of Adur District Council in West Sussex, England is elected every two years. Until 2003, the council was elected by thirds. Since the last boundary changes in 2004, 29 councillors have been elected from 14 wards.

Coombes village in the United Kingdom

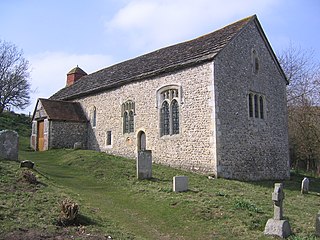
Coombes is a hamlet and civil parish in the Adur District of West Sussex, England. The village is in the Adur Valley 2 miles (3.2 km) northwest of Shoreham-by-Sea.

West Sussex County Council in England is elected every four years.

The 1998 Adur District Council election took place on 7 May 1998 to elect members of Adur District Council in West Sussex, England. One third of the council was up for election and the Liberal Democrats stayed in overall control of the council.

The 1998 Adur District Council election took place on 6 May 1999 to elect members of Adur District Council in West Sussex, England. One third of the council was up for election and the Liberal Democrat party lost overall control of the council to no overall control.

2008 Adur District Council election

Elections to Adur District Council in West Sussex, England were held on 1 May 2008. Half of the council was up for election and the Conservative party held overall control of the council.

Lancing (electoral division)

Lancing is an electoral division of West Sussex in the United Kingdom, and returns one member to sit on West Sussex County Council.

Saltings (electoral division)

Saltings is an electoral division of West Sussex in the United Kingdom, and returns one member to sit on West Sussex County Council.

Shoreham (electoral division) human settlement in United Kingdom

Shoreham is an electoral division of West Sussex in the United Kingdom, and returns one member to sit on West Sussex County Council.

Sompting & North Lancing (electoral division)

Sompting & North Lancing is an electoral division of West Sussex in the United Kingdom, and returns one member to sit on the West Sussex County Council.

Southwick (electoral division) electoral ward of Sunderland City Council

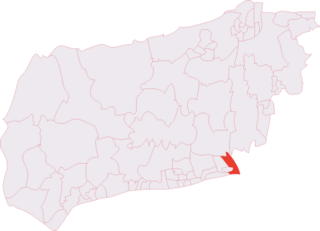
Southwick is an electoral division of West Sussex in the United Kingdom, and returns one member to sit on West Sussex County Council.

2010 Adur District Council election

The 2010 Adur District Council election took place on 6 May 2010 to elect members of Adur District Council in West Sussex, England. Half of the council was up for election and the Conservative party stayed in overall control of the council.

2012 Adur District Council election

The 2012 Adur District Council elections took place on 3 May 2012 to elect members of Adur District Council in West Sussex, England. Half of the council was up for election, and the Conservative Party remained in overall control of the council.

2013 West Sussex County Council election

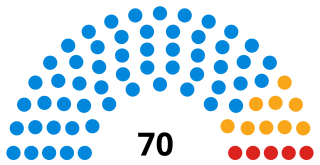
The West Sussex County Council election, 2013 took place on 2 May 2013, as part of the United Kingdom local elections, 2013. All 71 electoral divisions were up for election, which returned one county councillor each by first-past-the-post voting for a four-year term of office. At this election, the Conservative Party was seeking to retain overall control of the council, and the Liberal Democrats to maintain their position as the main opposition party.

2016 Adur District Council election

The 2016 Adur District Council elections took place on 5 May 2016 to elect members of Adur District Council in West Sussex, England. Half of the council was up for election, and the Conservative Party remained in overall control of the council. The Labour Party trebled their number of seats from one to three.

2018 Adur District Council election

The 2018 Adur District Council elections took place on 3 May 2018 to elect members of Adur District Council in West Sussex, England. The election saw half of the Council's 29 seats up for election, and resulted in the Conservative Party retaining their majority on the council. Labour gained 4 seats to replace UKIP as the official opposition on the Council, who lost all the seats they were defending from 2014.

References

  1. "COUNTY COUNCIL ELECTION RESULTS 2001". West Sussex County Council. 8 June 2001. Retrieved 2 March 2012.