Adur District Council election, 2018

Last updated
Map of the results of the 2018 Adur District Council council election. Conservatives in blue, Labour in red and Independent in grey. Adur UK local election 2018 map.svg
Map of the results of the 2018 Adur District Council council election. Conservatives in blue, Labour in red and Independent in grey.

The 2018 Adur District Council elections took place on 3 May 2018 to elect members of Adur District Council in West Sussex, England. The election saw half of the Council's 29 seats up for election, and resulted in the Conservative Party retaining their majority on the council. Labour gained 4 seats to replace UKIP as the official opposition on the Council, who lost all the seats they were defending from 2014.

Non-metropolitan district Type of local government district in England

Non-metropolitan districts, or colloquially "shire districts", are a type of local government district in England. As created, they are sub-divisions of non-metropolitan counties in a two-tier arrangement.

West Sussex County of England

West Sussex is a county in the south of England, bordering East Sussex to the east, Hampshire to the west and Surrey to the north, and to the south the English Channel.

England Country in north-west Europe, part of the United Kingdom

England is a country that is part of the United Kingdom. It shares land borders with Wales to the west and Scotland to the north-northwest. The Irish Sea lies west of England and the Celtic Sea lies to the southwest. England is separated from continental Europe by the North Sea to the east and the English Channel to the south. The country covers five-eighths of the island of Great Britain, which lies in the North Atlantic, and includes over 100 smaller islands, such as the Isles of Scilly and the Isle of Wight.

Contents

Results

Adur Local Election Result 2018
PartySeatsGainsLossesNet gain/lossSeats %Votes %Votes+/−
  Conservative 9 +2 -2 0 64.3 44.0 7,322 +7.8%
  Labour 4 4 0 +4 28.6 34.4 5,718 +18.6%
  Liberal Democrat 0 0 0 0 0.0 6.9 1,152 -3.0%
  UKIP 0 0 4 -4 0.0 5.3 876 -23.9%
  Green 0 0 0 0 0.0 5.3 852 +0.5%
  Shoreham Beach Residents' Association 1 0 0 0 7.1 4.4 726 +0.4%

By ward

Buckingham
PartyCandidateVotes%±
Conservative Emma Evans 634 56.5 +3.0
Labour Carol O'Neal 315 28.0 +14.5
Green Jane Mott 105 9.3 +1.3
Liberal Democrat Elisa Vaughan 67 6.0 +0.7
Majority 319 28.4 -5.5
Turnout 1,123 35.7 -4.8
Conservative hold Swing 5.8% Con to Lab
Churchill
PartyCandidateVotes%±
Conservative Pat Beresford 444 44.9 -2.6
Labour Christopher Allinson 270 27.3 +27.3
Liberal Democrat Steve Creed 151 15.3 -1.0
UKIP Gloria Eveleigh 117 11.8 -24.4
Majority 174 17.6 +6.3
Turnout 988 28.7 -10.0
Conservative hold Swing 15% Con to Lab
Cokeham
PartyCandidateVotes%±
Conservative Paul Mansfield 575 52.6 +28.6
Labour Michael Thornton 381 34.8 +17.8
UKIP David Bamber 55 5.0 -29.5
Liberal Democrat Stephen Male 51 5.0 -19.3
Green Christopher Davis 28 2.6 +2.6
Majority 194 17.7 +17.7
Turnout 1,094 32.0 -6.4
Conservative gain from UKIP Swing 29.1% UKIP to Con
Eastbrook
PartyCandidateVotes%±
Labour David Balfe 590 48.8 +27.6
Conservative James Funnell 538 44.5 +9.8
Green Patrick Ginnelly 40 3.3 -3.3
Liberal Democrat Raj Dooraree 36 3.0 -8.2
Majority 52 4.3 +4.3
Turnout 1,209 34.9 -1.4
Labour gain from Conservative Swing 8.9% Con to Lab
Hillside
PartyCandidateVotes%±
Conservative David Simmons 652 62.3 +20.6
Labour Stephen Gilbert 290 27.7 +10.8
Green Julian Shinn 69 6.6 +1.5
Liberal Democrat Nilda Dooraree 33 3.2 -1.4
Majority 362 34.6 +24.6
Turnout 1,047 30.4 -7.0
Conservative hold Swing 4.9% Lab to Con
Manor
PartyCandidateVotes%±
Conservative Carol Albury 687 59.4 +14.9
Labour Douglas Bradley 245 21.2 +8.5
UKIP Lionel Parsons 97 8.4 -25.4
Liberal Democrat Peter Barnes 67 5.8 -3.2
Green Margaret Rumble 58 5.0 +5.0
Majority 442 38.2 +27.5
Turnout 1,156 35.0 -5.9
Conservative hold Swing 20.2% UKIP to Con
Marine
PartyCandidateVotes%±
Shoreham Beach Residents Association David Collins 726 52.7 -3.5
Labour Melanie Jenner 340 24.7 +15.0
Green Andrew Bradbury 250 18.2 +8.5
UKIP Peter Harvey 55 4.0 -14.8
Majority 386 28.0 -9.5
Turnout 1,377 38.0 +1.3
Shoreham Beach Residents Association hold Swing 9.3% SBRA to Lab
Mash Barn
PartyCandidateVotes%±
Labour Lee Cowan 535 49.0 +40.9
Conservative Joe Pannell 309 28.3 +5.7
Liberal Democrat Doris Martin 128 11.7 -13.1
UKIP Amanda Jones 103 9.4 -35.2
Green Peter Groves 15 1.4 +1.4
Majority 226 20.7 +20.7
Turnout 1,092 32.1
Labour gain from UKIP Swing 38.1% UKIP to Lab
Peverel
PartyCandidateVotes%±
Conservative Brian Boggis 562 57.2 +18.1
Labour Sylvia Knight 250 25.5 +5.8
UKIP David Lewis 81 8.2 -26.8
Liberal Democrat Diane Male 81 8.2 +1.8
Majority 312 31.8 +27.7
Turnout 982 28.5 -6.3
Conservative hold Swing 22.5% UKIP to Con
Southlands
PartyCandidateVotes%±
Labour Lavinia O'Connor 425 41.7 +18.5
Conservative Tony Nicklen 414 40.7 +8.0
Liberal Democrat Keith Humphrey 69 6.8 +1.7
Green Leslie Groves 57 5.6 +1.0
UKIP Jean Turner 52 5.1 -29.3
Majority 11 1.1 +1.1
Turnout 1,018 32.1 -4.5
Labour gain from UKIP Swing 23.9% UKIP to Lab
Southwick Green
PartyCandidateVotes%±
Conservative Stephen Chipp 652 52.4 +7.2
Labour Sophie Brown 468 37.6 +18.8
Liberal Democrat Ross Dowsett 117 9.4 +2.6
Majority 184 14.8 -9.6
Turnout 1,244 35.7 -1.3
Conservative hold Swing 5.8% Con to Lab
St. Mary's
PartyCandidateVotes%±
Labour Catherine Arnold 757 53.3 +30.7
Conservative Colin Head 453 31.9 -5.2
Green Lynn Finnigan 85 6.0 -6.7
Liberal Democrat David Batchelor 79 5.6 -0.8
UKIP Darren Compton 45 3.2 -17.9
Majority 304 21.4 +21.4
Turnout 1,420 37.9 +1.4
Labour gain from Conservative Swing 18% Con to Lab
St. Nicholas
PartyCandidateVotes%±
Conservative Neil Parkin 662 47.4 -1.4
Labour Adrienne Lowe 440 31.5 +16.2
Green Louise Miller 145 10.4 -2.1
Liberal Democrat Andrew Tinsley 113 8.1 +0.7
UKIP Mike Henn 35 2.5 -13.5
Majority 222 15.9 -16.9
Turnout 1,398 44.7 -0.6
Conservative hold Swing 8.8% Con to Lab
Widewater
PartyCandidateVotes%±
Conservative Andy McGregor 740 47.6 +13.1
Labour Richard Aulton 412 26.5 +8.7
UKIP Geoff Patmore 236 15.2 -24.2
Liberal Democrat Sue Barnes 160 10.3 +2.0
Majority 328 21.1 +21.1
Turnout 1,553 33.0 -5.1
Conservative gain from UKIP Swing 18.7% UKIP to Con

Related Research Articles

Adur District Non-metropolitan district in England

Adur is a local government district of West Sussex, England. It is named after its main river and is historically part of the English county of Sussex. The council is based in Shoreham-by-Sea and the district has a population of 59,627 according to the 2001 census.

Half of Adur District Council in West Sussex, England is elected every two years. Until 2003, the council was elected by thirds. Since the last boundary changes in 2004, 29 councillors have been elected from 14 wards.

Elections to Adur District Council were held on 2 May 2002. One third of the council was up for election and the Conservative party gained control of the council from no overall control. Overall turnout was 33%.

2004 Adur District Council election

Elections to Adur District Council were held on 10 June 2004. The whole council was up for election with boundary changes since the last election in 2003 reducing the number of seats by 10. The Conservative party held overall control of the council. Overall turnout was 38.0%.

2008 Adur District Council election

Elections to Adur District Council in West Sussex, England were held on 1 May 2008. Half of the council was up for election and the Conservative party held overall control of the council.

2010 Adur District Council election

The 2010 Adur District Council election took place on 6 May 2010 to elect members of Adur District Council in West Sussex, England. Half of the council was up for election and the Conservative party stayed in overall control of the council.

2012 Adur District Council election

The 2012 Adur District Council elections took place on 3 May 2012 to elect members of Adur District Council in West Sussex, England. Half of the council was up for election, and the Conservative Party remained in overall control of the council.

The 2014 Adur District Council elections took place on 22 May 2014 to elect members of Adur District Council in West Sussex, England. Half of the council is up for election.

The 2014 Worthing Borough Council election took place on 22 May 2014 to elect members of Worthing Borough Council in West Sussex, England. The election took place on the same day as elections to the European Parliament, and saw one third of the council up for election. The Conservative Party retained overall control of the council, gaining four seats, but losing one to the UK Independence Party. The Liberal Democrats suffered five losses, including one to the Green Party, who gaining their first elected seats on the Council.

2016 Adur District Council election

The 2016 Adur District Council elections took place on 5 May 2016 to elect members of Adur District Council in West Sussex, England. Half of the council was up for election, and the Conservative Party remained in overall control of the council. The Labour Party trebled their number of seats from one to three.

The first elections to the newly created Adur District Council established by the Local Government Act 1972 in England and Wales were held 7 June 1973. Overall turnout was recorded at 46.6%.

Elections to the Adur District Council were held on 6 May 1976, with the entire council up for election. The two councillors in Marine elected as Residents were defending their seats as Independents. Overall turnout was recorded at 51.8%.

1979 Adur District Council election

Elections to the Adur District Council were held on 3 May 1979, alongside the general election. The entire council was up for election, following boundary changes that reduced the number of wards by one, but altogether had added an additional two seats. Overall turnout was recorded at 74.4%.

1982 Adur District Council election

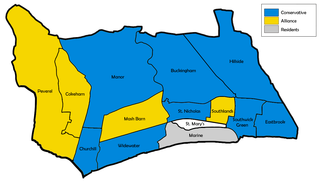
Elections to the Adur District Council were held on 6 May 1982, with one third of the council up for election. There was additional vacancies in the Mash Barn and Peverel wards, but no elections for the single-member ward St Marys and Residents stronghold, Marine, went uncontested. In the intervening years, the newly formed Alliance had gained three seats at the expense of the Conservatives. Overall turnout fell to 42.4%.

1983 Adur District Council election

Elections to the Adur District Council were held on 5 May 1983, with one third of the council up for election. There was an additional vacancy in the Peverel ward and no elections for the Marine ward. Overall turnout climbed to 47.6%.

1986 Adur District Council election

Elections to the Adur District Council were held on 8 May 1986, with minor boundary changes taking effect, impacting the Peverel ward. One third of the council was due for re-election, with additional vacancies in Buckingham, Churchill and Mash Barn wards. No elections were to be held for the single-member St Mary's ward. The formerly Conservative councillor for Southwick Green was defending the seat as an Independent, with no Conservative contesting that ward. Overall turnout was down slightly to 45.3%.

1987 Adur District Council election

Elections to the Adur District Council were held on 7 May 1987, with one third of the council up for election. There were additional vacancies in the Churchill and Widewater wards and no elections for the two-member Marine ward. Overall turnout climbed to 48.3%.

1988 Adur District Council election

Elections to the Adur District Council were held on 5 May 1988, with one third of the council up for election however no elections were held for the single-member ward St Mary's. Overall turnout dropped to 42.5%.

1990 Adur District Council election

Elections to the Adur District Council were held on 3 May 1990, with one third of the council up for election, as well as vacancies in the Churchill and Manor wards. No elections were held for the single-member St Mary's ward. The sitting Resident councillor in Overall turnout jumped to 49.8%.

The 2018 Worthing Borough Council election took place on 3 May 2018 to elect members of Worthing Borough Council. This was on the same day as other local elections. A third of the council was up for election, meaning a total of 13 councillors were elected from all of the council's wards.

References