The 2018 Watford Borough Council election took place on 3 May 2018 to elect members of Watford Borough Council in England. [1] This was the same day as other local elections.
Watford Borough Council is the local authority for the Watford non-metropolitan district of England, the United Kingdom. Watford is located in the south-west of Hertfordshire, in the East of England region. The council is based in the town hall on Hempstead Road.
Watford was one of the boroughs subject to a trial of voter ID restrictions [2] requiring the production of polling cards. [3]
Since the election of the full council in 2016, there had been three bye-elections, but the balance of the council remained the same, as they were won by the defending party, in the case of Leggatts Ward by Labour and in the cases of Oxhey and Park by the Lib Dems.
Peter Taylor of the Liberal Democrats retained the Watford mayorlty for the Liberal Democrats on the second count. Prior to the election, the mayor had been Dorothy Thornhill, representing the Liberal Democrats. [4]
Peter Colin Taylor is a Liberal Democrat politician and the second directly elected Mayor of Watford in the United Kingdom. He was elected in the 2018 election, succeeding Dorothy Thornhill. In the election, Taylor won 15,931 votes, defeating Labour candidate Jagtar Singh Dhindsa and Conservative candidate George Jabbour. He previously served as Deputy Mayor and councillor for Oxhey Ward.
The Liberal Democrats are a liberal political party in the United Kingdom. It is currently led by Vince Cable. They have 11 Members of Parliament in the House of Commons, 96 members of the House of Lords, one member of the European Parliament, five Members of the Scottish Parliament and one member in the Welsh Assembly and London Assembly. At the height of its influence, the party formed a coalition government with the Conservative Party from 2010 to 2015 with its leader Nick Clegg serving as Deputy Prime Minister.
Dorothy Thornhill, Baroness Thornhill, was the first directly elected mayor of Watford, Hertfordshire, England. She was the Liberal Democrats' first directly elected mayor, and was also the first female directly elected mayor in the United Kingdom. She served as Mayor of Watford from May 2002, until May 2018. She was nominated for a life peerage in August 2015.
Party | Candidate | First Round | Second Round | |||
---|---|---|---|---|---|---|
Votes | % | Votes | % | |||
Liberal Democrat | Peter Taylor | 13,279 | 48.7% | 15,931 | 61.6% | |
Labour | Jagtar Dhindsa | 9, 223 | 33.8% | 9,951 | 38.4% | |
Conservative | George Jabbour | 4,787 | 17.5% | Eliminated | ||
Liberal Democrat hold |
Party | Seats | Gains | Losses | Net gain/loss | Seats % | Votes % | Votes | +/− | |
---|---|---|---|---|---|---|---|---|---|
Liberal Democrat | 9 | 1 | 0 | 76.92 | 43.6 | 11,957 | +1.2 | ||
Labour | 3 | 0 | 1 | 23.1 | 33.7 | 9,244 | +5.0 | ||
Conservative | 0 | 0 | 0 | 0 | 20.9 | 5,737 | -9.9 | ||
Green | 0 | 0 | 0 | 0 | 1.0 | 278 | -4.6 | ||
UKIP | 0 | 0 | 0 | 0 | 0.8 | 225 | -1.5 |
An asterisk * indicates an incumbent seeking re-election.
Party | Candidate | Votes | % | ± | |
---|---|---|---|---|---|
Liberal Democrat | Ian Stotesbury | 1,044 | 45.6 | ||
Labour | Ahsan Khan* | 832 | 36.4 | ||
Conservative | Anthony Parker | 276 | 12.1 | ||
Green | Alison Wiesner | 137 | 6.0 | ||
Majority | 212 | 9.3 | |||
Turnout | 2,289 | 40.5 | |||
Liberal Democrat gain from Labour | Swing | ||||
No UKIP candidate as previous (-9.6%)
Party | Candidate | Votes | % | ± | |
---|---|---|---|---|---|
Liberal Democrat | Aga Dychton* | 930 | 40.7 | ||
Labour | Ani Meehan | 912 | 40.0 | ||
Conservative | Dennis Wharton | 300 | 13.1 | ||
Green | David Underdown | 141 | 6.2 | ||
Majority | 18 | 0.8 | |||
Turnout | 2,283 | 37.2 | |||
Liberal Democrat hold | Swing |
Party | Candidate | Votes | % | ± | |
---|---|---|---|---|---|
Labour | Matt Turmaine* | 1402 | 65.61 | ||
Liberal Democrat | Syed Kazmi | 436 | 20.40 | ||
Conservative | Yasmin Goldsmith | 299 | 13.99 | ||
Majority | 966 | 45.21 | |||
Turnout | 2137 | 33.38 | |||
Labour hold | Swing |
Party | Candidate | Votes | % | ± | |
---|---|---|---|---|---|
Labour | Bilqees Mauthoor* | 1121 | 50.61 | ||
Liberal Democrat | Joe Inniss | 719 | 32.46 | ||
Conservative | David Ealey | 375 | 16.93 | ||
Majority | 402 | 18.15 | |||
Turnout | 2215 | 39.01 | |||
Labour hold | Swing |
Party | Candidate | Votes | % | ± | |
---|---|---|---|---|---|
Liberal Democrat | Antony Barton | 779 | 43.57 | ||
Labour Co-op | John Dowdle | 560 | 31.32 | ||
Conservative | Linda Topping | 449 | 25.11 | ||
Majority | 219 | 12.25 | |||
Turnout | 1788 | 31.35 | |||
Liberal Democrat hold | Swing |
Party | Candidate | Votes | % | ± | |
---|---|---|---|---|---|
Liberal Democrat | Jane Alexandra Johnson* | 1505 | 53.41 | ||
Conservative | Binita Mehta-Parmar | 725 | 25.73 | ||
Labour | Edward John Tunnah | 509 | 18.06 | ||
UKIP | David Penn | 79 | 2.80 | ||
Majority | 780 | 27.68 | |||
Turnout | 2818 | 43.08 | |||
Liberal Democrat hold | Swing |
Party | Candidate | Votes | % | ± | |
---|---|---|---|---|---|
Liberal Democrat | Maggie Parker | 1432 | 58.83 | ||
Conservative | Joseph Gornicki | 570 | 23.42 | ||
Labour | Sue Sleeman | 432 | 17.75 | ||
Majority | 862 | 35.41 | |||
Turnout | 2434 | 46.00 | |||
Liberal Democrat hold | Swing |
Party | Candidate | Votes | % | ± | |
---|---|---|---|---|---|
Liberal Democrat | Peter Kloss | 1588 | 51.77 | ||
Conservative | David Fallon | 889 | 28.99 | ||
Labour | Nabila Ahmed | 541 | 17.64 | ||
UKIP | Peter Blogg | 49 | 1.60 | ||
Majority | 699 | 22.78 | |||
Turnout | 3067 | 48.63 | |||
Liberal Democrat hold | Swing |
Party | Candidate | Votes | % | ± | |
---|---|---|---|---|---|
Liberal Democrat | Keith Crout* | 1242 | 62.82 | ||
Conservative | Lola Adedoyin | 385 | 19.47 | ||
Labour | Asma Suleman | 350 | 17.70 | ||
Majority | 857 | 43.35 | |||
Turnout | 1977 | 35.24 | |||
Liberal Democrat hold | Swing |
Party | Candidate | Votes | % | ± | |
---|---|---|---|---|---|
Liberal Democrat | Stephen Johnson* | 951 | 44.65 | ||
Labour | Diana Ivory | 615 | 28.87 | ||
Conservative | Darren Harrisona | 564 | 26.48 | ||
Majority | 336 | 15.78 | |||
Turnout | 2130 | 40.44 | |||
Liberal Democrat hold | Swing |
Party | Candidate | Votes | % | ± | |
---|---|---|---|---|---|
Labour | Nasreen Shah* | 1488 | 62.13 | ||
Liberal Democrat | Tahair Azam | 505 | 21.09 | ||
Conservative | Michelle Sherman | 402 | 16.78 | ||
Majority | 983 | 41.04 | |||
Turnout | 2395 | 43.08 | |||
Labour hold | Swing |
Party | Candidate | Votes | % | ± | |
---|---|---|---|---|---|
Liberal Democrat | Glen Saffery* | 826 | 43.29 | ||
Conservative | Sarah Hayes | 503 | 26.36 | ||
Labour | Seamus Williams | 482 | 25.26 | ||
UKIP | Ian Green | 97 | 5.08 | ||
Majority | 323 | 16.93 | |||
Turnout | 1908 | 33.51 | |||
Liberal Democrat hold | Swing |
Watford is a constituency represented in the House of Commons of the UK Parliament since 2010 by Richard Harrington, a member of the Conservative Party.
The 1998 Solihull Metropolitan Borough Council election took place on 7 May 1998 to elect members of Solihull Metropolitan Borough Council in the West Midlands, England. One third of the council was up for election and the council stayed under no overall control.
Hertfordshire County Council in England is elected every four years. Since the last boundary changes, that took effect for the 2001 election, 77 councillors are elected for single member districts.
Elections to Calderdale Metropolitan Borough Council were held on 3 May 2007 with the exception of the Warley ward which was postponed until 14 June 2007 due to the sudden death of one of the candidates. One third of the council was up for election and the council stayed under no overall control with a minority Conservative administration. The total turnout of the election was 38.01%. The winning candidate in each ward is highlighted in bold.
The 2002 St Albans City and District Council election took place on 2 May 2002 to elect members of St Albans District Council in Hertfordshire, England. One third of the council was up for election and the council stayed under no overall control.
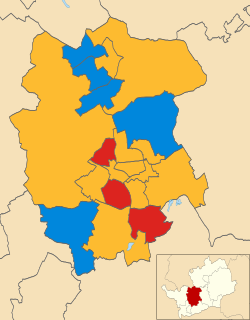
The 2003 St Albans City and District Council election took place on 1 May 2003 to elect members of St Albans District Council in Hertfordshire, England. One third of the council was up for election and the council stayed under no overall control.
The 2002 South Tyneside Metropolitan Borough Council election took place on 2 May 2002 to elect members of South Tyneside Metropolitan Borough Council in Tyne and Wear, England. One third of the council was up for election and the Labour party kept overall control of the council.
The 2006 Rushmoor Council election took place on 4 May 2006 to elect members of Rushmoor Borough Council in Hampshire, England. One third of the council was up for election and the Conservative party stayed in overall control of the council.
The 2007 Swindon Borough Council election took place on 4 May 2007 to elect members of Swindon Unitary Council in Wiltshire, England. One third of the council was up for election and the Conservative party stayed in overall control of the council.
The 2000 Sunderland Council election took place on 4 May 2000 to elect members of Sunderland Metropolitan Borough Council in Tyne and Wear, England. One third of the council was up for election and the Labour party stayed in overall control of the council.
The 2006 Sunderland Council election took place on 4 May 2006 to elect members of Sunderland City Council in Tyne and Wear, England. One third of the Council was up for election and the Labour party stayed in overall control.
The 2011 council elections in Guildford saw the Conservatives retain control over Guildford Borough Council with an increased majority of 20 seats. Full results for each ward can be found at Guildford Council election, full results, 2011.
Elections to Watford Borough Council were held on 3 May 2012. Three years in every four, a third of the council retires and elections are held.
Elections to Watford Borough Council in England were held on 5 May 2011. Three years in every four, a third of the council retires and elections are held.
The 2015 Christchurch Borough Council election took place on 7 May 2015 to elect members of Christchurch Borough Council in Dorset, England. The whole council was up for election and the Conservative party stayed in overall control of the council.
Council elections in England were held on Thursday 3 May 2018. Elections were held in all 32 London boroughs, 34 metropolitan boroughs, 67 district and borough councils and 17 unitary authorities. There were also direct elections for the mayoralties of Hackney, Lewisham, Newham, Tower Hamlets and Watford.
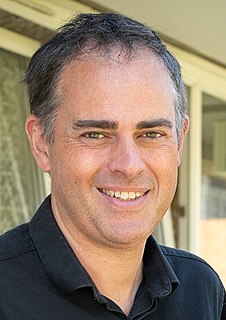
The 2018 Lambeth Council election took place on 3 May 2018 to elect members of Lambeth Council in England. The election saw Labour remain in control of Lambeth Council with a slightly reduced majority, winning over 90% of the seats. The Green Party achieved its best-ever result in the borough, winning five seats and becoming the official opposition and the largest Green group in London.
The 2018 Bromley London Borough Council election took place on 3 May 2018 to elect members of Bromley London Borough Council in England. This was the same day as other local elections.
The 2018 Swindon Borough Council election took place on 3 May 2018, to elect members of Swindon Borough Council in England. This was on the same day as other local elections.
The 2018 Woking Borough Council election took place on 3 May 2018 to elect one third of members to Woking Borough Council in England coinciding with other local elections held across much of England. Elections in each ward are held in three years out of four.
7. https://www.watford.gov.uk/info/20248/elections_and_voting/515/elections_results/2 Watford Council