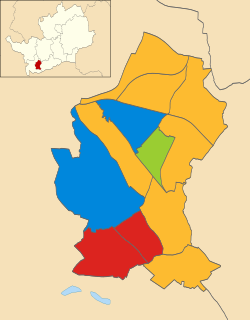
Elections to Watford Borough Council in England were held on 5 May 2011. Three years in every four, a third of the council (12 councillors) retires and elections are held (in the fourth year, elections are held for county councillors).
Watford is a town and borough in Hertfordshire, England, 15 miles (24 km) northwest of central London.
England is a country that is part of the United Kingdom. It shares land borders with Wales to the west and Scotland to the north-northwest. The Irish Sea lies west of England and the Celtic Sea lies to the southwest. England is separated from continental Europe by the North Sea to the east and the English Channel to the south. The country covers five-eighths of the island of Great Britain, which lies in the North Atlantic, and includes over 100 smaller islands, such as the Isles of Scilly and the Isle of Wight.
In this council election, the Labour Party gained two seats; the Liberal Democrats and the Conservative lost one each. The Liberal Democrats remained firmly in control of the council. Four parties, Liberal Democrats, Labour, Conservative and Green, all put up candidates in every seat. There were also three UKIP candidates and one independent. [1]
The Liberal Democrats are a liberal political party in the United Kingdom. It is currently led by Vince Cable. They have 11 Members of Parliament in the House of Commons, 96 members of the House of Lords, one member of the European Parliament, five Members of the Scottish Parliament and one member in the Welsh Assembly and London Assembly. At the height of its influence, the party formed a coalition government with the Conservative Party from 2010 to 2015 with its leader Nick Clegg serving as Deputy Prime Minister.
The Conservative Party, officially the Conservative and Unionist Party, is a centre-right political party in the United Kingdom. The governing party since 2010, it is the largest in the House of Commons, with 313 Members of Parliament, and also has 249 members of the House of Lords, 18 members of the European Parliament, 31 Members of the Scottish Parliament, 12 members of the Welsh Assembly, eight members of the London Assembly and 8,916 local councillors.
After the election, the composition of the council was: [2]
The Labour Party is a centre-left political party in the United Kingdom that has been described as an alliance of social democrats, democratic socialists and trade unionists. The party's platform emphasises greater state intervention, social justice and strengthening workers' rights.
The Green Party of England and Wales is a green, left-wing political party in England and Wales. Headquartered in London, since September 2018, its co-leaders are Siân Berry and Jonathan Bartley. The Green Party has one representative in the House of Commons, one in the House of Lords, and three in the European Parliament. In addition, it has various councillors in UK local government and two members of the London Assembly.
Party | Seats | Gains | Losses | Net gain/loss | Seats % | Votes % | Votes | +/− | |
---|---|---|---|---|---|---|---|---|---|
Liberal Democrat | 8 | - | -1 | -1 | 66.7 | 36.7% | 9899 | ||
Labour | 3 | +2 | - | +2 | 25.0 | 28.0% | 7553 | ||
Conservative | - | - | -1 | -1 | 23.5% | 6333 | |||
Green | 1 | - | - | - | 8.3 | 9.9% | 2663 | ||
UKIP | - | - | - | - | 1.1% | 298 | |||
Independent | - | - | - | - | 0.8% | 204 | |||
Party | Candidate | Votes | % | ± | |
---|---|---|---|---|---|
Green | Steve Lawrence Rackett | 1104 | 58.6 | ||
Labour | Emma Clare Collins | 424 | 22.5 | ||
Conservative | Guy Anthony Miller | 229 | 12.1 | ||
Liberal Democrat | Patricia Gollop | 128 | 6.8 | ||
Majority | 680 | 36.1 | |||
Turnout | 1885 | 34.97 | |||
Green hold | Swing | ||||
Party | Candidate | Votes | % | ± | |
---|---|---|---|---|---|
Liberal Democrat | Helen Lynch | 901 | 42.1 | ||
Labour | Fred Grindrod | 772 | 36.1 | ||
Conservative | Carole Ann Bamford | 277 | 13.0 | ||
Green | Dorothy Nixon | 118 | 5.5 | ||
UKIP | Renie Price | 70 | 3.3 | ||
Majority | 129 | 6.0 | |||
Turnout | 2138 | 34.87 | |||
Liberal Democrat hold | Swing | ||||
Party | Candidate | Votes | % | ± | |
---|---|---|---|---|---|
Labour | Nigel Bell | 1473 | 68.4 | ||
Liberal Democrat | Janet Baddeley | 343 | 15.9 | ||
Conservative | Neil John Punter | 251 | 11.7 | ||
Green | Alison Wiesner | 86 | 4.0 | ||
Majority | 1130 | 52.5 | |||
Turnout | 2153 | 35.03 | |||
Labour hold | Swing | ||||
Party | Candidate | Votes | % | ± | |
---|---|---|---|---|---|
Labour | Asif Kaleem Khan | 786 | 35.3 | ||
Conservative | Amanda Grimston | 670 | 30.1 | ||
Liberal Democrat | Dennis Wharton | 440 | 19.8 | ||
Green | Ian Brandon | 330 | 14.8 | ||
Majority | 116 | 5.2 | |||
Turnout | 2226 | 41.76 | |||
Labour gain from Conservative | Swing | ||||
Party | Candidate | Votes | % | ± | |
---|---|---|---|---|---|
Liberal Democrat | Susan Carole Greenslade | 893 | 43.6 | ||
Labour | Seamus Williams | 584 | 28.5 | ||
Conservative | David Charles Ealey | 468 | 22.9 | ||
Green | Iain Wadey | 101 | 4.9 | ||
Majority | 309 | 15.1 | |||
Turnout | 2046 | 36.09 | |||
Liberal Democrat hold | Swing | ||||
Party | Candidate | Votes | % | ± | |
---|---|---|---|---|---|
Liberal Democrat | George Andrew Forrest | 1285 | 45.6 | ||
Conservative | Camilla Zaman Khawaja | 1023 | 36.3 | ||
Labour | Michael Barnes | 328 | 11.7 | ||
Green | Sally Rose Ivins | 179 | 6.4 | ||
Majority | 262 | 9.3 | |||
Turnout | 2815 | 48.01 | |||
Liberal Democrat hold | Swing | ||||
Party | Candidate | Votes | % | ± | |
---|---|---|---|---|---|
Liberal Democrat | Shirena Counter | 1209 | 55.2 | ||
Conservative | Richard Haxton Bamford | 497 | 22.7 | ||
Labour | Susan Janet Sleeman | 357 | 16.3 | ||
Green | Christine Winifred Chandler | 129 | 5.9 | ||
Majority | 712 | 32.5 | |||
Turnout | 2192 | 42.34 | |||
Liberal Democrat hold | Swing | ||||
Party | Candidate | Votes | % | ± | |
---|---|---|---|---|---|
Liberal Democrat | Peter Lewis Jeffree | 1302 | 43.4 | ||
Conservative | Linda Ann Topping | 1160 | 38.7 | ||
Labour | Michael Jones | 330 | 11.0 | ||
Green | Alex MacGregor Mason | 133 | 4.4 | ||
UKIP | David Penn | 75 | 2.5 | ||
Majority | 142 | 4.7 | |||
Turnout | 3000 | 50.49 | |||
Liberal Democrat hold | Swing | ||||
Party | Candidate | Votes | % | ± | |
---|---|---|---|---|---|
Liberal Democrat | Derek Thomas Francis Scudder | 1095 | 52.7 | ||
Conservative | Penelope Margaret Edwards | 521 | 25.1 | ||
Labour | Adeyemi Frederick Oshunniyi | 356 | 17.1 | ||
Green | Caryn Elaine Argun | 107 | 5.1 | ||
Majority | 574 | 27.6 | |||
Turnout | 2079 | 39.17 | |||
Liberal Democrat hold | Swing | ||||
Party | Candidate | Votes | % | ± | |
---|---|---|---|---|---|
Liberal Democrat | Kelly McLeod | 879 | 41.7 | ||
Conservative | Youseffe Fahmy | 485 | 23.0 | ||
Labour | Geoffrey Pearce | 461 | 21.9 | ||
UKIP | Daniel Channing | 153 | 7.3 | ||
Green | Clare Victoria Pitkin | 128 | 6.1 | ||
Majority | 394 | 18.7 | |||
Turnout | 2106 | 44.54 | |||
Liberal Democrat hold | Swing | ||||
Party | Candidate | Votes | % | ± | |
---|---|---|---|---|---|
Labour | Nasreen Shah | 1259 | 50.1 | ||
Liberal Democrat | Shameen Khan | 691 | 27.5 | ||
Conservative | Sally Punter | 231 | 9.2 | ||
Independent | Paul Baker | 204 | 8.1 | ||
Green | Helen Elizabeth Wynne | 127 | 5.1 | ||
Majority | 568 | 22.6 | |||
Turnout | 2512 | 44.79 | |||
Labour gain from Liberal Democrat | Swing | ||||
Party | Candidate | Votes | % | ± | |
---|---|---|---|---|---|
Liberal Democrat | Alan Edward Burtenshaw | 733 | 40.8 | ||
Conservative | Anthony John Rogers | 521 | 29.0 | ||
Labour | John Young | 423 | 23.5 | ||
Green | Paula Mary Evelyn Brodhurst | 121 | 6.7 | ||
Majority | 212 | 11.8 | |||
Turnout | 1798 | 33.95% | |||
Liberal Democrat hold | Swing | ||||
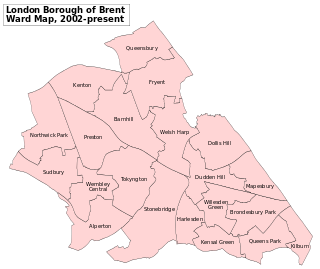
Brent London Borough Council in London, England is elected every four years. Since the last boundary changes in 2002, 63 councillors have been elected from 21 wards.
Sefton Council is the governing body for the Metropolitan Borough of Sefton in Merseyside, north-western England. The council was under no overall control from the 1980s until 2012 when the Labour Party took control. It is a constituent council of Liverpool City Region Combined Authority.
The 2006 St Helens Metropolitan Borough Council election took place on 4 May 2006 to elect members of St Helens Metropolitan Borough Council in Merseyside, England. One third of the council was up for election and the council stayed under no overall control.
The 2010 Barnet Council election took place on 6 May 2010 to elect members of Barnet London Borough Council in London, England. The whole council was up for election and the Conservative party stayed in overall control of the council.
The 1999 Pendle Borough Council election took place on 6 May 1999 to elect members of Pendle Borough Council in Lancashire, England. One third of the council was up for election and the Liberal Democrats lost overall control of the council to no overall control.
The 2007 Pendle Borough Council election took place on 3 May 2007 to elect members of Pendle Borough Council in Lancashire, England. One third of the council was up for election and the Liberal Democrats stayed in overall control of the council.
The 1999 Sandwell Metropolitan Borough Council election took place on 6 May 1999 to elect members of Sandwell Metropolitan Borough Council in the West Midlands, England. One third of the council was up for election and the Labour party stayed in overall control of the council.
The 2006 Maidstone Borough Council election took place on 4 May 2006 to elect members of Maidstone Borough Council in Kent, England. One third of the council was up for election and the council stayed under no overall control.
The 2007 Maidstone Borough Council election took place on 3 May 2007 to elect members of Maidstone Borough Council in Kent, England. One third of the council was up for election and the council stayed under no overall control.
The 2011 council elections in Guildford saw the Conservatives retain control over Guildford Borough Council with an increased majority of 20 seats. Full results for each ward can be found at Guildford Council election, full results, 2011.
The 2011 Wokingham Borough Council election took place on 5 May 2011 to elect members of Wokingham Unitary Council in Berkshire, England. One third of the council was up for election and the Conservative party stayed in overall control of the council.
The 2011 Sunderland Council election took place on 5 May 2011 to elect members of Sunderland Metropolitan Borough Council in Tyne and Wear, England. One third of the council was up for election and the Labour party stayed in overall control of the council.
The 2003 Hertsmere Borough Council election took place on 1 May 2003 to elect members of Hertsmere Borough Council in Hertfordshire, England. One third of the council was up for election and the Conservative party stayed in overall control of the council.
The 2006 Eastbourne Council election took place on 4 May 2006 to elect members of Eastbourne Borough Council in East Sussex, England. One third of the council was up for election and the Conservative party stayed in overall control of the council.
Elections to Watford Borough Council were held on 3 May 2012. Three years in every four, a third of the council retires and elections are held.
Elections to Watford Borough Council were held on 6 May 2010. Three years in every four, a third of the council retires and elections are held. The council election was held on the same day as the national General Election, when the Labour Party government lost power and the Watford parliamentary constituency was won by the Conservative Party.
An election to Hertfordshire County Council took place on 2 May 2013 as part of the United Kingdom local elections, 2013. 77 electoral divisions elected one county councillor each by first-past-the-post voting for a four-year term of office. The electoral divisions were the same as those used at the previous election in 2009.
The 2012 St Helens Metropolitan Borough Council election took place on 3 May 2012 to elect members of St Helens Metropolitan Borough Council in Merseyside, England. One third of the council was up for election and the Labour party stayed in overall control of the council.
The 2015 Guildford Borough Council election took place on 7 May 2015 to elect members of Guildford Borough Council in England as one of the 2015 local elections, held simultaneously with the General Election.
The 2012 West Oxfordshire District Council election took place on 3 May 2012 to elect members of West Oxfordshire District Council in Oxfordshire, England. One third of the council was up for election and the Conservative party stayed in overall control of the council.