| |||||||||||||||||||||||||||||||||||||||||
All 51 seats on Dacorum Borough Council | |||||||||||||||||||||||||||||||||||||||||
| |||||||||||||||||||||||||||||||||||||||||
|
Elections to Dacorum Borough Council in Hertfordshire, England were held on 5 May 2011. The whole council was up for election. The last election for the Borough Council was held in May 2007. [1]
Dacorum Borough Council is the local authority for the Dacorum non-metropolitan district of England, the United Kingdom. Dacorum is located in the north-west of Hertfordshire, in the East of England region. The Council itself is based in Hemel Hempstead, the largest settlement in the district.
Hertfordshire is one of the home counties in England. It is bordered by Bedfordshire and Cambridgeshire to the north, Essex to the east, Greater London to the south, and Buckinghamshire to the west. For government statistical purposes, it is placed in the East of England region.
England is a country that is part of the United Kingdom. It shares land borders with Wales to the west and Scotland to the north-northwest. The Irish Sea lies west of England and the Celtic Sea lies to the southwest. England is separated from continental Europe by the North Sea to the east and the English Channel to the south. The country covers five-eighths of the island of Great Britain, which lies in the North Atlantic, and includes over 100 smaller islands, such as the Isles of Scilly and the Isle of Wight.
Party | Seats | Gains | Losses | Net gain/loss | Seats % | Votes % | Votes | +/− | |
---|---|---|---|---|---|---|---|---|---|
Conservative | 43 | +1 | 84% | 51% | 24,969 | ||||
Liberal Democrat | 6 | 0 | 12% | 20% | 9,734 | ||||
Labour | 2 | -1 | 4% | 24% | 11,449 | ||||
Green | 0 | 0 | 0% | 3% | 1,658 | ||||
Independent | 0 | 0 | 0% | 497 | |||||
English Democrat | 0 | 0 | 0% | 195 | |||||
Party | Candidate | Votes | % | ± | |
---|---|---|---|---|---|
Labour | Gary Cook | 467 | |||
Liberal Democrat | Sylvia Fry | 128 | |||
Green | Stephen Horsfall | 103 | |||
Labour | Anne-Lise Johnsen | 395 | |||
Conservative | Allan Lawson | 778 | |||
Liberal Democrat | Diane Wilson | 109 | |||
Conservative | William Wyatt-Lowe | 744 | |||
Turnout | 2724 | 37.15% | |||
Party | Candidate | Votes | % | ± | |
---|---|---|---|---|---|
Conservative | Martin Crowhurst | 594 | |||
Liberal Democrat | Mark Rutherford | 209 | |||
Labour | Keith White | 611 | |||
Labour | Susan White | 592 | |||
Liberal Democrat | Steve Wilson | 204 | |||
Conservative | Dan Wood | 619 | |||
Turnout | 2829 | 37.45 | |||
Party | Candidate | Votes | % | ± | |
---|---|---|---|---|---|
Liberal Democrat | Rosemarie Hollinghurst | 581 | 53% | ||
Conservative | Stan Mills | 444 | 40% | ||
Labour | Tony Shaw | 77 | 7% | ||
Turnout | 1102 | 58% | |||
Party | Candidate | Votes | % | ± | |
---|---|---|---|---|---|
Conservative | Brian Ayling | 1276 | |||
Conservative | Michael Clark | 1071 | |||
Liberal Democrat | Nicole Daly | 290 | |||
Labour | James Hood | 622 | |||
Labour | Norman Jones | 644 | |||
Conservative | Colin Peter | 1013 | |||
Labour | Gillian Redman | 611 | |||
Liberal Democrat | Ron Tindall | 290 | |||
Liberal Democrat | Stuart Watkin | 246 | |||
Turnout | 35.5 | ||||
Party | Candidate | Votes | % | ± | |
---|---|---|---|---|---|
Liberal Democrat | Paul Elley | 134 | 11% | ||
Labour | James Seddon | 150 | 13% | ||
Conservative | Nick Tiley | 905 | 76% | ||
Turnout | 1189 | 55.8% | |||
Party | Candidate | Votes | % | ± | |
---|---|---|---|---|---|
Liberal Democrat | Clare Adams | 204 | |||
English Democrat | Simon Deacon | 195 | |||
Labour | Michelle Lancaster | 593 | |||
Conservative | Suqlain Mahmood | 701 | |||
Liberal Democrat | Lynda Roe | 210 | |||
Conservative | Joann Wixted | 639 | |||
Labour | Tom Wright | 515 | |||
Turnout | 38.68% | ||||
Party | Candidate | Votes | % | ± | |
---|---|---|---|---|---|
Conservative | David Collins | 1251 | |||
Liberal Democrat | Ian Grant | 795 | |||
Labour | Helen Leach | 344 | |||
Conservative | Fiona McDonald | 1213 | |||
Labour | Alan Olive | 312 | |||
Liberal Democrat | Sally Symington | 595 | |||
Turnout | 50.88% | ||||
Party | Candidate | Votes | % | ± | |
---|---|---|---|---|---|
Conservative | Stephen Bateman | 902 | |||
Independent | Norman Cutting | 322 | |||
Labour | Ray Jones | 326 | |||
Conservative | Julie Laws | 996 | |||
Liberal Democrat | John Lythgoe | 597 | |||
Labour | Ellen Robson | 304 | |||
Liberal Democrat | Garrick Stevens | 678 | |||
Turnout | 48.1% | ||||
Party | Candidate | Votes | % | ± | |
---|---|---|---|---|---|
Liberal Democrat | Geraldine Corry | 528 | |||
Green | Paul de Hoest | 274 | |||
Conservative | Carol Green | 1149 | |||
Liberal Democrat | Hugo Hardy | 407 | |||
Labour | Peter Hardy | 379 | |||
Conservative | Ian Reay | 1138 | |||
Labour | Sylvia Shaw | 300 | |||
Turnout | 48.28% | ||||
Party | Candidate | Votes | % | ± | |
---|---|---|---|---|---|
Conservative | Gbola Adeleke | 1825 | |||
Liberal Democrat | Laure Carter-Brown | 293 | |||
Conservative | Gill Chapman | 2148 | |||
Labour | Sharon Green | 438 | |||
Green | Martin Humphrey | 326 | |||
Labour | Beryl Milnes | 435 | |||
Labour | Richard Milnes | 403 | |||
Conservative | Jack Organ | 1959 | |||
Liberal Democrat | Martin Rance | 274 | |||
Liberal Democrat | Beth Townsend | 230 | |||
Turnout | 47.5% | ||||
Party | Candidate | Votes | % | ± | |
---|---|---|---|---|---|
Liberal Democrat | Malcolm Appleford | 497 | |||
Labour | Julia Coleman | 809 | |||
Conservative | Neil Harden | 1659 | |||
Labour | Helen Heenan | 695 | |||
Liberal Democrat | Robert Irving | 265 | |||
Green | Alan Johnson | 265 | |||
Green | Hazel Johnson | 253 | |||
Labour | Ian Laidlaw-Dickson | 733 | |||
Conservative | Janice Marshall | 1624 | |||
Liberal Democrat | Alan Waugh | 272 | |||
Conservative | Andrew Williams | 1483 | |||
Turnout | 48.3% | ||||
Party | Candidate | Votes | % | ± | |
---|---|---|---|---|---|
Labour | Micheal Broomberg | 1060 | |||
Green | Jane Cousins | 372 | |||
Labour | Margaret Coxage | 1166 | |||
Labour | Ron Coxage | 1060 | |||
Conservative | Greame Elliott | 1325 | |||
Conservative | Fiona Guest | 1407 | |||
Liberal Democrat | Rachael Rance | 193 | |||
Liberal Democrat | Colin Roe | 221 | |||
Liberal Democrat | Jenny Simmons | 287 | |||
Conservative | John Whitman | 1332 | |||
Turnout | 45.2% | ||||
Party | Candidate | Votes | % | ± | |
---|---|---|---|---|---|
Liberal Democrat | Jean Blackman | 124 | |||
Labour Co-op | Maureen Flint | 828 | |||
Green | Paul Harris | 107 | |||
Liberal Democrat | Geoff Lawrence | 91 | |||
Labour Co-op | Lara Parker | 671 | |||
Conservative | Jai Restall | 600 | |||
Conservative | Roger Taylor | 705 | |||
Independent | Mick Young | 175 | |||
Turnout | 44.69% | ||||
Party | Candidate | Votes | % | ± | |
---|---|---|---|---|---|
Liberal Democrat | Alex Bell | 146 | |||
Conservative | Alexander Bhinder | 1042 | |||
Conservative | Terence Douris | 939 | |||
Labour | Anne Fisher | 747 | |||
Labour | Rosa Gilbert | 589 | |||
Labour | Rose Harrison | 620 | |||
Liberal Democrat | Peter Ogundipe | 157 | |||
Liberal Democrat | Tom Potter | 144 | |||
Conservative | Ann Ryan | 928 | |||
Green | Paul Sandford | 175 | |||
Turnout | 36.5% | ||||
Party | Candidate | Votes | % | ± | |
---|---|---|---|---|---|
Conservative | Graham Adshead | 573 | |||
Liberal Democrat | William Allen | 214 | |||
Liberal Democrat | Chris Angell | 242 | |||
Labour | Stefan Fisher | 534 | |||
Conservative | Anthony McKay | 550 | |||
Labour | Michael Moore | 522 | |||
Turnout | 2635 | 34.9 | |||
Party | Candidate | Votes | % | ± | |
---|---|---|---|---|---|
Labour | Antony Briers | 562 | |||
Liberal Democrat | Lloyd Harris | 589 | |||
Liberal Democrat | Brenda Link | 711 | |||
Conservative | Barry Newton | 406 | |||
Labour | Linda Rolph | 464 | |||
Conservative | Goverdhan Silwal | 309 | |||
Turnout | 3041 | 40.36 | |||
Party | Candidate | Votes | % | ± | |
---|---|---|---|---|---|
Conservative | Alan Anderson | 1213 | |||
Labour | Gerry Angiolini | 498 | |||
Labour | Derek Collins | 371 | |||
Conservative | Bob McLean | 1089 | |||
Liberal Democrat | Ian Senior | 279 | |||
Liberal Democrat | Angela Tindall | 194 | |||
Turnout | 48.68% | ||||
Party | Candidate | Votes | % | ± | |
---|---|---|---|---|---|
Conservative | Hazel Bassadone | 1790 | |||
Liberal Democrat | Margaret Colquhoun | 214 | |||
Liberal Democrat | Sheila Daly | 387 | |||
Conservative | Margaret Griffiths | 1568 | |||
Labour | Jean Langdon | 743 | |||
Labour | Pia Larsen | 659 | |||
Conservative | Graham Sutton | 1596 | |||
Liberal Democrat | Margaret Waugh | 220 | |||
Labour | Lee Whitehill | 648 | |||
Turnout | 42.68% | ||||
Party | Candidate | Votes | % | ± | |
---|---|---|---|---|---|
Liberal Democrat | Barry Batchelor | 99 | 10.7% | ||
Conservative | Geoffrey Doole | 609 | 65.6% | ||
Labour | Bernard Gronert | 220 | 23.7% | ||
Turnout | 928 | 43.7% | |||
Party | Candidate | Votes | % | ± | |
---|---|---|---|---|---|
Conservative | Alan Fantham | 731 | 69% | ||
Labour | Barbara Gronert | 144 | 14% | ||
Liberal Democrat | Malcolm Rogers | 190 | 18% | ||
Turnout | 1065 | 48.7% | |||
Party | Candidate | Votes | % | ± | |
---|---|---|---|---|---|
Conservative | Stephen Hearn | 764 | 21.5 | ||
Conservative | Kerr Hill | 581 | 16.3 | ||
Liberal Democrat | Nick Hollinghurst | 966 | 27.2 | ||
Labour | Dominic Hook | 186 | 5.2 | ||
Labour | Mary Khamis | 159 | 4.5 | ||
Liberal Democrat | Denise Rance | 898 | 25.3 | ||
Turnout | 3554 | 46.8 | |||
Party | Candidate | Votes | % | ± | |
---|---|---|---|---|---|
Conservative | Penny Hearn | 685 | 52% | ||
Liberal Democrat | Roxanne Ransley | 525 | 40% | ||
Labour | Lorraine Winslade | 96 | 8% | ||
Turnout | 1306 | 59.7% | |||
Party | Candidate | Votes | % | ± | |
---|---|---|---|---|---|
Labour | Frank Burgess | 211 | |||
Conservative | Olive Conway | 940 | |||
Labour | Emma Reed | 219 | |||
Conservative | Paul Richardson | 851 | |||
Liberal Democrat | Stewart Tolley | 890 | |||
Liberal Democrat | Christopher Townsend | 1017 | |||
Turnout | 4128 | 53.2% | |||
Party | Candidate | Votes | % | ± | |
---|---|---|---|---|---|
Conservative | Herbert Chapman | 1217 | |||
Labour | Gillian Edwards | 312 | |||
Conservative | David Lloyd | 1158 | |||
Labour | Tim Lyle | 230 | |||
Liberal Democrat | Bhadrinath Podichetty | 112 | |||
Liberal Democrat | John Vaites | 262 | |||
Turnout | 3291 | 44.5% | |||
Party | Candidate | Votes | % | ± | |
---|---|---|---|---|---|
Liberal Democrat | Gloria Crellin | 111 | |||
Liberal Democrat | Nitesh Dave | 145 | |||
Labour | Alan Dickson | 365 | |||
Conservative | Stephen Holmes | 961 | |||
Labour | Mick Maloney | 322 | |||
Conservative | Colette Wyatt-Lowe | 912 | |||
Turnout | 2816 | 36.8% | |||
Tewkesbury Borough Council is the local authority for Tewkesbury Borough. Tewkesbury Borough is located in North Gloucestershire in the South West of England region. The Council itself is based in the Council Offices in Tewkesbury proper, but the borough also comprises Ashchurch, Bishop's Cleeve, Brockworth, Churchdown and Winchcombe and a number of other settlements. It is administratively distinct from Tewkesbury Town Council, which serves the smaller parish of Tewkesbury only.
Dacorum Borough Council in Hertfordshire, England is elected every four years. Since the last boundary changes in 2007, 51 councillors have been elected from 25 wards.
Elections to Wyre Borough Council in Lancashire, England are held every four years. Since the last boundary changes in 2003, 55 councillors have been elected from 26 wards.
Dartford Borough Council is elected every four years.
Slough is a unitary authority in Berkshire, England. Until 1 April 1998 it was a non-metropolitan district.
One third of Rochdale Metropolitan Borough Council in Greater Manchester, England is elected each year, followed by one year without election. Since the last boundary changes in 2004, 60 councillors have been elected from 20 wards.
Elections to Dacorum Borough Council in Hertfordshire, England were held on 6 May 1999. The election in Highfield St Paul was delayed after the death of a Conservative candidate until a by-election was held on 3 June. The whole council was up for election with boundary changes since the Dacorum Council election, 1995|last election in 1995 reducing the number of seats by 6. The Conservative party gained overall control of the council from no overall control, although it would fall back to no overall control after the by-election in June.
Elections for Redbridge London Borough Council were held on 6 May 2010. The 2010 General Election and other local elections took place on the same day.
Elections to Lewisham London Borough Council were held on 4 May 2006. The whole council was up for election for the first time since the 2002 election.
Elections to Wyre Borough Council were held on 5 May 2011, along with the United Kingdom Alternative Vote referendum, 2011. All 55 councillors were elected from 26 wards in elections held every four years. The Conservative Party stayed in overall control of the council.
Elections to Wyre Borough Council were held on 3 May 2007. All 55 councillors were elected from 26 wards in elections held every four years. The Conservative Party kept hold overall control of the council.
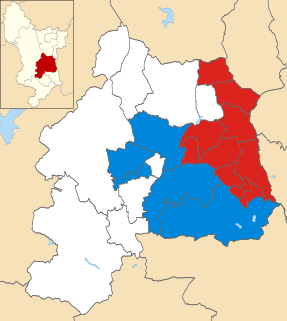
Elections to Amber Valley Borough Council in Derbyshire, England took place on Thursday 3 May 2012. One third of the council was up for election and the Conservative party held overall control of the council. Overall turnout in this election was 33.28 per cent.
The 2014 Newham London Borough Council election took place on 22 May 2014 to elect members of Newham London Borough Council in England. This was on the same day as other local elections.
The 2014 Sefton Metropolitan Borough Council election took on 22 May 2014 to elect one third of the council. It was held as part of the 2014 United Kingdom local elections.
Newham London Borough Council is elected every four years.
The South Yorkshire Police and Crime Commissioner is the police and crime commissioner of the South Yorkshire Police in South Yorkshire. The post was created on 21 November 2012, following an election held on 15 November 2012, and replaced the South Yorkshire Police Authority. The current South Yorkshire Police and Crime Commissioner is Alan Billings of the Labour Party, who was elected in 2014 and again in 2016. The role was created in 2012 and the initial office holder was Shaun Wright, who resigned on 16 September 2014. The police and crime commissioner is required to produce a strategic South Yorkshire Police and Crime Plan, setting out the priorities for the South Yorkshire Police, and their work is scrutinised by the South Yorkshire Police and Crime Panel.
The 2018 Brent London Borough Council election took place on 3 May 2018 to elect members of Brent London Borough Council in England. This was on the same day as other local elections.
The 2018 Great Yarmouth Borough Council election took place on 4 May 2018 to elect members of Great Yarmouth Borough Council in England. This was on the same day as other local elections in England. The Conservatives gained control of the council with UKIP which had previously won 10 seats being wiped out. Part of the Conservative success was attributed to former UKIP councillors defecting to them.
The 2018 Swindon Borough Council election took place on 3 May 2018, to elect members of Swindon Borough Council in England. This was on the same day as other local elections.