The 2002 Welwyn Hatfield District Council election took place on 2 May 2002 to elect members of Welwyn Hatfield District Council in Hertfordshire, England. One third of the council was up for election and the Conservative party gained overall control of the council from the Labour party. [1]
The Borough of Welwyn Hatfield is a local government district in southern Hertfordshire, England.
Hertfordshire is one of the home counties in England. It is bordered by Bedfordshire and Cambridgeshire to the north, Essex to the east, Greater London to the south, and Buckinghamshire to the west. For government statistical purposes, it is placed in the East of England region.
England is a country that is part of the United Kingdom. It shares land borders with Wales to the west and Scotland to the north-northwest. The Irish Sea lies west of England and the Celtic Sea lies to the southwest. England is separated from continental Europe by the North Sea to the east and the English Channel to the south. The country covers five-eighths of the island of Great Britain, which lies in the North Atlantic, and includes over 100 smaller islands, such as the Isles of Scilly and the Isle of Wight.
After the election, the composition of the council was
The results saw the Conservatives win a majority of 4 on the council after gaining 3 seats from Labour. [3] The Conservatives gained seats in Hatfield West and Sherrards wards, as well as one of the 2 seats being contested in Hatfield North, where 3 recounts were needed to separate the top 4 candidates who all finished within 17 votes of each other. [3] The Liberal Democrats failed to win any seats, but came second in 4 wards and were within 22 votes of the Conservative winner in Handside ward. [3] Overall turnout in the election was 35.3%, [4] a rise of about 3% on the 2000 election after all voters were able to get postal votes for the first time. [3]
Hatfield is a town and civil parish in Hertfordshire, England, in the borough of Welwyn Hatfield. It had a population of 29,616 in 2001, and 39,201 at the 2011 Census. The settlement is of Saxon origin. Hatfield House, home of the Marquess of Salisbury, forms the nucleus of the old town. From the 1930s when de Havilland opened a factory until the 1990s when British Aerospace closed it, aircraft design and manufacture employed more people there than any other industry. Hatfield was one of the post-war New Towns built around London and has much modernist architecture from the period. The University of Hertfordshire is based there.
The Liberal Democrats are a liberal political party in the United Kingdom. It is currently led by Vince Cable. They have 11 Members of Parliament in the House of Commons, 96 members of the House of Lords, one member of the European Parliament, five Members of the Scottish Parliament and one member in the Welsh Assembly and London Assembly. At the height of its influence, the party formed a coalition government with the Conservative Party from 2010 to 2015 with its leader Nick Clegg serving as Deputy Prime Minister.
Voter turnout is the percentage of eligible voters who cast a ballot in an election. Eligibility varies by country, and the voting-eligible population should not be confused with the total adult population. Age and citizenship status are often among the criteria used to determine eligibility, but some countries further restrict eligibility based on sex, race, or religion.
Party | Seats | Gains | Losses | Net gain/loss | Seats % | Votes % | Votes | +/− | |
---|---|---|---|---|---|---|---|---|---|
Conservative | 11 | 3 | 0 | +3 | 64.7 | 48.2 | 12,413 | +2.4% | |
Labour | 6 | 0 | 3 | -3 | 35.3 | 34.3 | 8,827 | -4.7% | |
Liberal Democrat | 0 | 0 | 0 | 0 | 0 | 17.5 | 4,506 | +4.5% |
Party | Candidate | Votes | % | ± | |
---|---|---|---|---|---|
Conservative | John Dean | 1,289 | 75.9 | +0.3 | |
Liberal Democrat | Catherine Edwards | 217 | 12.8 | +1.9 | |
Labour | Derek Marcus | 192 | 11.3 | -2.2 | |
Majority | 1,072 | 63.1 | +1.0 | ||
Turnout | 1,698 | ||||
Conservative hold | Swing |
Party | Candidate | Votes | % | ± | |
---|---|---|---|---|---|
Labour | Paul Orrett | 760 | 54.6 | -2.5 | |
Conservative | Stuart Jackson | 407 | 29.2 | -1.3 | |
Liberal Democrat | Helen Bassett | 225 | 16.2 | +3.7 | |
Majority | 353 | 25.4 | -1.2 | ||
Turnout | 1,392 | ||||
Labour hold | Swing |
Party | Candidate | Votes | % | ± | |
---|---|---|---|---|---|
Conservative | Carl Storer | 888 | 41.6 | -7.2 | |
Liberal Democrat | Daniel Cooke | 866 | 40.5 | +21.5 | |
Labour | Pascal Jacquemain | 383 | 17.9 | -4.3 | |
Majority | 22 | 1.1 | -25.5 | ||
Turnout | 2,137 | ||||
Conservative hold | Swing |
Party | Candidate | Votes | % | ± | |
---|---|---|---|---|---|
Labour | Colin Croft | 558 | 42.6 | -2.2 | |
Liberal Democrat | Hazel Laming | 470 | 35.9 | +10.1 | |
Conservative | Andrew Peffer | 283 | 21.6 | -7.8 | |
Majority | 88 | 6.7 | -8.7 | ||
Turnout | 1,311 | ||||
Labour hold | Swing |
Party | Candidate | Votes | % | ± | |
---|---|---|---|---|---|
Conservative | Peter O'Brien | 969 | 58.1 | +8.8 | |
Labour | Margaret White | 423 | 25.4 | -15.5 | |
Liberal Democrat | Lis Meyland-Smith | 276 | 16.5 | +6.7 | |
Majority | 546 | 32.7 | +24.3 | ||
Turnout | 1,668 | ||||
Conservative hold | Swing |
Party | Candidate | Votes | % | ± | |
---|---|---|---|---|---|
Conservative | Robert Davidson | 617 | |||
Labour | Bridgit Croft | 609 | |||
Conservative | John Morgan | 606 | |||
Labour | Linda Mendez | 600 | |||
Liberal Democrat | Richard Griffiths | 214 | |||
Liberal Democrat | Maurice Richardson | 206 | |||
Turnout | 2,852 | ||||
Conservative gain from Labour | Swing | ||||
Labour hold | Swing |
Party | Candidate | Votes | % | ± | |
---|---|---|---|---|---|
Conservative | Nicholas Atkinson | 838 | 50.5 | +9.3 | |
Labour | Samuel Smith | 625 | 37.7 | -9.3 | |
Liberal Democrat | Simon Archer | 195 | 11.8 | +0.0 | |
Majority | 213 | 12.8 | |||
Turnout | 1,658 | ||||
Conservative gain from Labour | Swing | ||||
Party | Candidate | Votes | % | ± | |
---|---|---|---|---|---|
Labour | Margaret Birleson | 780 | 60.2 | -3.1 | |
Conservative | Marian Pile | 356 | 27.5 | +2.3 | |
Liberal Democrat | Janet Gammage | 160 | 12.3 | +0.8 | |
Majority | 424 | 32.7 | -5.4 | ||
Turnout | 1,296 | ||||
Labour hold | Swing |
Party | Candidate | Votes | % | ± | |
---|---|---|---|---|---|
Labour | Alan Chesterman | 780 | 53.4 | -3.0 | |
Conservative | John Burnapp | 468 | 32.0 | -0.3 | |
Liberal Democrat | Jonathan Arch | 214 | 14.6 | +3.4 | |
Majority | 312 | 21.4 | -2.7 | ||
Turnout | 1,462 | ||||
Labour hold | Swing |
Party | Candidate | Votes | % | ± | |
---|---|---|---|---|---|
Conservative | John Nicholls | 1,196 | 79.6 | +20.1 | |
Liberal Democrat | Philip Edwards | 162 | 10.8 | +0.9 | |
Labour | Brenda Marcus | 145 | 9.6 | +0.9 | |
Majority | 1,034 | 68.8 | +31.2 | ||
Turnout | 1,503 | ||||
Conservative hold | Swing |
Party | Candidate | Votes | % | ± | |
---|---|---|---|---|---|
Conservative | Russell Le Page | 837 | 50.9 | -2.5 | |
Labour | Julia Harrison | 486 | 29.6 | -6.0 | |
Liberal Democrat | Ted Naseby | 321 | 19.5 | +8.5 | |
Majority | 351 | 21.3 | +3.5 | ||
Turnout | 1,644 | ||||
Conservative hold | Swing |
Party | Candidate | Votes | % | ± | |
---|---|---|---|---|---|
Labour | Jacqueline Russell | 637 | 59.1 | -0.7 | |
Conservative | David Perkins | 242 | 22.5 | -5.0 | |
Liberal Democrat | Gillian Armstrong-Bridges | 198 | 18.4 | +5.7 | |
Majority | 395 | 36.6 | +4.3 | ||
Turnout | 1,077 | ||||
Labour hold | Swing |
Party | Candidate | Votes | % | ± | |
---|---|---|---|---|---|
Conservative | John Scarff | 1,074 | 47.0 | +2.3 | |
Labour | Lynn Chesterman | 967 | 42.4 | -3.0 | |
Liberal Democrat | Louise Lotz | 242 | 10.6 | +0.7 | |
Majority | 107 | 4.6 | |||
Turnout | 2,283 | ||||
Conservative gain from Labour | Swing | ||||
Party | Candidate | Votes | % | ± | |
---|---|---|---|---|---|
Conservative | Patricia Storey | 622 | 63.3 | +0.0 | |
Labour | Margaret Toch | 225 | 22.9 | -2.6 | |
Liberal Democrat | Nigel Bain | 136 | 13.8 | +2.6 | |
Majority | 397 | 40.4 | +2.6 | ||
Turnout | 983 | ||||
Conservative hold | Swing |
Party | Candidate | Votes | % | ± | |
---|---|---|---|---|---|
Conservative | Margaret Scarff | 719 | 63.5 | ||
Labour | Jan Burnell | 216 | 19.1 | ||
Liberal Democrat | David Bartlett | 198 | 17.5 | ||
Majority | 503 | 44.4 | |||
Turnout | 1,133 | ||||
Conservative hold | Swing |
Party | Candidate | Votes | % | ± | |
---|---|---|---|---|---|
Conservative | Amanda Perkins | 1,002 | 60.8 | -2.7 | |
Labour | Julia Henderson | 441 | 26.7 | +5.7 | |
Liberal Democrat | Ian Skidmore | 206 | 12.5 | -3.0 | |
Majority | 561 | 34.1 | -8.4 | ||
Turnout | 1,649 | ||||
Conservative hold | Swing |
One third of Welwyn Hatfield Borough Council in Hertfordshire, England is elected each year, followed by one year without election. Since the last boundary changes in 2008, 48 councillors have been elected from 17 wards.
An election to Hertfordshire County Council took place on 4 June 2009 the date of the United Kingdom local elections, 2009. The whole elected council was up for election. The councillors were elected from the 77 wards, which return one each by first-past-the-post voting for a four-year term of office. The wards were the same as those used at the previous election in 2005.
The 2002 St Albans City and District Council election took place on 2 May 2002 to elect members of St Albans District Council in Hertfordshire, England. One third of the council was up for election and the council stayed under no overall control.
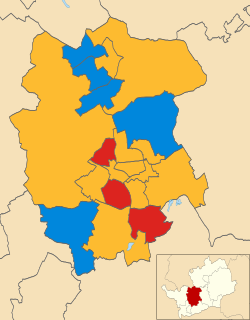
The 2003 St Albans City and District Council election took place on 1 May 2003 to elect members of St Albans District Council in Hertfordshire, England. One third of the council was up for election and the council stayed under no overall control.
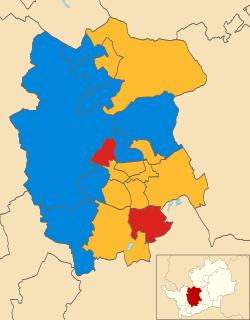
The 2006 St Albans City and District Council election took place on 4 May 2006 to elect members of St Albans District Council in Hertfordshire, England. One third of the council was up for election and the Liberal Democrats gained overall control of the council from no overall control.
The 2008 Wyre Forest District Council election took place on 1 May 2008 to elect members of Wyre Forest District Council in Worcestershire, England. One third of the council was up for election and the Conservative party gained overall control of the council from no overall control.
The 2000 Worcester City Council election took place on 4 May 2000 to elect members of Worcester District Council in Worcestershire, England. One third of the council was up for election and the Labour party lost overall control of the council to no overall control.
The 2003 Worcester City Council election took place on 1 May 2003 to elect members of Worcester District Council in Worcestershire, England. One third of the council was up for election and the Conservative party gained overall control of the council from no overall control.
The 1999 Welwyn Hatfield District Council election took place on 6 May 1999 to elect members of Welwyn Hatfield District Council in Hertfordshire, England. The whole council was up for election with boundary changes since the last election in 1998 increasing the number of seats by one. The Conservative party gained overall control of the council from the Labour party. Overall turnout in the election was 33.09%.
The 2000 Welwyn Hatfield District Council election took place on 6 May 2000 to elect members of Welwyn Hatfield District Council in Hertfordshire, England. One third of the council was up for election and the Labour party gained overall control of the council from no overall control. Overall turnout in the election was 31.71%, down from 33.09% in the 1999 election.
The 2003 Welwyn Hatfield District Council election took place on 1 May 2003 to elect members of Welwyn Hatfield District Council in Hertfordshire, England. One third of the council was up for election and the Conservative party stayed in overall control of the council.
The 2004 Welwyn Hatfield District Council election took place on 10 June 2004 to elect members of Welwyn Hatfield District Council in Hertfordshire, England. One third of the council was up for election and the Conservative party stayed in overall control of the council.
The 2006 Welwyn Hatfield District Council election took place on 4 May 2006 to elect members of Welwyn Hatfield District Council in Hertfordshire, England. One third of the council was up for election and the Conservative party stayed in overall control of the council.
The 2007 Welwyn Hatfield Borough Council election took place on 3 May 2007 to elect members of Welwyn Hatfield Borough Council in Hertfordshire, England. One third of the council was up for election and the Conservative party stayed in overall control of the council.
The 2008 Welwyn Hatfield Borough Council election took place on 1 May 2008 to elect members of Welwyn Hatfield Borough Council in Hertfordshire, England. The whole council was up for election with boundary changes since the last election in 2007. The Conservative party stayed in overall control of the council.
Local elections were held in the United Kingdom on 3 May 1979. The results provided some source of comfort to the Labour Party (UK), who recovered some lost ground from local election reversals in previous years, despite losing the general election to the Conservative Party on the same day.
The 2003 Rushmoor Council election took place on 1 May 2003 to elect members of Rushmoor Borough Council in Hampshire, England. One third of the council was up for election and the Conservative party stayed in overall control of the council.
The 2008 Sunderland Council election took place on 1 May 2008 to elect members of Sunderland Metropolitan Borough Council in Tyne and Wear, England. One third of the council was up for election and the Labour party stayed in overall control of the council.
The 2007 West Oxfordshire District Council election took place on 3 May 2007 to elect members of West Oxfordshire District Council in Oxfordshire, England. One third of the council was up for election and the Conservative party stayed in overall control of the council.