Elections to Dacorum Borough Council in Hertfordshire, England were held on 3 May 2007. The whole council was up for election with boundary changes since the last election in 2003 reducing the number of seats by one. [1] The Conservative party remained in overall control of the council after winning 44 of the 51 seats which they partly attributed to national events, while the Liberal Democrats lost 2 seats but were pleased to become the official opposition. [2]
The Borough of Dacorum is a local government district in Hertfordshire, England that includes the towns of Hemel Hempstead, Berkhamsted, Tring and the western part of Kings Langley. The district, which was formed in 1974, had a population of 137,799 in 2001. Its name was taken from the old hundred of Dacorum which covered approximately the same area. It is the westernmost of Hertfordshire's districts, being bordered to the west by the Chiltern and Aylesbury Vale districts of Buckinghamshire.
Hertfordshire is one of the home counties in England. It is bordered by Bedfordshire and Cambridgeshire to the north, Essex to the east, Greater London to the south, and Buckinghamshire to the west. For government statistical purposes, it is placed in the East of England region.
England is a country that is part of the United Kingdom. It shares land borders with Wales to the west and Scotland to the north-northwest. The Irish Sea lies west of England and the Celtic Sea lies to the southwest. England is separated from continental Europe by the North Sea to the east and the English Channel to the south. The country covers five-eighths of the island of Great Britain, which lies in the North Atlantic, and includes over 100 smaller islands, such as the Isles of Scilly and the Isle of Wight.
Party | Seats | Gains | Losses | Net gain/loss | Seats % | Votes % | Votes | +/− | |
---|---|---|---|---|---|---|---|---|---|
Conservative | 44 | +13 | 86.3 | 54.2 | 45,226 | +9.4% | |||
Liberal Democrat | 5 | -2 | 9.8 | 20.5 | 17,136 | -3.2% | |||
Labour | 2 | -12 | 3.9 | 20.3 | 16,928 | -9.3% | |||
Green | 0 | 0 | 0 | 3.0 | 2,516 | +1.8% | |||
Independent | 0 | 0 | 0 | 1.3 | 1,083 | +0.8% | |||
National Front | 0 | 0 | 0 | 0.6 | 541 | +0.6% | |||
Party | Candidate | Votes | % | ± | |
---|---|---|---|---|---|
Conservative | Allan Lawson | 785 | |||
Conservative | William Wyatt-Lowe | 752 | |||
Labour | Dawn Barnes | 410 | |||
Labour | Helen Leach | 370 | |||
Liberal Democrat | Doreen Coburn | 155 | |||
Liberal Democrat | Christine Hardy | 138 | |||
Turnout | 2,610 | 35.8 | |||
Party | Candidate | Votes | % | ± | |
---|---|---|---|---|---|
Labour | Keith White | 518 | |||
Conservative | Keith Reid | 508 | |||
Labour | Susan White | 502 | |||
Conservative | Angela Ashdown | 481 | |||
Liberal Democrat | Sylvia Fry | 200 | |||
Liberal Democrat | Geoffrey Lawrence | 178 | |||
Turnout | 2,387 | 31.1 | |||
Party | Candidate | Votes | % | ± | |
---|---|---|---|---|---|
Conservative | Mike Edwards | 475 | 57.0 | ||
Liberal Democrat | Michael James | 306 | 36.7 | ||
Labour | Tony Shaw | 53 | 6.4 | ||
Majority | 169 | 20.3 | |||
Turnout | 834 | 44.8 | |||
Party | Candidate | Votes | % | ± | |
---|---|---|---|---|---|
Conservative | Brian Ayling | 1,201 | |||
Conservative | Colin Peter | 1,087 | |||
Conservative | Michael Clark | 1,084 | |||
Labour | Hazel Mackie | 367 | |||
Labour | Beryl Milnes | 335 | |||
Labour | Michael Sheehan | 321 | |||
Liberal Democrat | Ashley Burton | 258 | |||
Liberal Democrat | Margaret Waugh | 234 | |||
Liberal Democrat | Ian Senior | 212 | |||
Green | Jeffrey Fanstone | 206 | |||
Turnout | 5,305 | 31.3 | |||
Party | Candidate | Votes | % | ± | |
---|---|---|---|---|---|
Conservative | Nicholas Tiley | 791 | 74.8 | ||
Liberal Democrat | Robert Irving | 184 | 17.4 | ||
Labour | Sharon Greene | 83 | 7.8 | ||
Majority | 607 | 57.4 | |||
Turnout | 1,058 | 50.0 | |||
Party | Candidate | Votes | % | ± | |
---|---|---|---|---|---|
Conservative | Michelle Lancaster | 721 | |||
Conservative | Suqlain Mahmood | 655 | |||
Labour | Gary Cook | 537 | |||
Labour | Bernard Gronert | 525 | |||
Liberal Democrat | Nicole Daly | 206 | |||
Liberal Democrat | Alan Waugh | 175 | |||
Green | Malcolm Waterton | 128 | |||
Turnout | 2,947 | 35.7 | |||
Party | Candidate | Votes | % | ± | |
---|---|---|---|---|---|
Conservative | Andrew Fairburn | 1,049 | |||
Conservative | Jonathan Mole | 965 | |||
Liberal Democrat | Elizabeth Patterson | 721 | |||
Liberal Democrat | Victor Earl | 690 | |||
Labour | James Mackie | 113 | |||
Labour | Alan Olive | 104 | |||
Turnout | 3,642 | 40.4 | |||
Party | Candidate | Votes | % | ± | |
---|---|---|---|---|---|
Conservative | Julie Laws | 722 | |||
Conservative | Stephen Bateman | 698 | |||
Liberal Democrat | Philip Gibbs | 627 | |||
Liberal Democrat | John Lythgoe | 603 | |||
Independent | Norman Cutting | 341 | |||
Green | Anne Duvall | 152 | |||
Labour | Sylvia Shaw | 74 | |||
Labour | Mary Khamis | 73 | |||
Turnout | 3,290 | 38.7 | |||
Party | Candidate | Votes | % | ± | |
---|---|---|---|---|---|
Conservative | Carol Green | 860 | |||
Conservative | Ian Reay | 837 | |||
Liberal Democrat | Geraldine Corry | 615 | |||
Liberal Democrat | Garrick Stevens | 601 | |||
Labour | Peter Norman | 154 | |||
Labour | Natasha Littlechild | 123 | |||
Turnout | 3,190 | 39.0 | |||
Party | Candidate | Votes | % | ± | |
---|---|---|---|---|---|
Conservative | Richard Roberts | 1,734 | |||
Conservative | Gill Chapman | 1,711 | |||
Conservative | Gbola Adeleke | 1,450 | |||
Independent | Sharon Sims | 417 | |||
Liberal Democrat | David Griffiths | 385 | |||
Green | Martin Humphrew | 280 | |||
Liberal Democrat | Rick Martin | 252 | |||
Liberal Democrat | Barry Batchelor | 243 | |||
Labour | Richard Milnes | 230 | |||
Labour | Stephanie Barnes | 218 | |||
Labour | Scott Stimpson | 174 | |||
Turnout | 7,094 | 40.2 | |||
Party | Candidate | Votes | % | ± | |
---|---|---|---|---|---|
Conservative | Janice Marshall | 1,470 | |||
Conservative | Neil Harden | 1,430 | |||
Conservative | Andrew Williams | 1,306 | |||
Labour | Julia Coleman | 520 | |||
Labour | Helen Heenan | 429 | |||
Labour | Tim Lyle | 416 | |||
Liberal Democrat | Jennifer Simmons | 402 | |||
Liberal Democrat | Stuart Watkin | 375 | |||
Liberal Democrat | Ronald Tindall | 352 | |||
Green | Alan Johnson | 231 | |||
Green | Hazel Johnson | 216 | |||
Turnout | 7,147 | 41.7 | |||
Party | Candidate | Votes | % | ± | |
---|---|---|---|---|---|
Conservative | Fiona Guest | 981 | |||
Conservative | John Whitman | 935 | |||
Conservative | Janice Speaight | 931 | |||
Labour | Margaret Coxage | 915 | |||
Labour | Ronald Coxage | 824 | |||
Labour | Anne-Lise Johnsen | 781 | |||
Green | Jane Cousins | 327 | |||
National Front | Bernard Franklin | 327 | |||
Independent | Julie James | 325 | |||
Liberal Democrat | Stephen Wilson | 280 | |||
Liberal Democrat | Neil Kennedy | 257 | |||
Liberal Democrat | Lynda Roe | 256 | |||
Turnout | 7,139 | 39.5 | |||
Party | Candidate | Votes | % | ± | |
---|---|---|---|---|---|
Conservative | Roger Taylor | 623 | |||
Conservative | Jai Restall | 554 | |||
Labour | Maureen Flint | 527 | |||
Labour | Stefan Fisher | 434 | |||
Liberal Democrat | Andrew Michie | 161 | |||
Liberal Democrat | Margaret Colquhoun | 124 | |||
Green | Paul Harris | 124 | |||
Turnout | 2,547 | 34.3 | |||
Party | Candidate | Votes | % | ± | |
---|---|---|---|---|---|
Conservative | Ann Ryan | 956 | |||
Conservative | Alexander Bhinder | 901 | |||
Conservative | Terence Douris | 889 | |||
Labour | An Fisher | 609 | |||
Labour | Michael Maloney | 514 | |||
Labour | Richard Walsh | 497 | |||
Liberal Democrat | John Blackman | 229 | |||
National Front | Simon Deacon | 214 | |||
Liberal Democrat | Christopher Fryd | 154 | |||
Liberal Democrat | Martin Rance | 147 | |||
Turnout | 5,110 | 32.6 | |||
Party | Candidate | Votes | % | ± | |
---|---|---|---|---|---|
Labour | Michael Moore | 404 | |||
Conservative | Robert Wright | 396 | |||
Labour | Ellen Halden | 388 | |||
Conservative | Adam Wyatt-Lowe | 358 | |||
Liberal Democrat | Christopher Angell | 183 | |||
Liberal Democrat | Jean Blackman | 181 | |||
Green | Paul Sandford | 112 | |||
Turnout | 2,022 | 29.4 | |||
Party | Candidate | Votes | % | ± | |
---|---|---|---|---|---|
Liberal Democrat | Brenda Link | 739 | |||
Liberal Democrat | Lloyd Harris | 604 | |||
Labour | Elio Gomez | 522 | |||
Labour | Bert Bannister | 488 | |||
Conservative | Kevin Minier | 293 | |||
Conservative | Miriam Wiedman-Smith | 237 | |||
Turnout | 2,883 | 38.4 | |||
Party | Candidate | Votes | % | ± | |
---|---|---|---|---|---|
Conservative | Alan Anderson | 1,048 | |||
Conservative | Bob Mclean | 958 | |||
Labour | Gerald Angiolini | 376 | |||
Labour | Eira Mills | 309 | |||
Green | Jenna Selby | 254 | |||
Liberal Democrat | Michael Morton | 187 | |||
Liberal Democrat | Gerald Coulter | 173 | |||
Turnout | 3,305 | 44.0 | |||
Party | Candidate | Votes | % | ± | |
---|---|---|---|---|---|
Conservative | Hazel Bassadone | 1,624 | |||
Conservative | Margaret Griffiths | 1,523 | |||
Conservative | Graham Sutton | 1,506 | |||
Labour | Douglas Jones | 463 | |||
Labour | Alan Dickson | 448 | |||
Labour | Jean Langdon | 432 | |||
Liberal Democrat | Thomas Potter | 290 | |||
Liberal Democrat | Sheila Daly | 271 | |||
Liberal Democrat | Adam Roe | 234 | |||
Green | Gillian Storey | 192 | |||
Turnout | 6,983 | 37.0 | |||
Party | Candidate | Votes | % | ± | |
---|---|---|---|---|---|
Conservative | Lucy Foster | 511 | 64.8 | ||
Labour | Norman Jones | 182 | 23.1 | ||
Liberal Democrat | Colin Roe | 95 | 12.1 | ||
Majority | 329 | 41.7 | |||
Turnout | 788 | 37.8 | |||
Party | Candidate | Votes | % | ± | |
---|---|---|---|---|---|
Conservative | Alan Fantham | 627 | 70.0 | ||
Liberal Democrat | Julian Critcher | 203 | 22.7 | ||
Labour | Doreen Hills | 66 | 7.4 | ||
Majority | 424 | 47.3 | |||
Turnout | 896 | 41.2 | |||
Party | Candidate | Votes | % | ± | |
---|---|---|---|---|---|
Liberal Democrat | Nicholas Hollinghurst | 824 | |||
Liberal Democrat | Denise Rance | 793 | |||
Conservative | John Bowden | 661 | |||
Conservative | Stan Mills | 651 | |||
Green | Colin Kruger | 156 | |||
Labour | Douglas Drury | 76 | |||
Labour | Fran Howat | 72 | |||
Turnout | 3,233 | 41.5 | |||
Party | Candidate | Votes | % | ± | |
---|---|---|---|---|---|
Conservative | Penelope Hearn | 660 | 63.3 | ||
Liberal Democrat | Rosemarie Hollinghurst | 349 | 33.5 | ||
Labour | Philip Gonzalez | 33 | 3.2 | ||
Majority | 311 | 29.8 | |||
Turnout | 1,042 | 47.7 | |||
Party | Candidate | Votes | % | ± | |
---|---|---|---|---|---|
Conservative | Derek Townsend | 919 | |||
Liberal Democrat | Christopher Townsend | 895 | |||
Liberal Democrat | John Allan | 883 | |||
Conservative | Olive Conway | 866 | |||
Labour | Jan Kalaher | 93 | |||
Labour | Frank Burgess | 88 | |||
Turnout | 3,744 | 47.8 | |||
Party | Candidate | Votes | % | ± | |
---|---|---|---|---|---|
Conservative | Herbert Chapman | 1,093 | |||
Conservative | David Lloyd | 1,068 | |||
Labour | Joseph Wales | 167 | |||
Liberal Democrat | Lesley Murray | 153 | |||
Labour | Kit Wales | 152 | |||
Liberal Democrat | Angela Tindall | 141 | |||
Turnout | 2,774 | 36.2 | |||
Party | Candidate | Votes | % | ± | |
---|---|---|---|---|---|
Conservative | Stephen Holmes | 808 | |||
Conservative | Colette Wyatt-Lowe | 743 | |||
Labour | Sally Anderson | 215 | |||
Labour | Barbara Gronert | 204 | |||
Green | Helen Batchelor | 138 | |||
Liberal Democrat | Daniel Bonnett | 115 | |||
Liberal Democrat | Paul Elley | 103 | |||
Turnout | 2,326 | 29.2 | |||
The Metropolitan Borough of Wigan is a metropolitan borough of Greater Manchester, in North West England. It is named after its largest component town and former county borough, Wigan and includes the towns and villages of Leigh, part of Ashton-in-Makerfield, Ince-in-Makerfield, Hindley, Orrell, Standish, Atherton, Tyldesley, Golborne, Lowton, Billinge, Astley, Haigh and Aspull. The borough was formed in 1974 and is an amalgamation of several former local government districts and parishes. The borough has three civil parishes and lies directly to the west of the City of Salford and southwest of the Metropolitan Borough of Bolton. The local authority is Wigan Metropolitan Borough Council.
Allerdale Borough Council in Cumbria, England is elected every four years. Since the last boundary changes in 1999, 56 councillors have been elected from 31 wards.
Dacorum Borough Council in Hertfordshire, England is elected every four years. Since the last boundary changes in 2007, 51 councillors have been elected from 25 wards.
One third of Amber Valley Borough Council in Derbyshire, England is elected each year, followed by one year without election. Since the last boundary changes in 2000, 45 councillors have been elected from 23 wards.
Elections for the Council in the London Borough of Croydon are held every four years to elect 70 councillors. At the last elections, which were held in May 2014, 30 Conservative councillors and 40 Labour councillors, providing a Labour majority of ten seats.
One third of Knowsley Metropolitan Borough Council in Merseyside, England is elected each year, followed by one year without election. Following boundary changes in 2004, 63 councillors were elected from 31 wards. Further boundary changes in 2016 reduced the council to 45 seats and 15 wards.
One third of Bury Metropolitan Borough Council in Greater Manchester, England is elected each year, followed by one year without election. Since the last boundary changes in 2004, 51 councillors have been elected from 17 wards.
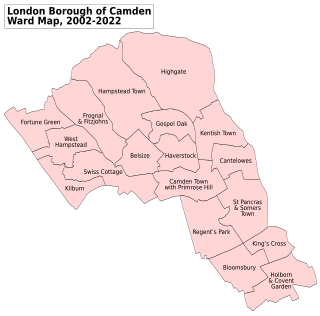
The Camden London Borough Council in London, England is elected every four years. Since the last boundary changes in 2002, 54 councillors have been elected from 18 wards.
One third of Oldham Metropolitan Borough Council in Greater Manchester, England is elected each year, followed by one year without election. Since the last boundary changes in 2004, 60 councillors have been elected from 20 wards.
Hertfordshire County Council in England is elected every four years. Since the last boundary changes, that took effect for the 2001 election, 77 councillors are elected for single member districts.
One third of Runnymede Borough Council in Surrey, England is elected each year, followed by one year where there is an election to Surrey County Council instead. The council is divided up into 14 wards, electing 42 councillors, since the last boundary changes in 2000.
Elections to Barrow-in-Furness Borough Council was held on 1 May 2008. The whole of the council was up for election, with the number of councillors falling from 38 to 36, as a result of ward boundary changes enacted in February 2008. Councillors were elected for terms ranging between two and four years; where more than one councillor was elected in a ward, the councillor with the highest number of votes was granted the longer term.
Elections to Dacorum Borough Council in Hertfordshire, England were held on 6 May 1999. The election in Highfield St Paul was delayed after the death of a Conservative candidate until a by-election was held on 3 June. The whole council was up for election with boundary changes since the Dacorum Council election, 1995|last election in 1995 reducing the number of seats by 6. The Conservative party gained overall control of the council from no overall control, although it would fall back to no overall control after the by-election in June.
Elections to Dacorum Borough Council in Hertfordshire, England were held on 1 May 2003. The whole council was up for election and the Conservative party gained overall control after previously relying on the mayor's casting vote for control. Overall turnout was 32.87%.
The 2008 Woking Council election took place on 1 May 2008 to elect members of Woking Borough Council in Surrey, England. One third of the council was up for election and the Conservative party stayed in overall control of the council.
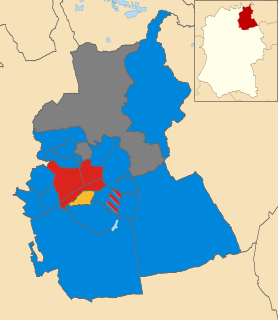
The 2007 Welwyn Hatfield Borough Council election took place on 3 May 2007 to elect members of Welwyn Hatfield Borough Council in Hertfordshire, England. One third of the council was up for election and the Conservative party stayed in overall control of the council.
The 2007 Southend-on-Sea Council election took place on 3 May 2007 to elect members of Southend-on-Sea Unitary Council in Essex, England. One third of the council was up for election and the Conservative party stayed in overall control of the council.
The 2008 Swindon Borough Council election took place on 4 May 2008 to elect members of Swindon Unitary Council in Wiltshire, England. One third of the council was up for election and the Conservative party stayed in overall control of the council.
The 2006 Solihull Metropolitan Borough Council election took place on 4 May 2006 to elect members of Solihull Metropolitan Borough Council in the West Midlands, England. One third of the council was up for election and the Conservative party stayed in overall control of the council.
The 2007 Solihull Metropolitan Borough Council election took place on 4 May 2007 to elect members of Solihull Metropolitan Borough Council in the West Midlands, England. One third of the council was up for election and the Conservative party lost overall control of the council to no overall control.