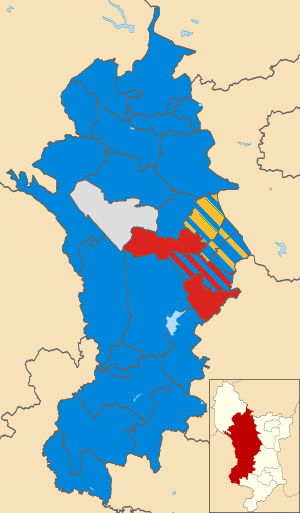
The 2011 Derbyshire Dales District Council election took place on 5 May 2011 to elect members of Derbyshire Dales District Council in Derbyshire, England. The whole council was up for election and the Conservative party stayed in overall control of the council. [1]
Derbyshire Dales is a local government district in Derbyshire, England. The population of the district as taken at the 2011 Census was 71,116. Much of the district is situated in the Peak District, although most of its population lies along the River Derwent.
Non-metropolitan districts, or colloquially "shire districts", are a type of local government district in England. As created, they are sub-divisions of non-metropolitan counties in a two-tier arrangement.
England is a country that is part of the United Kingdom. It shares land borders with Wales to the west and Scotland to the north-northwest. The Irish Sea lies west of England and the Celtic Sea lies to the southwest. England is separated from continental Europe by the North Sea to the east and the English Channel to the south. The country covers five-eighths of the island of Great Britain, which lies in the North Atlantic, and includes over 100 smaller islands, such as the Isles of Scilly and the Isle of Wight.
The Conservatives increased their majority on the council after winning 28 seats at the election in May. [2] They gained 4 seats from the Liberal Democrats, more than offsetting losing 1 seat to Labour. [2] This meant Labour went up by one to five seats, while the Liberal Democrats dropped to four, losing half of the seats they had won in 2007, and there remained one independent. [2] [3] Overall turnout at the election was 50.8%. [2]
The Liberal Democrats are a liberal political party in the United Kingdom. They presently have 11 Members of Parliament in the House of Commons, 96 members of the House of Lords, and one member of the European Parliament. They also have five Members of the Scottish Parliament and a member each in the Welsh Assembly and London Assembly. The party reached the height of its influence in the early 2010s, forming a junior partner in a coalition government from 2010 to 2015. It is presently led by Vince Cable.
The Labour Party is a centre-left political party in the United Kingdom which has been described as an alliance of social democrats, democratic socialists and trade unionists. The party's platform emphasises greater state intervention, social justice and strengthening workers' rights.
Voter turnout is the percentage of eligible voters who cast a ballot in an election. Eligibility varies by country, and the voting-eligible population should not be confused with the total adult population. Age and citizenship status are often among the criteria used to determine eligibility, but some countries further restrict eligibility based on sex, race, or religion.
The Conservatives gained 4 seats from the Liberal Democrats in the wards of Darley Dale, Matlock All Saints and Matlock St Giles. [2] However the Conservatives did lose 1 seat to Labour in Masson, by a 5-vote margin. [2] In total of the 38 seats elected in May, 15 new councillors were elected. [2]
Darley Dale, also known simply as Darley, is a town and civil parish in the Derbyshire Dales district of Derbyshire, England, with a population of around 6,000. It lies north of Matlock, on the River Derwent and the A6 road.The town forms part of the urban area of Matlock. It is a commuter town for workers in Matlock.
Matlock is the county town of Derbyshire, England. It is situated at the south eastern part of the Peak District, with the National Park directly to the west. The town is twinned with the French town Eaubonne. The former spa resort Matlock Bath lies immediately south of the town on the A6. The civil parish of Matlock Town had a population in the 2011 UK census of 9,543. The population of the wider Matlock urban area is approximately 20,000. The Matlock area is considered to include Wirksworth, owing to the close proximity of the towns.
A Councillor is a member of a local government council.
The election in Stanton ward was delayed until 23 June after no candidates were nominated for the seat originally. [4] At the delayed election the Conservatives held the seat and therefore had 29 of the 39 councillors. [4]
Party | Seats | Gains | Losses | Net gain/loss | Seats % | Votes % | Votes | +/− | |
---|---|---|---|---|---|---|---|---|---|
Conservative | 29 | 4 | 1 | +3 | 74.4 | 48.7 | 21,330 | -0.3% | |
Labour | 5 | 1 | 0 | +1 | 12.8 | 27.8 | 12,176 | +17.9% | |
Liberal Democrat | 4 | 0 | 4 | -4 | 10.3 | 18.1 | 7,903 | -15.9% | |
Independent | 1 | 0 | 0 | 0 | 2.6 | 2.9 | 1,261 | -1.5% | |
Green | 0 | 0 | 0 | 0 | 0 | 2.3 | 1,016 | -0.4% | |
UKIP | 0 | 0 | 0 | 0 | 0 | 0.2 | 86 | +0.2% | |
7 Conservative candidates were unopposed at the election. [5] The above results include the delayed election for Stanton ward.
Party | Candidate | Votes | % | ± | |
---|---|---|---|---|---|
Conservative | Stephen Bull | 785 | |||
Conservative | Tony Millward | 673 | |||
Labour | Rob Whyman | 407 | |||
Turnout | 1,865 | 41.3 | |||
Conservative hold | Swing | ||||
Party | Candidate | Votes | % | ± | |
---|---|---|---|---|---|
Conservative | Andrew Lewer | 883 | |||
Conservative | Tom Donnelly | 583 | |||
Labour | Che Lear Page | 464 | |||
Turnout | 1,930 | 40.9 | |||
Conservative hold | Swing | ||||
Party | Candidate | Votes | % | ± | |
---|---|---|---|---|---|
Conservative | Judith Twigg | 1,378 | |||
Conservative | Carol Walker | 1,245 | |||
Conservative | Philippa Tilbrook | 1,121 | |||
Labour | Pam Russell | 773 | |||
Turnout | 4,517 | 52.1 | +7 | ||
Conservative hold | Swing | ||||
Party | Candidate | Votes | % | ± | |
---|---|---|---|---|---|
Conservative | Janet Goodison | 430 | 54.2 | ||
Independent | Christopher Furness | 364 | 45.8 | ||
Majority | 66 | 8.3 | |||
Turnout | 794 | 52.5 | |||
Conservative hold | Swing | ||||
Party | Candidate | Votes | % | ± | |
---|---|---|---|---|---|
Conservative | Angus Jenkins | 517 | 74.1 | ||
Independent | Alan Hodkinson | 181 | 25.9 | ||
Majority | 336 | 48.1 | |||
Turnout | 698 | 51.9 | |||
Conservative hold | Swing | ||||
Party | Candidate | Votes | % | ± | |
---|---|---|---|---|---|
Conservative | Cate Hunt | unopposed | |||
Conservative hold | Swing | ||||
Party | Candidate | Votes | % | ± | |
---|---|---|---|---|---|
Conservative | Lewis Rose | unopposed | |||
Conservative hold | Swing | ||||
Party | Candidate | Votes | % | ± | |
---|---|---|---|---|---|
Conservative | Michael Longden | unopposed | |||
Conservative hold | Swing | ||||
Party | Candidate | Votes | % | ± | |
---|---|---|---|---|---|
Conservative | Andrew Shirley | 512 | 55.4 | ||
Independent | Ian Bates | 326 | 35.3 | ||
UKIP | Charles Swabey | 86 | 9.3 | ||
Majority | 186 | 20.1 | |||
Turnout | 924 | 61.8 | |||
Conservative hold | Swing | ||||
Party | Candidate | Votes | % | ± | |
---|---|---|---|---|---|
Liberal Democrat | David Fearn | 731 | |||
Liberal Democrat | David Burton | 729 | |||
Conservative | Andrew Statham | 720 | |||
Liberal Democrat | Nigel Allwood | 694 | |||
Conservative | Katherine Staves | 688 | |||
Conservative | Neil MacPherson | 610 | |||
Labour | Julie Morrison | 578 | |||
Labour | Finn Page | 554 | |||
Labour | Phil Rogers | 512 | |||
Turnout | 5,816 | 48.6 | +8 | ||
Liberal Democrat hold | Swing | ||||
Conservative gain from Liberal Democrat | Swing | ||||
Party | Candidate | Votes | % | ± | |
---|---|---|---|---|---|
Conservative | Richard Fitzherbert | 594 | 76.6 | ||
Labour | Eric Page | 181 | 23.4 | ||
Majority | 413 | 53.3 | |||
Turnout | 775 | 55.3 | |||
Conservative hold | Swing | ||||
Party | Candidate | Votes | % | ± | |
---|---|---|---|---|---|
Conservative | Albert Catt | 660 | 81.7 | +12.9 | |
Labour | Katy Brown | 148 | 18.3 | +18.3 | |
Majority | 512 | 63.4 | +25.8 | ||
Turnout | 808 | 53.4 | +5 | ||
Conservative hold | Swing | ||||
Party | Candidate | Votes | % | ± | |
---|---|---|---|---|---|
Conservative | David Chapman | unopposed | |||
Conservative hold | Swing | ||||
Party | Candidate | Votes | % | ± | |
---|---|---|---|---|---|
Conservative | Jacque Bevan | 962 | |||
Conservative | Jean Monks | 728 | |||
Labour | Briony Robinson | 605 | |||
Labour | Val Robinson | 562 | |||
Liberal Democrat | David Hoskin | 359 | |||
Liberal Democrat | Jim Tweeddale | 352 | |||
Turnout | 3,568 | 59.7 | +13 | ||
Conservative hold | Swing | ||||
Party | Candidate | Votes | % | ± | |
---|---|---|---|---|---|
Conservative | Richard Bright | unopposed | |||
Conservative hold | Swing | ||||
Party | Candidate | Votes | % | ± | |
---|---|---|---|---|---|
Independent | David Frederickson | 390 | 52.8 | -13.4 | |
Conservative | Mitch Blythe | 349 | 47.2 | +13.4 | |
Majority | 41 | 5.5 | -27.0 | ||
Turnout | 739 | 57.4 | +12 | ||
Independent hold | Swing | ||||
Party | Candidate | Votes | % | ± | |
---|---|---|---|---|---|
Conservative | Neil Horton | unopposed | |||
Conservative hold | Swing | ||||
Party | Candidate | Votes | % | ± | |
---|---|---|---|---|---|
Conservative | Garry Purdy | 593 | |||
Labour | Bob Cartwright | 571 | |||
Conservative | Peter Hume | 566 | |||
Labour | Nick Whitehead | 534 | |||
Turnout | 2,264 | 50.3 | +10 | ||
Conservative hold | Swing | ||||
Labour gain from Conservative | Swing | ||||
Party | Candidate | Votes | % | ± | |
---|---|---|---|---|---|
Liberal Democrat | Sue Burfoot | 931 | |||
Conservative | Geoff Stevens | 808 | |||
Conservative | Ann Elliott | 796 | |||
Liberal Democrat | David Barker | 789 | |||
Conservative | Sam Gregory | 730 | |||
Liberal Democrat | David Jones | 715 | |||
Labour | Andrew Botham | 709 | |||
Turnout | 5,478 | 50.6 | +5 | ||
Liberal Democrat hold | Swing | ||||
Conservative hold | Swing | ||||
Conservative gain from Liberal Democrat | Swing | ||||
Party | Candidate | Votes | % | ± | |
---|---|---|---|---|---|
Liberal Democrat | Steve Flitter | 950 | |||
Conservative | Barrie Tipping | 716 | |||
Conservative | Jacquie Stevens | 691 | |||
Liberal Democrat | Barry Hopkinson | 670 | |||
Liberal Democrat | Cate Hopkinson | 655 | |||
Labour | Sally Davies | 632 | |||
Conservative | Richard Walsh | 604 | |||
Labour | Simon Peters | 562 | |||
Turnout | 5,480 | 48.6 | +6 | ||
Liberal Democrat hold | Swing | ||||
Conservative gain from Liberal Democrat | Swing | ||||
Party | Candidate | Votes | % | ± | |
---|---|---|---|---|---|
Conservative | Kenneth Bull | unopposed | |||
Conservative hold | Swing | ||||
Party | Candidate | Votes | % | ± | |
---|---|---|---|---|---|
Conservative | Jennifer Bower | 338 | 45.7 | -18.8 | |
Liberal Democrat | Sue Barber | 244 | 33.0 | +14.4 | |
Labour | Lytton Page | 157 | 21.2 | +21.2 | |
Majority | 94 | 12.7 | -34.0 | ||
Turnout | 739 | 49.8 | +14 | ||
Conservative hold | Swing | ||||
Party | Candidate | Votes | % | ± | |
---|---|---|---|---|---|
Labour | Colin Swindell | 690 | 78.7 | +49.1 | |
Conservative | Rebecca Swindell | 187 | 21.3 | -22.9 | |
Majority | 503 | 57.4 | |||
Turnout | 877 | 62.6 | +3 | ||
Labour hold | Swing | ||||
Party | Candidate | Votes | % | ± | |
---|---|---|---|---|---|
Labour | Irene Ratcliffe | 1,293 | |||
Labour | Peter Slack | 1,048 | |||
Labour | Mike Ratcliffe | 1,023 | |||
Conservative | Philip Cope | 626 | |||
Green | Chris Spencer | 532 | |||
Conservative | Susan Bull | 517 | |||
Green | Josh Stockell | 484 | |||
Conservative | John Smith | 474 | |||
Turnout | 5,997 | 49.8 | +9 | ||
Labour hold | Swing | ||||
The election in Stanton was delayed until 23 June 2011 after no candidates originally stood for the seat at the May election. [4] The seat was held for the Conservatives by Joanne Wild with a 73-vote majority. [6]
Party | Candidate | Votes | % | ± | |
---|---|---|---|---|---|
Conservative | Joanne Wild | 246 | 48.9 | -10.7 | |
Labour | Julie Morrison | 173 | 34.4 | +34.4 | |
Liberal Democrat | Anthony Allwood | 84 | 16.7 | -23.7 | |
Majority | 73 | 14.5 | -4.6 | ||
Turnout | 503 | 34.1 | -5 | ||
Conservative hold | Swing | ||||
Chris Furness was elected without opposition on 12 January 2012 to hold Bradwell for the Conservative party, after having been the losing independent candidate at the 2011 election. [7] The vacancy came after the death of Conservative councillor Janet Goodison in October 2011. [8]
Party | Candidate | Votes | % | ± | |
---|---|---|---|---|---|
Conservative | Chris Furness | unopposed | |||
Conservative hold | Swing | ||||
The 2008 Harlow District Council election took place on 1 May 2008 to elect members of Harlow District Council in Essex, England. One third of the council was up for election and the Conservative party gained overall control of the council from no overall control.
The 2011 North Devon District Council election took place on 5 May 2011 to elect members of North Devon District Council in Devon, England. The whole council was up for election and the Conservative party lost overall control of the council to no overall control.
The 2007 Hertsmere Borough Council election took place on 3 May 2007 to elect members of Hertsmere Borough Council in Hertfordshire, England. One third of the council was up for election and the Conservative party stayed in overall control of the council.
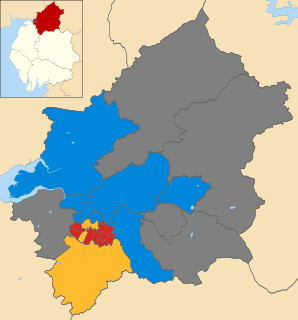
The 2006 Carlisle City Council election took place on 4 May 2006 to elect members of Carlisle District Council in Cumbria, England. One third of the council was up for election and the council stayed under no overall control.
The 2007 Carlisle City Council election took place on 3 May 2007 to elect members of Carlisle District Council in Cumbria, England. One third of the council was up for election and the council stayed under no overall control.
The 2011 Carlisle City Council election took place on 5 May 2011 to elect members of Carlisle District Council in Cumbria, England. One third of the council was up for election and the council stayed under no overall control.
The 2003 Derbyshire Dales District Council election took place on 1 May 2003 to elect members of Derbyshire Dales District Council in Derbyshire, England. The whole council was up for election with boundary changes since the last election in 1999. The Conservative party stayed in overall control of the council.
The 2007 Derbyshire Dales District Council election took place on 3 May 2007 to elect members of Derbyshire Dales District Council in Derbyshire, England. The whole council was up for election and the Conservative party stayed in overall control of the council.
The 2011 Wealden District Council election took place on 5 May 2011 to elect members of Wealden District Council in East Sussex, England. The whole council was up for election and the Conservative party stayed in overall control of the council.
The 2008 Colchester Borough Council election took place on 1 May 2008 to elect members of Colchester Borough Council in Essex, England. One third of the council was up for election and the Conservative party lost overall control of the council to no overall control.
The 2003 Rother District Council election took place on 1 May 2003 to elect members of Rother District Council in East Sussex, England. The whole council was up for election after boundary changes reduced the number of seats by 7. The Conservative party stayed in overall control of the council.
The 2011 Harlow District Council election took place on 5 May 2011 to elect members of Harlow District Council in Essex, England. One third of the council was up for election and the Conservative party stayed in overall control of the council.
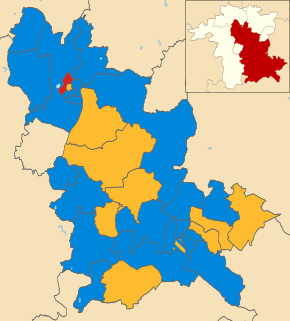
The 2003 Wychavon District Council election took place on 1 May 2003 to elect members of Wychavon District Council in Worcestershire, England. The whole council was up for election with boundary changes since the last election in 1999 reducing the number of seats by four. The Conservative party stayed in overall control of the council.
The 2011 Wychavon District Council election took place on 5 May 2011 to elect members of Wychavon District Council in Worcestershire, England. The whole council was up for election and the Conservative party stayed in overall control of the council.
The 2003 South Kesteven District Council election took place on 1 May 2003 to elect members of South Kesteven District Council in Lincolnshire, England. The whole council was up for election and the Conservative party gained control of the council from no overall control.
The 2015 Wyre Forest District Council election took place on 7 May 2015 to elect members of Wyre Forest District Council in Worcestershire, England. The whole council was up for election after boundary changes reduced the number of seats by nine. The Conservative party gained overall control of the council from no overall control.
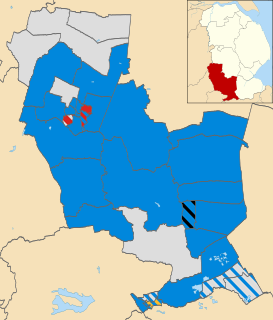
The 2011 South Kesteven District Council election took place on 5 May 2011 to elect members of South Kesteven District Council in Lincolnshire, England. The whole council was up for election and the Conservative party stayed in overall control of the council.
The 2015 Christchurch Borough Council election took place on 7 May 2015 to elect members of Christchurch Borough Council in Dorset, England. The whole council was up for election and the Conservative party stayed in overall control of the council.
The 2004 West Oxfordshire District Council election took place on 10 June 2004 to elect members of West Oxfordshire District Council in Oxfordshire, England. One third of the council was up for election and the Conservative party stayed in overall control of the council.
The 2007 West Oxfordshire District Council election took place on 3 May 2007 to elect members of West Oxfordshire District Council in Oxfordshire, England. One third of the council was up for election and the Conservative party stayed in overall control of the council.