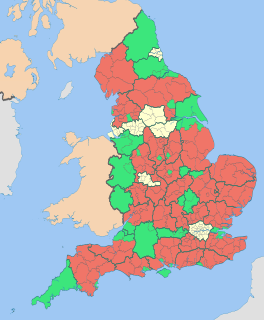
The 2018 Tandridge District Council election took place on 3 May 2018 to elect members of Tandridge District Council in Surrey, England. One third of the council was up for election and the Conservative party narrowly stayed in overall control of the council. [1]
Non-metropolitan districts, or colloquially "shire districts", are a type of local government district in England. As created, they are sub-divisions of non-metropolitan counties in a two-tier arrangement.
Surrey is a subdivision of the English region of South East England in the United Kingdom. A historic and ceremonial county, Surrey is also one of the home counties. The county borders Kent to the east, East and West Sussex to the south, Hampshire to the west, Berkshire to the northwest, and Greater London to the northeast.
England is a country that is part of the United Kingdom. It shares land borders with Wales to the west and Scotland to the north-northwest. The Irish Sea lies west of England and the Celtic Sea lies to the southwest. England is separated from continental Europe by the North Sea to the east and the English Channel to the south. The country covers five-eighths of the island of Great Britain, which lies in the North Atlantic, and includes over 100 smaller islands, such as the Isles of Scilly and the Isle of Wight.
After the election, the composition of the council was
The Conservative Party, officially the Conservative and Unionist Party, is a centre-right political party in the United Kingdom. Presently led by Theresa May, it has been the governing party since 2010. It presently has 314 Members of Parliament in the House of Commons, 249 members of the House of Lords, and 18 members of the European Parliament. It also has 31 Members of the Scottish Parliament, 12 members of the Welsh Assembly, eight members of the London Assembly and 9,008 local councillors. One of the major parties of UK politics, it has formed the government on 45 occasions, more than any other party.
The Liberal Democrats are a liberal, centrist political party in the United Kingdom. They presently have 11 Members of Parliament in the House of Commons, 96 members of the House of Lords, and one member of the European Parliament. They also have five Members of the Scottish Parliament and a member each in the Welsh Assembly and London Assembly. The party reached the height of its influence in the early 2010s, forming a junior partner in a coalition government from 2010 to 2015. It is presently led by Vince Cable.
The Conservative group lost eight seats at the election, a net loss of nine from 2014 (by-election loss to Oxted & Limpsfield Residents' Group (OLRG) in Limpsfield ward - Oct, 2016) [2] . The Liberal Democrats gained three of these seats, independents took three with OLRG taking the other three, including Limpsfield they had won in the by-election. [3] This left the Conservatives with 22 councillors, compared to 9 for the Liberal Democrats, 7 independents and 4 in the residents' group. A Conservative majority of one. [4] Overall turnout at the election was 41%. [5]
A Councillor is a member of a local government council.
Voter turnout is the percentage of eligible voters who cast a ballot in an election. Eligibility varies by country, and the voting-eligible population should not be confused with the total adult population. Age and citizenship status are often among the criteria used to determine eligibility, but some countries further restrict eligibility based on sex, race, or religion.
Party | Seats | Gains | Losses | Net gain/loss | Seats % | Votes % | Votes | +/− | |
---|---|---|---|---|---|---|---|---|---|
Conservative | 4 | 0 | 9 | -9 | 28.6 | 35.6 | 7,481 | -10.7% | |
Liberal Democrat | 4 | 3 | 0 | +3 | 28.6 | 20.1 | 4,239 | +1.9% | |
Residents | 3 | 3 | 0 | +3 | 21.4 | 17.4 | 3,655 | +17.4% | |
Independent | 3 | 3 | 0 | +3 | 21.4 | 15.0 | 3,161 | +15.0% | |
Labour | 0 | 0 | 0 | 0 | 0 | 8.7 | 1,832 | -1.2% | |
UKIP | 0 | 0 | 0 | 0 | 0 | 3.2 | 674 | -22.4% | |
An asterisk* indicates an incumbent seeking re-election.
Party | Candidate | Votes | % | ± | |
---|---|---|---|---|---|
Conservative | Tony Elias* | 775 | 49.6 | -2.1 | |
UKIP | Helena Windsor | 343 | 21.9 | -6.0 | |
Liberal Democrat | Richard Fowler | 267 | 17.1 | +6.6 | |
Labour | Linda Baharier | 178 | 11.4 | +2.4 | |
Majority | 432 | 27.7 | +3.9 | ||
Turnout | 1,563 | 35.3 | -7.0 | ||
Conservative hold | Swing | ||||
Party | Candidate | Votes | % | ± | |
---|---|---|---|---|---|
Independent | Kevin Bourne | 926 | 51.4 | +51.4 | |
Conservative | Peter Bond* | 695 | 38.5 | -12.2 | |
Labour | Fern Warwick-Ching | 119 | 6.6 | -3.6 | |
Liberal Democrat | Judy Wilkinson | 63 | 3.5 | *3.7 | |
Majority | 231 | 12.9 | -5.9 | ||
Turnout | 1,803 | 38.2 | -3.4 | ||
Independent gain from Conservative | Swing | +31.8 | |||
Party | Candidate | Votes | % | ± | |
---|---|---|---|---|---|
Independent | Nicholas White | 520 | 44.1 | +44.1 | |
Conservative | Maureen Young* | 508 | 43.1 | -13.8 | |
Liberal Democrat | Tony Hardisty | 86 | 7.3 | -9.1 | |
Labour | Ann Seuret | 64 | 5.4 | +5.4 | |
Majority | 12 | 1.0 | -29.1% | ||
Turnout | 1,178 | 38.5 | -2.5 | ||
Independent gain from Conservative | Swing | +29.0 | |||
Party | Candidate | Votes | % | ± | |
---|---|---|---|---|---|
Independent | Chris Farr | 1,305 | 65.6 | +65.6 | |
Conservative | Rose Thorn* | 423 | 21.3 | -19.6 | |
Labour | Barbara Wantling | 147 | 7.4 | -0.5 | |
Liberal Democrat | Tamzie Hollands | 115 | 5.8 | -8.5 | |
Majority | 882 | 44.3 | +40.4 | ||
Turnout | 1,990 | 44.4 | +2.1 | ||
Independent gain from Conservative | Swing | +24.1 | |||
Party | Candidate | Votes | % | ± | |
---|---|---|---|---|---|
Conservative | Beverley Connolly* | 663 | 51.4 | +0.6 | |
Liberal Democrat | Annette Evans | 461 | 35.8 | +20.1 | |
Labour | Mark Wood | 129 | 10.0 | -1.9 | |
UKIP | Martin Ferguson | 36 | 2.8 | -19.0 | |
Majority | 202 | 15.6 | -13.1 | ||
Turnout | 1,289 | 41.4 | +0.1 | ||
Conservative hold | Swing | ||||
Party | Candidate | Votes | % | ± | |
---|---|---|---|---|---|
Residents | Phil Davies | 918 | 64.3 | +64.3 | |
Conservative | Zee Lapthorne | 416 | 29.1 | -29.3 | |
Liberal Democrat | Martin Caxton | 59 | 4.1 | -10.6 | |
Labour | Alec McNally | 35 | 2.5 | -3.5 | |
Majority | 502 | 35.2 | -2.4 | ||
Turnout | 1,428 | 50.5 | +1.7 | ||
Residents gain from Conservative | Swing | +36.8 | |||
Party | Candidate | Votes | % | ± | |
---|---|---|---|---|---|
Conservative | Mark Ridge | 525 | 42.7 | -12.5 | |
Independent | Michael Sydney | 410 | 33.4 | +33.4 | |
Liberal Democrat | Dave Wilkes | 150 | 12.2 | +2.9 | |
Labour | Rebecca Pritchard | 144 | 11.7 | +1.8 | |
Majority | 115 | 9.3 | -20.3 | ||
Turnout | 1,229 | 38.3 | -1.2 | ||
Conservative hold | Swing | ||||
Party | Candidate | Votes | % | ± | |
---|---|---|---|---|---|
Residents | Catherine Sayer | 1,531 | 67.6 | +67.6 | |
Conservative | David Weightman* | 548 | 24.2 | -26.9 | |
Labour | Che Ramsden | 100 | 4.4 | -10.0 | |
Liberal Democrat | Craig Shepherd | 85 | 3.8 | -13.8 | |
Majority | 983 | 43.4 | +13.1 | ||
Turnout | 2,264 | 51.6 | +4.9 | ||
Residents gain from Conservative | Swing | +36.9 | |||
Party | Candidate | Votes | % | ± | |
---|---|---|---|---|---|
Residents | Lynn Mills | 1,206 | 57.6 | +57.6 | |
Conservative | Julie Bird | 480 | 22.9 | -16.6 | |
Labour | Katherine Saunders | 296 | 14.1 | -14.4 | |
Liberal Democrat | Jonathan Salisbury | 111 | 5.3 | -4.6 | |
Majority | 726 | 34.7 | +23.6 | ||
Turnout | 2,093 | 44.2 | +1.0 | ||
Residents gain from Conservative | Swing | +37.1 | |||
Party | Candidate | Votes | % | ± | |
---|---|---|---|---|---|
Liberal Democrat | John Orrick | 755 | 58.7 | +27.3 | |
Conservative | Rod Stead* | 415 | 32.3 | -10.2 | |
Labour | Eddington Pindura | 74 | 5.8 | -1.4 | |
UKIP | Graham Bailey | 42 | 3.3 | -15.6 | |
Majority | 340 | 26.4 | +15.3 | ||
Turnout | 1,286 | 43.9 | -1.3 | ||
Liberal Democrat gain from Conservative | Swing | +18.8 | |||
Party | Candidate | Votes | % | ± | |
---|---|---|---|---|---|
Liberal Democrat | Simon Morrow* | 833 | 49.5 | +9.8 | |
Conservative | Nathan Adams | 590 | 35.0 | +7.9 | |
UKIP | Martin Haley | 141 | 8.4 | -19.5 | |
Labour | Michael Snowden | 120 | 7.1 | +1.8 | |
Majority | 243 | 14.5 | +2.6 | ||
Turnout | 1,684 | 39.5 | -6.4 | ||
Liberal Democrat hold | Swing | ||||
Party | Candidate | Votes | % | ± | |
---|---|---|---|---|---|
Conservative | Robin Bloore | 654 | 62.2 | +10.6 | |
Liberal Democrat | Celia Caulcott | 286 | 27.2 | +6.5 | |
Labour | Patrick Rogers | 70 | 6.7 | +6.7 | |
UKIP | Christopher Dean | 42 | 4.0 | -23.7 | |
Majority | 368 | 35.0 | +11.2 | ||
Turnout | 1,052 | 38.8 | -4.8 | ||
Conservative hold | Swing | ||||
Party | Candidate | Votes | % | ± | |
---|---|---|---|---|---|
Liberal Democrat | George Dennis | 485 | 42.2 | +16.2 | |
Conservative | Eithne Webster* | 398 | 34.8 | -0.3 | |
Labour | Lucy McNally | 223 | 19.5 | +4.3 | |
UKIP | Joe Branco | 38 | 3.3 | -20.5 | |
Majority | 87 | 7.4 | +1.7 | ||
Turnout | 1,144 | 33.7 | -0.8 | ||
Liberal Democrat gain from Conservative | Swing | +8.3 | |||
Party | Candidate | Votes | % | ± | |
---|---|---|---|---|---|
Liberal Democrat | Jeffrey Gray | 483 | 46.5 | +19.3 | |
Conservative | Sakina Bradbury* | 391 | 37.6 | -5.0 | |
Labour | Fatima Kamara | 133 | 12.8 | +2.3 | |
UKIP | Grayson Clarke | 32 | 3.1 | -16.5 | |
Majority | 92 | 8.9 | -6.5 | ||
Turnout | 1,039 | 34.3 | -3.7 | ||
Liberal Democrat gain from Conservative | Swing | +12.2 | |||
The 2006 South Lakeland District Council election took place on 4 May 2006 to elect members of South Lakeland District Council in Cumbria, England. One third of the council was up for election and the Liberal Democrats gained overall control of the council from no overall control.
The 1999 Tandridge District Council election took place on 6 May 1999 to elect members of Tandridge District Council in Surrey, England. One third of the council was up for election and the council stayed under no overall control.
The 2000 Tandridge District Council election took place on 4 May 2000 to elect members of Tandridge District Council in Surrey, England. The whole council was up for election, rather than the normal election by thirds, following boundary changes since the last election in 1999. There remained 42 seats on the council: six three-member wards, ten two-member wards and four one-member wards. The Conservative party gained overall control of the council from no overall control.
The 2002 Tandridge District Council election took place on 2 May 2002 to elect members of Tandridge District Council in Surrey, England. One third of the council was up for election and the Conservative party stayed in overall control of the council.
The 2003 Tandridge District Council election took place on 1 May 2003 to elect members of Tandridge District Council in Surrey, England. One third of the council was up for election and the Conservative party stayed in overall control of the council.
The 2004 Tandridge District Council election took place on 10 June 2004 to elect members of Tandridge District Council in Surrey, England. One third of the council was up for election and the Conservative party stayed in overall control of the council.
The 2006 Tandridge District Council election took place on 4 May 2006 to elect members of Tandridge District Council in Surrey, England. One third of the council was up for election and the Conservative party stayed in overall control of the council.
The 2007 Tandridge District Council election took place on 3 May 2007 to elect members of Tandridge District Council in Surrey, England. One third of the council was up for election and the Conservative party stayed in overall control of the council.
The 2008 Tandridge District Council election took place on 1 May 2008 to elect members of Tandridge District Council in Surrey, England. One third of the council was up for election and the Conservative party stayed in overall control of the council.
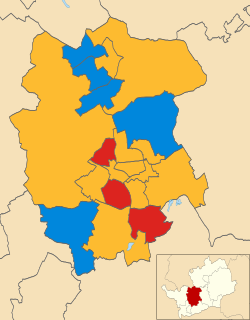
The 2003 St Albans City and District Council election took place on 1 May 2003 to elect members of St Albans District Council in Hertfordshire, England. One third of the council was up for election and the council stayed under no overall control.
The 2010 Craven District Council election took place on 6 May 2010 to elect members of Craven District Council in North Yorkshire, England. One third of the council was up for election and the Conservative party gained overall control of the council from no overall control.
The 2011 Fenland District Council election took place on 5 May 2011 to elect members of Fenland District Council in Cambridgeshire, England. The whole council was up for election and the Conservative party stayed in overall control of the council.
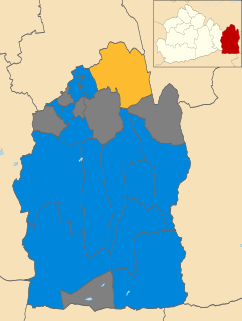
The 2010 Tandridge District Council election took place on 6 May 2010 to elect members of Tandridge District Council in Surrey, England. One third of the council was up for election and the Conservative party stayed in overall control of the council.
The 2011 Tandridge District Council election took place on 5 May 2011 to elect members of Tandridge District Council in Surrey, England. One third of the council was up for election and the Conservative party stayed in overall control of the council.
The 2007 Torridge District Council election took place on 3 May 2007 to elect members of Torridge District Council in Devon, England. The whole council was up for election and independents lost overall control of the council to no overall control.
The 2006 Brent London Borough Council election took place on 4 May 2006 to elect members of Brent London Borough Council in London, England. The whole council was up for election and the Labour party lost overall control of the council to no overall control.
The 2012 Tandridge District Council election took place on 3 May 2012 to elect members of Tandridge District Council in Surrey, England. One third of the council was up for election and the Conservative party stayed in overall control of the council.
The 2014 Tandridge District Council election took place on 22 May 2014 to elect members of Tandridge District Council in Surrey, England. One third of the council was up for election and the Conservative party stayed in overall control of the council.
The 2016 Tandridge District Council election took place on 5 May 2016 to elect members of Tandridge District Council in England. This was on the same day as other local elections.
The 2011 South Oxfordshire District Council election was held on 5 May 2011 to elect members of South Oxfordshire District Council in England. This was on the same day as other local elections.