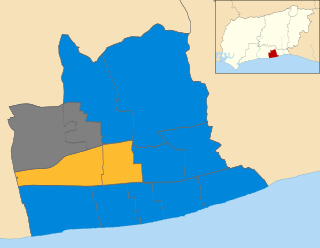
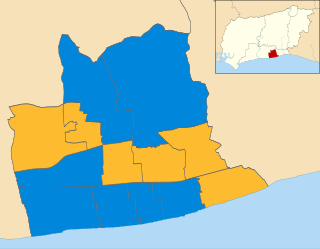
The 2004 Worthing Borough Council election took place on 10 June 2004 to elect members of Worthing Borough Council in West Sussex, England. The whole council was up for election with boundary changes since the last election 2003 increasing the number of seats by 1. [1] The Conservative party gained overall control of the council from no overall control. [2] Overall turnout was 38.23%. [3]
Worthing is a large seaside town in England, and district with borough status in West Sussex. It is situated at the foot of the South Downs, 10 miles (16 km) west of Brighton, and 18 miles (29 km) east of the county town of Chichester. With an estimated population of 104,600 and an area of 12.5 square miles (32.37 km2) the borough is the second largest component of the Brighton/Worthing/Littlehampton conurbation, which makes it part of the 15th most populous urban area in the United Kingdom. Since 2010 northern parts of the borough, including the Worthing Downland Estate, have formed part of the South Downs National Park.
West Sussex is a county in the south of England, bordering East Sussex to the east, Hampshire to the west and Surrey to the north, and to the south the English Channel.
England is a country that is part of the United Kingdom. It shares land borders with Wales to the west and Scotland to the north-northwest. The Irish Sea lies west of England and the Celtic Sea lies to the southwest. England is separated from continental Europe by the North Sea to the east and the English Channel to the south. The country covers five-eighths of the island of Great Britain, which lies in the North Atlantic, and includes over 100 smaller islands, such as the Isles of Scilly and the Isle of Wight.
The campaign saw a debate between the two main parties on the council over development in Worthing and the fate of the local swimming pool Aquarina. [4] The results saw the Conservatives make significant gains from the Liberal Democrats to take power in Worthing. [5] [6] The top Liberal Democrat to lose in the election was the leader of the council, Sheila Player, who came fourth in Selden ward and failed to be elected as a result. [5] [6] The defeat for the Liberal Democrats was put down to anger over a warning that they might have to close the local museum, art gallery and swimming pool to save money. [5]
A swimming pool, swimming bath, wading pool, or paddling pool is a structure designed to hold water to enable swimming or other leisure activities. Pools can be built into the ground or built above ground, and are also a common feature aboard ocean-liners and cruise ships. In-ground pools are most commonly constructed from materials such as concrete, natural stone, metal, plastic or fiberglass, and can be of a custom size and shape or built to a standardized size, the largest of which is the Olympic-size swimming pool.
The Liberal Democrats are a liberal, centrist political party in the United Kingdom. They presently have 11 Members of Parliament in the House of Commons, 96 members of the House of Lords, and one member of the European Parliament. They also have five Members of the Scottish Parliament and a member each in the Welsh Assembly and London Assembly. The party reached the height of its influence in the early 2010s, forming a junior partner in a coalition government from 2010 to 2015. It is presently led by Vince Cable.
A museum is an institution that cares for (conserves) a collection of artifacts and other objects of artistic, cultural, historical, or scientific importance. Many public museums make these items available for public viewing through exhibits that may be permanent or temporary. The largest museums are located in major cities throughout the world, while thousands of local museums exist in smaller cities, towns and rural areas. Museums have varying aims, ranging from serving researchers and specialists to serving the general public. The goal of serving researchers is increasingly shifting to serving the general public.
Party | Seats | Gains | Losses | Net gain/loss | Seats % | Votes % | Votes | +/− | |
---|---|---|---|---|---|---|---|---|---|
Conservative | 26 | +8 | 70.3 | 56.2 | 43,214 | +4.4% | |||
Liberal Democrat | 11 | -7 | 29.7 | 36.8 | 28,324 | -4.2% | |||
Green | 0 | 0 | 0 | 3.9 | 2,967 | -1.2% | |||
Labour | 0 | 0 | 0 | 2.2 | 1,715 | +0.1% | |||
Independent | 0 | 0 | 0 | 0.4 | 338 | +0.4% | |||
Stop! Durrington's over development | 0 | 0 | 0 | 0.3 | 216 | +0.3% | |||
Legalise Cannabis | 0 | 0 | 0 | 0.2 | 173 | +0.2% |
Party | Candidate | Votes | % | ± | |
---|---|---|---|---|---|
Liberal Democrat | Geraldine Lissenburg | 1,054 | |||
Liberal Democrat | Kevin Skepper | 913 | |||
Liberal Democrat | Donald Allen | 902 | |||
Conservative | Jennifer Cuer-Green | 824 | |||
Conservative | Ann Terry | 787 | |||
Conservative | David Lafferty | 769 | |||
Green | Benjamin Colkett | 384 | |||
Labour | John Turley | 272 | |||
Turnout | 5,905 | 33.8 |
Party | Candidate | Votes | % | ± | |
---|---|---|---|---|---|
Liberal Democrat | Claire Potter | 1,093 | |||
Liberal Democrat | Robin Rogers | 1,090 | |||
Conservative | John Rogers | 1,081 | |||
Liberal Democrat | Benjamin Bonetti | 1,078 | |||
Conservative | Gina Taylore | 1,042 | |||
Conservative | Ruth White | 1,012 | |||
Turnout | 6,396 | 37.6 |
Party | Candidate | Votes | % | ± | |
---|---|---|---|---|---|
Conservative | Martin Coppard | 797 | |||
Conservative | Clive Roberts | 762 | |||
Liberal Democrat | Mary Freeland | 753 | |||
Liberal Democrat | Maurice Tucker | 721 | |||
Conservative | Mary Lermitte | 701 | |||
Liberal Democrat | Janet Goldsbrough-Jones | 700 | |||
Green | Alice Hinton | 377 | |||
Labour | Peter Barnes | 260 | |||
Turnout | 5,071 | 33.3 |
Party | Candidate | Votes | % | ± | |
---|---|---|---|---|---|
Conservative | Richard Falk | 744 | |||
Conservative | Ann Sayers | 677 | |||
Liberal Democrat | Mark O'Keeffe | 621 | |||
Liberal Democrat | Keith Sunderland | 580 | |||
Green | John Dwyer | 295 | |||
Turnout | 2,917 | 37.6 |
Party | Candidate | Votes | % | ± | |
---|---|---|---|---|---|
Conservative | Margaret Barlow | 1,014 | |||
Conservative | Bryan Turner | 1,000 | |||
Conservative | Kenneth Brady | 983 | |||
Liberal Democrat | Peter Medcalf | 914 | |||
Liberal Democrat | Donald Lissenburg | 909 | |||
Liberal Democrat | Alan Rice | 870 | |||
Green | Marie Hillcoat | 409 | |||
Labour | Julia Young | 274 | |||
Turnout | 6,373 | 37.1 |
Party | Candidate | Votes | % | ± | |
---|---|---|---|---|---|
Conservative | Nick John | 2,138 | |||
Conservative | Fiona Green | 2,055 | |||
Conservative | Steven Waight | 2,044 | |||
Liberal Democrat | Stephen Paris | 677 | |||
Liberal Democrat | Malcolm Grace | 611 | |||
Liberal Democrat | Susan Withnell | 606 | |||
Labour | Karen Clayton | 317 | |||
Turnout | 8,448 | 47.1 |
Party | Candidate | Votes | % | ± | |
---|---|---|---|---|---|
Conservative | Paul High | 1,121 | |||
Conservative | John Livermore | 1,116 | |||
Conservative | George Stephens | 1,080 | |||
Liberal Democrat | Christine Allen | 560 | |||
Liberal Democrat | Alan Jones | 492 | |||
Green | Christopher Taylor | 393 | |||
Liberal Democrat | Christopher Ralls | 387 | |||
Labour | Niall Duffy | 302 | |||
Legalise Cannabis | Sarah Chalk | 173 | |||
Turnout | 5,624 | 35.6 |
Party | Candidate | Votes | % | ± | |
---|---|---|---|---|---|
Conservative | Joan Bradley | 1,713 | |||
Conservative | Keith Mercer | 1,640 | |||
Conservative | Tom Wye | 1,637 | |||
Liberal Democrat | Susan Millard | 586 | |||
Liberal Democrat | Patricia Izod | 499 | |||
Green | Lucielle Colkett | 488 | |||
Liberal Democrat | Brian Stephenson | 469 | |||
Labour | Barrie Slater | 290 | |||
Turnout | 7,322 | 42.6 |
Party | Candidate | Votes | % | ± | |
---|---|---|---|---|---|
Conservative | Mary Harding | 410 | |||
Conservative | Alan Whiteley | 367 | |||
Liberal Democrat | Val Capon | 288 | |||
Liberal Democrat | Merlin Jones | 247 | |||
Stop! Durrington's over development | Dawn Smith | 216 | |||
Green | Thelma Brown | 165 | |||
Turnout | 1,693 | 27.7 |
Party | Candidate | Votes | % | ± | |
---|---|---|---|---|---|
Conservative | Mark McCarthy | 1,857 | |||
Conservative | Graham Fabes | 1,837 | |||
Conservative | Reg Green | 1,828 | |||
Liberal Democrat | Paul Daniels | 674 | |||
Liberal Democrat | David Moynan | 567 | |||
Liberal Democrat | Maria Moynan | 559 | |||
Turnout | 7,322 | 43.3 |
Party | Candidate | Votes | % | ± | |
---|---|---|---|---|---|
Conservative | Jacqui Marsh | 1,656 | |||
Conservative | Noel Atkins | 1,617 | |||
Conservative | Heather Mercer | 1,517 | |||
Liberal Democrat | Iona Baker | 725 | |||
Liberal Democrat | Samantha O'Keeffe | 638 | |||
Liberal Democrat | Stephen Bates | 630 | |||
Green | Derek Colkett | 456 | |||
Turnout | 7,239 | 38.7 |
Party | Candidate | Votes | % | ± | |
---|---|---|---|---|---|
Conservative | Jack Saheid | 1,185 | |||
Liberal Democrat | James Doyle | 1,161 | |||
Liberal Democrat | Christine Brown | 1,149 | |||
Liberal Democrat | Sheila Player | 1,108 | |||
Conservative | David Turner | 1,038 | |||
Conservative | Sarah-Jane King | 1,025 | |||
Turnout | 6,666 | 40.7 |
Party | Candidate | Votes | % | ± | |
---|---|---|---|---|---|
Liberal Democrat | John Lovell | 1,247 | |||
Liberal Democrat | Hazel Thorpe | 1,169 | |||
Liberal Democrat | Bob Smytherman | 1,077 | |||
Conservative | Kate Brady | 725 | |||
Conservative | David Ide | 709 | |||
Conservative | Geoffrey Bird | 706 | |||
Independent | Ian Sandell | 338 | |||
Turnout | 5,971 | 36.1 |
The 1999 Worthing Borough Council election took place on 6 May 1999 to elect members of Worthing Borough Council in West Sussex, England. One third of the council was up for election and the Conservative party gained overall control of the council from the Liberal Democrats. Overall turnout was 34.8%.
The 2002 Worthing Borough Council election took place on 2 May 2002 to elect members of Worthing Borough Council in West Sussex, England. One third of the council was up for election and the Liberal Democrats gained overall control of the council from the Conservative party. Overall turnout was 30.67%.
The 2003 Worthing Borough Council election took place on 1 May 2003 to elect members of Worthing Borough Council in West Sussex, England. One third of the council was up for election and the Liberal Democrats lost overall control of the council to no overall control. Overall turnout was 28.61%.
The 2006 Worthing Borough Council election took place on 4 May 2006 to elect members of Worthing Borough Council in West Sussex, England. One third of the council was up for election and the Conservative party stayed in overall control of the council.
The 2007 Worthing Borough Council election took place on 3 May 2007 to elect members of Worthing Borough Council in West Sussex, England. One third of the council was up for election and the Conservative party stayed in overall control of the council.
The 2008 Worthing Borough Council election took place on 1 May 2008 to elect members of Worthing Borough Council in West Sussex, England. One third of the council was up for election and the Conservative party stayed in overall control of the council. Overall turnout was 35%.
The 2004 St Albans City and District Council election took place on 10 June 2004 to elect members of St Albans District Council in Hertfordshire, England. One third of the council was up for election and the council stayed under no overall control.
The 2004 Wakefield Metropolitan District Council election took place on 10 June 2004 to elect members of Wakefield Metropolitan District Council in West Yorkshire, England. The whole council was up for election with boundary changes since the last election in 2003. The Labour party stayed in overall control of the council.
The 2004 Woking Council election took place on 10 June 2004 to elect members of Woking Borough Council in Surrey, England. One third of the council was up for election and the council stayed under no overall control.
The 2004 Welwyn Hatfield District Council election took place on 10 June 2004 to elect members of Welwyn Hatfield District Council in Hertfordshire, England. One third of the council was up for election and the Conservative party stayed in overall control of the council.
The 2010 Cheltenham Council election took place on 6 May 2010 to elect members of Cheltenham Borough Council in Gloucestershire, England. Half of the council was up for election and the Liberal Democrats stayed in overall control of the council.
Elections to Broxtowe Borough Council were held on 5 May 2011 to elect all 44 members to the Council.
The 2010 Rushmoor Council election took place on 6 May 2010 to elect members of Rushmoor Borough Council in Hampshire, England. One third of the council was up for election and the Conservative party stayed in overall control of the council.
The 2006 Solihull Metropolitan Borough Council election took place on 4 May 2006 to elect members of Solihull Metropolitan Borough Council in the West Midlands, England. One third of the council was up for election and the Conservative party stayed in overall control of the council.
The 2004 Harrogate Council election took place on 10 June 2004 to elect members of Harrogate Borough Council in North Yorkshire, England. One third of the council was up for election and the Conservative party stayed in overall control of the council.
The 2006 Harrogate Council election took place on 4 May 2006 to elect members of Harrogate Borough Council in North Yorkshire, England. One third of the council was up for election and the Conservative party lost overall control of the council to no overall control.
The 2010 Woking Council election took place on 1 May 2010, on the same day as the 2010 general election, to elect members of Woking Borough Council in Surrey, England. One third of the council was up for election and the council stayed under no overall control.
The 2008 Maidstone Borough Council election took place on 1 May 2008 to elect members of Maidstone Borough Council in Kent, England. One third of the council was up for election and the Conservative party gained overall control of the council from no overall control.
The 2010 Maidstone Borough Council election took place on 6 May 2010 to elect members of Maidstone Borough Council in Kent, England. One third of the council was up for election and the Conservative party stayed in overall control of the council.
The 2004 Walsall Metropolitan Borough Council election took place on 10 June 2004 to elect members of Walsall Metropolitan Borough Council in the West Midlands, England. The whole council was up for election with boundary changes since the last election in 2003. The Conservative party gained overall control of the council from no overall control.