Elections to Wiltshire County Council were held on 7 June 2001. The whole council was up for election and the Conservatives held onto control. [1]
Wiltshire County Council was the county council of Wiltshire in the South West of England, an elected local Government body responsible for most local government services in the county.
The Conservative Party, officially the Conservative and Unionist Party, is a centre-right political party in the United Kingdom. The governing party since 2010, it is the largest in the House of Commons, with 313 Members of Parliament, and also has 249 members of the House of Lords, 18 members of the European Parliament, 31 Members of the Scottish Parliament, 12 members of the Welsh Assembly, eight members of the London Assembly and 8,916 local councillors.
As with other county elections in England, these local elections in Wiltshire took place on the same day as the United Kingdom general election, 2001.
Party | Seats | Gains | Losses | Net gain/loss | Seats % | Votes % | Votes | +/− | |
---|---|---|---|---|---|---|---|---|---|
Conservative | 28 | 59.57 | 43.67 | 91,827 | |||||
Liberal Democrat | 14 | 29.79 | 33.67 | 70,788 | |||||
Labour | 3 | 6.38 | 16.93 | 35,595 | |||||
Independent | 2 | 4.26 | 2.24 | 4,712 | |||||
Green | 0 | 0 | 3.49 | 7,344 |
Party | Candidate | Votes | % | ± | |
---|---|---|---|---|---|
Conservative | Christopher Paul Humphries | 2,873 | |||
Liberal Democrat | William Bernard Cavill | 1,265 | |||
Labour | Frank Jeffrey | 738 | |||
Majority | 1,608 | ||||
Party | Candidate | Votes | % | ± | |
---|---|---|---|---|---|
Conservative | William Raybould Moss | 2,577 | |||
Liberal Democrat | Malcolm Ian Adams | 1,698 | |||
Labour | Malcolm Anthony Simmons | 541 | |||
Majority | 879 | ||||
Party | Candidate | Votes | % | ± | |
---|---|---|---|---|---|
Conservative | Allan Godfrey Peach | 2,386 | |||
Liberal Democrat | June Smith | 1,009 | |||
Labour | Damian Joseph Luke McCabe | 806 | |||
Green | Peter Torquil George Matthews | 206 | |||
Majority | 1,377 | ||||
Party | Candidate | Votes | % | ± | |
---|---|---|---|---|---|
Conservative | Anthony Molland | 2,284 | |||
Liberal Democrat | John Francis Thomson | 990 | |||
Labour | Colin Robert Hopgood | 978 | |||
Green | Ronald Keith Bright | 309 | |||
Majority | |||||
Party | Candidate | Votes | % | ± | |
---|---|---|---|---|---|
Conservative | David Lay | 2,926 | |||
Liberal Democrat | David John Walker | 1,708 | |||
Labour | Alistair Bisatt | 902 | |||
Majority | 1,218 | ||||
Party | Candidate | Votes | % | ± | |
---|---|---|---|---|---|
Conservative | Kevin Christopher Wren | 2,909 | |||
Liberal Democrat | Joan Heaney | 1,271 | |||
Labour | Amanda Grace Pettefar | 774 | |||
Green | Barry James Stringer | 231 | |||
Majority | 1,638 | ||||
Party | Candidate | Votes | % | ± | |
---|---|---|---|---|---|
Liberal Democrat | Malcolm George Hewson | 2,287 | |||
Conservative | Bryan Earp | 1,763 | |||
Labour | James Tracey | 846 | |||
Green | John Pearce | 370 | |||
Majority | 524 | ||||
Party | Candidate | Votes | % | ± | |
---|---|---|---|---|---|
Conservative | Christine Crisp | 3,178 | |||
Liberal Democrat | Sylvia Kathleen Doubell | 2,170 | |||
Green | Harry Lewis | 644 | |||
Majority | 1,218 | ||||
Party | Candidate | Votes | % | ± | |
---|---|---|---|---|---|
Conservative | Nancy Suzanne Bryant | 1,820 | |||
Liberal Democrat | Joanna Heselwood | 1,144 | |||
Labour | John Peter Watkins | 1,103 | |||
Green | Derek Alan Quinn | 317 | |||
Majority | |||||
Party | Candidate | Votes | % | ± | |
---|---|---|---|---|---|
Liberal Democrat | Patrick Charles Bourne Coleman | 2,211 | |||
Conservative | Anthony Walter Smith | 1,462 | |||
Labour | Maurice George Wood | 745 | |||
Green | Maxine Burchell | 222 | |||
Majority | 436 | ||||
Party | Candidate | Votes | % | ± | |
---|---|---|---|---|---|
Liberal Democrat | Sandra Elizabeth (Sandie) Webb | 1,588 | |||
Conservative | Ian Barry Bridges | 1,167 | |||
Labour | Maureen Frances Lloyd | 1,262 | |||
Majority | 326 | ||||
Party | Candidate | Votes | % | ± | |
---|---|---|---|---|---|
Liberal Democrat | Philip George Allnatt | 2,111 | |||
Conservative | John Richard Ireland | 1,699 | |||
Labour | Brian Odran Healy | 718 | |||
Green | Sheila Veitch | 236 | |||
Majority | 219 | ||||
Party | Candidate | Votes | % | ± | |
---|---|---|---|---|---|
Conservative | Mark Connolly | 1,990 | |||
Labour | Andrew Edwards | 850 | |||
Liberal Democrat | John David Bowen-Jones | 608 | |||
Independent | Anthony Hadland Still | 346 | |||
Majority | 1,140 | ||||
Party | Candidate | Votes | % | ± | |
---|---|---|---|---|---|
Liberal Democrat | Peter Roy Davis | 1,754 | |||
Conservative | Richard Leslie Tonge | 1,502 | |||
Labour | Lucy Katharine Bray | 602 | |||
Majority | 252 | ||||
Party | Candidate | Votes | % | ± | |
---|---|---|---|---|---|
Liberal Democrat | Brian Edward Atfield | 1,978 | |||
Conservative | Anthony Charles Clements | 1,880 | |||
Labour | Frederick Albert Price | 488 | |||
Majority | 98 | ||||
Party | Candidate | Votes | % | ± | |
---|---|---|---|---|---|
Labour | Margaret Sheila Nancy Taylor | 1,729 | |||
Conservative | Charles Stuart Winchcombe | 1,322 | |||
Liberal Democrat | Katherine Jane Walling | 669 | |||
Majority | 407 | ||||
Party | Candidate | Votes | % | ± | |
---|---|---|---|---|---|
Conservative | Patricia Rugg | 2,576 | |||
Labour | Angus Raymond Taylor | 1,570 | |||
Liberal Democrat | Lionel Harry Grundy | 1,426 | |||
Majority | 1,006 | ||||
Party | Candidate | Votes | % | ± | |
---|---|---|---|---|---|
Conservative | Julian Paul Johnson | 2,922 | |||
Liberal Democrat | Robert William Steel | 1,174 | |||
Labour | Ann Oliver | 646 | |||
Green | Adam Christopher Gent | 419 | |||
Majority | |||||
Party | Candidate | Votes | % | ± | |
---|---|---|---|---|---|
Conservative | Mark Lawrence Baker | 1,540 | |||
Liberal Democrat | Judith Mary Greville | 1,494 | |||
Labour | Tamsen Angela Jacobs | 663 | |||
Majority | 46 | ||||
Party | Candidate | Votes | % | ± | |
---|---|---|---|---|---|
Liberal Democrat | Terrence Peter (Terry) Chivers | 2,396 | |||
Conservative | Christopher March | 2,038 | |||
Labour | Gregory Coombes | 724 | |||
Green | Sonja Nicolson | 305 | |||
Majority | 358 | ||||
Party | Candidate | Votes | % | ± | |
---|---|---|---|---|---|
Conservative | Jane Antoinette Scott | 3,470 | |||
Liberal Democrat | Andrew Charles Gerard Noblet | 2,122 | |||
Labour | Susan Marian Ford | 851 | |||
Majority | 1,348 | ||||
Party | Candidate | Votes | % | ± | |
---|---|---|---|---|---|
Conservative | Dennis James Willmott | 2,492 | |||
Liberal Democrat | James Richard Grenville Spencer | 1,242 | |||
Labour | William Mark Barnett | 1,123 | |||
Majority | 1,250 | ||||
Party | Candidate | Votes | % | ± | |
---|---|---|---|---|---|
Conservative | John Percy Simon Stuart Thomson | 2,347 | |||
Liberal Democrat | Lesley Clare Stockman Bennett | 2,192 | |||
Labour | Daphne Joy Jones | 737 | |||
Majority | 155 | ||||
Party | Candidate | Votes | % | ± | |
---|---|---|---|---|---|
Liberal Democrat | Margaret Boulton | 1,632 | |||
Conservative | Leonard Henry Bulley | 1,584 | |||
Labour | Brian Andrew Lawrence McClintock | 656 | |||
Majority | 48 | ||||
Party | Candidate | Votes | % | ± | |
---|---|---|---|---|---|
Liberal Democrat | Angela Betty Barker | 1,177 | |||
Labour | Margaret White | 949 | |||
Conservative | Jackie Spiers | 645 | |||
Green | Hilary Millichamp | 123 | |||
Majority | 228 | ||||
Party | Candidate | Votes | % | ± | |
---|---|---|---|---|---|
Conservative | William Arthur Spiers | 2,165 | |||
Liberal Democrat | Nicholas Westbrook | 1,774 | |||
Labour | Geoffrey Mitcham | 1,669 | |||
Green | Laura Pictor | 220 | |||
Majority | 391 | ||||
Party | Candidate | Votes | % | ± | |
---|---|---|---|---|---|
Conservative | Colin Read | 2,156 | |||
Liberal Democrat | Mark Houghton-Brown | 1,136 | |||
Labour | Michael Foote | 571 | |||
Majority | 1,020 | ||||
Party | Candidate | Votes | % | ± | |
---|---|---|---|---|---|
Conservative | Carole Alethea Soden | 3,378 | |||
Liberal Democrat | Ann Lorraine Davis | 1,641 | |||
Labour | Brian John Bayton | 447 | |||
Majority | 1,737 | ||||
Party | Candidate | Votes | % | ± | |
---|---|---|---|---|---|
Conservative | Judith Helen Seager | 1,770 | |||
Liberal Democrat | David Keith Poole | 1,534 | |||
Labour | Christopher John Lynch | 1,034 | |||
Majority | 236 | ||||
Party | Candidate | Votes | % | ± | |
---|---|---|---|---|---|
Labour | David John McCarthy | 1,483 | |||
Conservative | Frances Mary Patricia Howard | 927 | |||
Liberal Democrat | Colin Harry Duller | 686 | |||
Majority | |||||
Party | Candidate | Votes | % | ± | |
---|---|---|---|---|---|
Conservative | William Anthony Beotric Snow | 1,774 | |||
Liberal Democrat | Brian Edward Dalton | 1,417 | |||
Labour | Rosalynne Weston | 496 | |||
Green | Sarah Margaret Green | 157 | |||
Majority | |||||
Party | Candidate | Votes | % | ± | |
---|---|---|---|---|---|
Conservative | Peter Frederick Chalke | 2,111 | |||
Liberal Democrat | Susan Margaret Thorpe | 968 | |||
Labour | Clive Robert Vincent | 647 | |||
Green | Albert John Hansford | 193 | |||
Majority | 1,143 | ||||
Party | Candidate | Votes | % | ± | |
---|---|---|---|---|---|
Liberal Democrat | Paul William Leslie Sample | 2,386 | |||
Conservative | Timothy John Stroud | 1,237 | |||
Labour | Simon John Howarth | 572 | |||
Green | Susan Isabel Wright | 182 | |||
Majority | 1,149 | ||||
Party | Candidate | Votes | % | ± | |
---|---|---|---|---|---|
Labour | Beryl Mary Jay | 1,919 | |||
Conservative | Terence John Lindley | 967 | |||
Liberal Democrat | John Patrick Abbott | 700 | |||
Green | Mark Pafford | 136 | |||
Majority | 952 | ||||
Party | Candidate | Votes | % | ± | |
---|---|---|---|---|---|
Conservative | Bill Braid | 1,043 | |||
Independent | Tony Phillips | 1,001 | |||
Labour | Peter Ezra | 620 | |||
Independent | John Irving | 562 | |||
Green | Kevan James Cocoran | 367 | |||
Majority | 42 | ||||
Party | Candidate | Votes | % | ± | |
---|---|---|---|---|---|
Conservative | Richard Martin Willan | 2,440 | |||
Liberal Democrat | Elizabeth Amanda Chettleburgh | 1,298 | |||
Labour | Paul Whiteside | 589 | |||
Majority | 1,142 | ||||
Party | Candidate | Votes | % | ± | |
---|---|---|---|---|---|
Conservative | Anthony Ivan Moore | 1,440 | |||
Liberal Democrat | Tom Raymond James | 1,378 | |||
Labour | Angela Womersley | 1,044 | |||
Green | Bob Gledhill | 401 | |||
Majority | 62 | ||||
Party | Candidate | Votes | % | ± | |
---|---|---|---|---|---|
Liberal Democrat | Grace Hill | 2,798 | |||
Conservative | Andrew Powell | 1,260 | |||
Green | Nigel Pratt | 532 | |||
Majority | 1,538 | ||||
Party | Candidate | Votes | % | ± | |
---|---|---|---|---|---|
Liberal Democrat | Jeffrey Bryan Osborn | 1,651 | |||
Conservative | Aubrey Harold Thomas Austin | 856 | |||
Green | David Entwistle | 340 | |||
Majority | 795 | ||||
Party | Candidate | Votes | % | ± | |
---|---|---|---|---|---|
Conservative | Mary Fleur de Rhé-Philipe | 2,231 | |||
Liberal Democrat | Richard John Crofts | 1,057 | |||
Green | Kathryn Toyne | 313 | |||
Majority | 1,174 | ||||
Party | Candidate | Votes | % | ± | |
---|---|---|---|---|---|
Conservative | Dorothea Joan Main | 1,699 | |||
Liberal Democrat | Giacinto Giovanni (John) Barberio | 1,196 | |||
Green | Jonathan William Daniels | 268 | |||
Majority | 503 | ||||
Party | Candidate | Votes | % | ± | |
---|---|---|---|---|---|
Independent | John Syme | 1,639 | |||
Conservative | Martin Baker | 1,307 | |||
Liberal Democrat | Edward Raymond Beaty | 1,013 | |||
Green | David John Howell | 217 | |||
Majority | 332 | ||||
Party | Candidate | Votes | % | ± | |
---|---|---|---|---|---|
Independent | Christopher Newbury | 1,580 | |||
Conservative | John Clegg | 1,306 | |||
Liberal Democrat | Horace John Prickett | 1,086 | |||
Labour | Michael Sutton | 785 | |||
Green | James Toyne | 129 | |||
Majority | 274 | ||||
Party | Candidate | Votes | % | ± | |
---|---|---|---|---|---|
Liberal Democrat | Trevor William Carbin | 2,526 | |||
Conservative | Joan Savage | 2,202 | |||
Green | Susan Nowell-Kelley | 350 | |||
Majority | 324 | ||||
Party | Candidate | Votes | % | ± | |
---|---|---|---|---|---|
Liberal Democrat | Ian Clive West | 2,214 | |||
Conservative | Anthony Julian Brown-Hovelt | 1,969 | |||
Labour | Clare Miranda Moody | 512 | |||
Green | Hamish Douglas Soutar | 157 | |||
Independent | Timothy Ingle Abbott | 146 | |||
Majority | 245 | ||||
Party | Candidate | Votes | % | ± | |
---|---|---|---|---|---|
Conservative | Mollie Eileen May Groom | 1,692 | |||
Liberal Democrat | Jennifer Anne Stratton | 1,214 | |||
Labour | Valerie Irene Price | 573 | |||
Majority | 478 | ||||
Party | Candidate | Votes | % | ± | |
---|---|---|---|---|---|
Conservative | Toby Russell Sturgis | 2,545 | |||
Liberal Democrat | Daphne Joyce Matthews | 1,799 | |||
Labour | Ellis Webb | 971 | |||
Majority | 746 | ||||
West Wiltshire was a local government district in Wiltshire, England, formed on 1 April 1974, further to the Local Government Act 1972, as a merger of the former urban districts of Bradford-on-Avon, Melksham, Trowbridge, Warminster and Westbury, along with Bradford and Melksham Rural District and the Warminster and Westbury Rural District.
Westbury was a parliamentary constituency in Wiltshire from 1449 to 2010. It was represented in the House of Commons of England until 1707, and then in the House of Commons of Great Britain from 1707 to 1800, and finally in the House of Commons of the Parliament of the United Kingdom from 1801 until 2010.
Wiltshire is a historic county located in the South West England region. Wiltshire is landlocked and is in the east of the region.
The Wessex Main Line is the railway line from Bristol Temple Meads to Southampton Central. Diverging from this route is the Heart of Wessex Line from Westbury to Weymouth. The Wessex Main Line intersects the Reading to Taunton Line at Westbury and the West of England Main Line at Salisbury.
North Wiltshire is a constituency represented in the House of Commons of the UK Parliament since 1997 by James Gray, a Conservative. In the period 1832–1983, this was an alternative name for Chippenham or the Northern Division of Wiltshire and as Chippenham dates to the original countrywide Parliament, the Model Parliament, this period is covered in more detail in that article. In 2016 it was announced that the North Wiltshire constituency would be scrapped as part of the planned 2018 Constituency Reforms.
Chippenham is a parliamentary constituency, abolished in 1983 but recreated in 2010, and represented in the House of Commons of the Parliament of the United Kingdom. It elects one Member of Parliament by the first past the post system of election. The 2010 constituency includes the towns of Bradford on Avon, Chippenham, Corsham and Melksham.
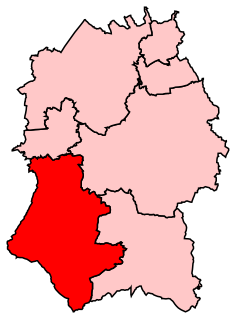
South West Wiltshire is a constituency represented in the House of Commons of the UK Parliament by Andrew Murrison, a Conservative, since its creation in 2010.
The Wiltshire Football League is a football league based in England. It was initially set up to consist of no more than 56 clubs. All clubs are affiliated to an affiliated County Football Association. The area covered by the competition is within the county of Wiltshire or within 15 miles of the Wiltshire county boundary. The league sits at Step 7 of England's National League System pyramid, and since season 2014–15 has operated just one senior division.
Elections to Wiltshire County Council were held on 1 May 1997. The whole council was up for election and the result was no overall control, with the Conservatives as the largest party.
Dorset & Wilts 3 North is an English Rugby Union league, forming part of the South West Division, for clubs primarily based in Wiltshire, sitting at tier 10 of the English rugby union system. Promoted teams tend to move up to Dorset & Wilts 2 North. Previously relegated teams dropped to Dorset & Wilts 4 but since the cancellation of this division at the end of the 2015-16 season there has been no relegation.
Dorset & Wilts 2 North is an English Rugby Union league, forming part of the South West Division, for clubs based primarily in Wiltshire, sitting at tier 9 of the English rugby union system. From this league teams can either be promoted to Dorset & Wilts 1 North or relegated to Dorset & Wilts 3 North. Each year 1st XV clubs in this division also take part in the RFU Junior Vase - a level 9-12 national competition.
Dorset & Wilts 1 North is an English rugby union league, forming part of the South West Division, for clubs primarily based in Wiltshire, sitting at tier 8 of the English rugby union system. Originally consisting of one league, Dorset & Wilts 1 split into north and south regional divisions in 2004. It had even had teams based in Berkshire participating until 2001, at which time they left to join the Buckinghamshire & Oxon leagues.