Wiltshire Council election, 2017

Last updated
Results by electoral division. Key:
Conservative
Liberal Democrat
Labour
Independent Wiltshire UK local election 2017 map.svg
Results by electoral division. Key:
  Conservative
  Liberal Democrat
  Labour
  Independent

The 2017 Wiltshire Council election took place on 4 May 2017 as part of the 2017 local elections in the United Kingdom. [1] All 98 councillors were elected from electoral divisions which returned one councillor each by first-past-the-post voting for a four-year term of office.

Wiltshire Council British administrative body

Wiltshire Council is a council for the unitary authority of Wiltshire in South West England, created in 2009. It is the successor authority to Wiltshire County Council (1889–2009) and the four district councils of Kennet, North Wiltshire, Salisbury, and West Wiltshire, all of which were created in 1974 and abolished in 2009.

The wards and electoral divisions in the United Kingdom are electoral districts at sub-national level represented by one or more councillors. The ward is the primary unit of English electoral geography for civil parishes and borough and district councils, electoral ward is the unit used by Welsh principal councils, while the electoral division is the unit used by English county councils and some unitary authorities. Each ward/division has an average electorate of about 5,500 people, but ward-population counts can vary substantially. As at the end of 2014 there were 9,456 electoral wards/divisions in the UK.

Contents

Uncontested election

At the close of nominations on 4 April 2017, there was one electoral division in which only one candidate had come forward: John Smale (Conservative), in Bulford, Allington and Figheldean. He was thus elected unopposed.

Results summary

Wiltshire Council election, 2017 [2]
PartySeatsGainsLossesNet gain/lossSeats %Votes %Votes+/−
  Conservative 68122+1055.574,289
  Liberal Democrat 2039-628.638,217
  Labour 301-19.712,971
  Independent 713-23.24,314
  Green 00002.43,250
  UKIP 001-10.6803


    Aldbourne and Ramsbury


    Aldbourne and Ramsbury
    PartyCandidateVotes%±
    Conservative James Sheppard1,05667.4+3.5
    Liberal Democrat Fran Bishop53817.8n/a
    Labour Jason Steven Haythornwaite1479.4n/a
    Green Brian Roy Utton1475.4n/a
    Majority77849.6
    Turnout 1,56838.8+1.5
    Conservative hold Swing

    Alderbury and Whiteparish


    Alderbury and Whiteparish
    PartyCandidateVotes%±
    Conservative Richard Britton82559.4+2.8
    Independent Gideon Bruce Aymes34224.6n/a
    Liberal Democrat John Phillip Edrich1188.5n/a
    Labour Kim Eleanor Glennon-Alty1057.6-3.7
    Majority48334.6
    Turnout 1,39441.0+5.0
    Conservative hold Swing

    Amesbury East


    Amesbury East
    PartyCandidateVotes%±
    Conservative Robert Alexander Yuill66948.2+22.9
    Liberal Democrat Helen Martina Holdsworth43431.3+5.6
    UKIP Rhod Evans1188.5-7.0
    Labour Julie Anne Martingale846.1-3.4
    Majority23516.9
    Turnout 1,38929.7
    Conservative gain from Liberal Democrat Swing

    Amesbury West


    Amesbury West
    PartyCandidateVotes%±
    Conservative Fred Westmoreland87474.2+37.2
    Labour Tom Corbin16814.3+3.0
    Liberal Democrat Gerard Francis Wynn13611.5n/a
    Majority70659.0
    Turnout 1,19632.3+0.2
    Conservative hold Swing

    Bourne and Woodford Valley


    Bourne and Woodford Valley
    PartyCandidateVotes%±
    Conservative Mike Hewitt98365.5-6.4
    Liberal Democrat Dineen Marianne Hopper36424.2n/a
    Labour Lindsey Elizabeth Bellringer15510.3-17.8
    Majority61941.0
    Turnout 1,50943.7+8.7
    Conservative hold Swing

    Box and Colerne


    Box and Colerne
    PartyCandidateVotes%±
    Liberal Democrat Brian George Felton Matthew97952.4+15.2
    Conservative Sheila Gladys Parker81843.8+0.8
    Labour Peter Neil Baldrey703.8-5.2
    Majority1618.6
    Turnout 1,86749.2+8.1
    Liberal Democrat gain from Conservative Swing

    Bradford-on-Avon North


    Bradford-on-Avon North
    PartyCandidateVotes%±
    Liberal Democrat Jim Lynch1,26259.8+13.1
    Conservative Pam Hyde81840.3+20.1
    Majority41218.9
    Turnout 2,14556.5+14.9
    Liberal Democrat hold Swing

    Bradford-on-Avon South


    Bradford-on-Avon South
    PartyCandidateVotes%±
    Liberal Democrat Sarah Gibson1,19755.8+7.3
    Conservative Clive Alfred Samuel Hilton72433.8+11.4
    Labour Rosie Macgregor22410.4-3.4
    Majority47321.9
    Turnout 2,15752.8+8.9
    Liberal Democrat hold Swing

    Brinkworth


    Brinkworth
    PartyCandidateVotes%±
    Conservative Toby Russell Sturgis1,08365.4+6.2
    Liberal Democrat Christopher Hugh Tuite57234.6+20.3
    Majority51130.7
    Turnout 1,66745.2+7.3
    Conservative hold Swing

    Bromham, Rowde and Potterne


    Bromham, Rowde and Potterne
    PartyCandidateVotes%±
    Conservative Anna Louise Cuthbert82359.3+2.6
    Independent Philip Alfred Brown24217.4n/a
    Liberal Democrat Ralph Andre Frederick Elia1389.9-3.9
    Labour Dianne Mary Gilpin1067.6-3.9
    Green Margaret Ursula Green795.7n/a
    Majority58141.7
    Turnout 1,39436.1-38.4
    Conservative hold Swing

    Bulford, Allington and Figheldean

    Bulford, Allington and Figheldean
    PartyCandidateVotes%±
    Conservative John Frederick SmaleUnopposedn/an/a
    Majorityn/a
    Turnout n/a
    Conservative hold Swing

    Burbage and The Bedwyns


    Burbage and The Bedwyns
    PartyCandidateVotes%±
    Conservative Stuart John Kennedy Wheeler1,02168.0-14.6
    Liberal Democrat Parvis Jamieson21614.4n/a
    Labour John Brian Thornton1348.9-8.5
    Green Emma Jane Clarissa Dawnay1308.7n/a
    Majority80553.5
    Turnout 1,50438.8+7.2
    Conservative hold Swing

    By Brook

    By Brook
    PartyCandidateVotes%±
    Conservative Jane Scott 1,03271.5+5.5
    Liberal Democrat Mary Geraldine Sheila Finch22315.5+2.8
    Green Phillip Christopher Chamberlain1006.9n/a
    Labour Stephen Charles Wheeler886.1n/a
    Majority80955.9
    Turnout 1,44640.3+4.7
    Conservative hold Swing

    Calne Central

    Calne Central
    PartyCandidateVotes%±
    Liberal Democrat Ian Leslie Thorn75451.6+13.5
    Conservative Howard Robin Marshall56238.5+2.1
    Labour John Boaler1449.9n/a
    Majority19213.1
    Turnout 1,46242.6+9.5
    Liberal Democrat hold Swing

    Calne Chilvester and Abberd

    Calne Chilvester and Abberd
    PartyCandidateVotes%±
    Conservative Tony Trotman68350.4+3.9
    Liberal Democrat Robert Matthew Merrick41730.8+6.2
    Labour Mike MacGregor-Fairlie25418.8n/a
    Majority26619.6
    Turnout 1,35634.4+7.6
    Conservative hold Swing

    Calne North

    Calne North
    PartyCandidateVotes%±
    Conservative Tom Rounds45945.4+11.1
    Liberal Democrat Glenis Jean Ansell38037.6-2.4
    Labour Jon Fisher17217.0n/a
    Majority797.8
    Turnout 1,01430.8+6.4
    Conservative gain from Liberal Democrat Swing

    Calne Rural

    Calne Rural
    PartyCandidateVotes%±
    Conservative Christine Crisp1,09268.2+21.0
    Liberal Democrat Rob Clarke35622.2+13.2
    Labour Tom Morris1549.6n/a
    Majority73645.8
    Turnout 1,60745.5+4.7
    Conservative hold Swing

    Calne South and Cherhill

    Calne South and Cherhill
    PartyCandidateVotes%±
    Conservative Alan Kenneth Hill89265.1+18.5
    Liberal Democrat Declan Alexander William Boore31222.8-5.4
    Labour John Alan Bennett16712.2n/a
    Majority58045.8
    Turnout 1,38036.6+0.4
    Conservative hold Swing

    Chippenham Cepen Park and Derriads

    Chippenham Cepen Park and Derriads
    PartyCandidateVotes%±
    Conservative Peter John Hutton90168.0+22.3
    Liberal Democrat Christopher Leonard Norris27020.4+11.1
    Labour Ian Shaun Flower15511.7-3.2
    Majority63147.3
    Turnout 1,33339.7+6.3
    Conservative hold Swing

    Chippenham Cepen Park and Redlands

    Chippenham Cepen Park and Redlands
    PartyCandidateVotes%±
    Conservative Andy Phillips70063.4+13.4
    Liberal Democrat Conor Melvin26824.3+14.4
    Labour Jeremy Richard Griffin Comerford13712.4-4.8
    Majority43239.1
    Turnout 1,10631.4+2.3
    Conservative hold Swing

    Chippenham Hardenhuish

    Chippenham Hardenhuish
    PartyCandidateVotes%±
    Conservative Melody Rhonda Thompson66946.7-0.7
    Liberal Democrat Daniel Andrew Webb63444.3+8.8
    Labour David Charles Barter1288.9n/a
    Majority352.4
    Turnout 1,44041.5-32.8
    Conservative hold Swing

    Chippenham Hardens and England

    Chippenham Hardens and England
    PartyCandidateVotes%±
    Liberal Democrat Bill Douglas66254.9+17.3
    Conservative Robert John Bradfield Giles54345.1+22.5
    Majority1199.7
    Turnout 1,22337.1+6.2
    Liberal Democrat hold Swing

    Chippenham Lowden and Rowden

    Chippenham Lowden and Rowden
    PartyCandidateVotes%±
    Liberal Democrat Ross Henning53940.1+7.9
    Independent David Keith Poole40630.2n/a
    Conservative Paul Duncan Newman40029.7+9.5
    Majority1339.8
    Turnout 1,35337.0+6.7
    Liberal Democrat hold Swing

    Chippenham Monkton

    Chippenham Monkton
    PartyCandidateVotes%±
    Independent Nick Murry98362.4n/a
    Conservative Caroline Veronica Ramsey30019.0+6.7
    Liberal Democrat Matt Harding29318.6-51.7
    Majority68343.1
    Turnout 1,58552.2+5.8
    Independent gain from Liberal Democrat Swing

    Chippenham Pewsham

    Chippenham Pewsham
    PartyCandidateVotes%±
    Liberal Democrat Clare Morforwyn Cape74051.5+3.6
    Conservative Teresa Marie Hutton69648.5+23.9
    Majority443.0
    Turnout 1,44842.0+10.6
    Liberal Democrat hold Swing

    Chippenham Queens and Sheldon

    Chippenham Queens and Sheldon
    PartyCandidateVotes%±
    Conservative Ashley O'Neill81760.4+27.9
    Liberal Democrat Desna Barbara Allen53639.6+4.4
    Majority28120.7
    Turnout 1,35741.3+4.0
    Conservative gain from Liberal Democrat Swing

    Corsham Pickwick

    Corsham Pickwick
    PartyCandidateVotes%±
    Liberal Democrat Ruth Mary Catherine Hopkinson75350.3+36.7
    Conservative Alan MacRae60140.2+4.4
    Labour William Stephen Gilbert1429.5-12.4
    Majority15210.1
    Turnout 1,50039.8+8.8
    Liberal Democrat gain from Conservative Swing

    Corsham Town

    Corsham Town
    PartyCandidateVotes%±
    Conservative Philip Hardman Whalley98052.5+12.8
    Liberal Democrat Kelly Ann Duckhouse74640.0+6.5
    Labour Steve Abbott1417.6+0.3
    Majority23412.5
    Turnout 1,86849.0+5.7
    Conservative hold Swing

    Corsham Without and Box Hill

    Corsham Without and Box Hill
    PartyCandidateVotes%±
    Conservative Ben Anderson1,16869.4+12.8
    Green Tina Maria Johnston51430.6n/a
    Majority65438.6
    Turnout 1,69341.3+3.0
    Conservative hold Swing

    Cricklade and Latton

    Cricklade and Latton
    PartyCandidateVotes%±
    Liberal Democrat Bob Jones92348.8-7.8
    Conservative Peter Anthony Colmer88346.7+3.3
    Labour Graham William Davies854.5n/a
    Majority402.1
    Turnout 1,89448.7+7.1
    Liberal Democrat hold Swing

    Devizes and Roundway South

    Devizes and Roundway South
    PartyCandidateVotes%±
    Conservative Simon David Jacobs61340.2+6.0
    Devizes Guardians Chris Greenwood29419.3-10.7
    Independent Chris Callow17711.6n/a
    Independent Ian Richard Porter Hopkins16811.0-5.6
    Labour Ivor Llewellyn Blackmore1469.6-3.6
    Liberal Democrat James Thomas Melville Kay1288.4+2.4
    Majority31920.8
    Turnout 1,53244.4+3.7
    Conservative hold Swing

    Devizes East

    Devizes East
    PartyCandidateVotes%±
    Conservative Peter Evans48342.8-2.0
    Devizes Guardians Jane Mary Burton27624.5-7.8
    Liberal Democrat Alan Charles Rankin19217.0n/a
    Labour Laura Kate Naylor17715.7-7.2
    Majority20718.2
    Turnout 1,13536.7+5.5
    Conservative hold Swing

    Devizes North

    Devizes North
    PartyCandidateVotes%±
    Conservative Sue Evans57946.8+4.9
    Devizes Guardians Nigel Denys Carter 33527.1-9.4
    Green Simon Charles Thompson17113.8n/a
    Labour Patricia Baxter15312.4-9.2
    Majority24419.6
    Turnout 1,24538.7+5.5
    Conservative hold Swing

    Downton and Ebble Valley

    Downton and Ebble Valley
    PartyCandidateVotes%±
    Conservative Richard John Clewer94464.7+2.6
    Green Robert William Steel20814.3n/a
    Labour Ben Wynn18812.9n/a
    Liberal Democrat Harry David Ashcroft1208.2n/a
    Majority73650.3
    Turnout 1,46439.0+0.6
    Conservative hold Swing

    Durrington and Larkhill

    Durrington and Larkhill
    PartyCandidateVotes%±
    Independent Graham Wright1,38480.1+1.7
    Conservative Jan Burns34520.0-1.6
    Majority1,03959.8
    Turnout 1,73834.9+5.3
    Independent hold Swing

    Ethandune

    Ethandune
    PartyCandidateVotes%±
    Conservative Jerry Wickham1,05971.8+36.2
    Liberal Democrat Anne Elizabeth Ball41628.2+0.6
    Majority64343.1
    Turnout 1,49241.3+4.0
    Conservative hold Swing

    Fovant and Chalke Valley

    Fovant and Chalke Valley
    PartyCandidateVotes%±
    Conservative Jose Green97165.0n/a
    Independent William Donald Keir Holmes33922.7n/a
    Liberal Democrat Oliver Arthur Broomfield Holdsworth18512.4n/a
    Majority63242.1
    Turnout 1,50144.1n/a
    Conservative hold Swing

    Hilperton

    Hilperton
    PartyCandidateVotes%±
    Independent Ernie Clark1,34279.7-7.7
    Conservative Charles Russ20812.3+4.5
    Liberal Democrat George Stanton1358.0n/a
    Majority1,13467.0
    Turnout 1,69243.3+2.5
    Independent hold Swing

    Holt and Staverton

    Holt and Staverton
    PartyCandidateVotes%±
    Liberal Democrat Trevor William Carbin94164.3+18.9
    Conservative Richard William Nathaniel Warren52235.7+5.7
    Majority41928.6
    Turnout 1,46642.0+8.4
    Liberal Democrat hold Swing

    Kington

    Kington
    PartyCandidateVotes%±
    Conservative Howard Greenman1,25769.2+6.0
    Liberal Democrat Matthew John Bragg38020.9+4.5
    Labour Liam Nicholas John Stokes1799.9n/a
    Majority87748.3
    Turnout 1,81745.4+4.5
    Conservative hold Swing

    Laverstock, Ford and Old Sarum

    Laverstock, Ford and Old Sarum
    PartyCandidateVotes%±
    Labour Ian David McLennan1,05063.4-11.1
    Conservative Mark Jonathan Lamdin McClelland60736.6+11.1
    Majority44326.7
    Turnout 1,66041.7+9.3
    Labour hold Swing

    Ludgershall and Perham Down

    Ludgershall and Perham Down
    PartyCandidateVotes%±
    Conservative Chris Williams67969.9n/a
    Liberal Democrat Charles Edward Lambert10010.3n/a
    UKIP Leslie Alexander Webster9810.1n/a
    Green Teresa Mary Thornton949.7n/a
    Majority57969.6
    Turnout 97626.7n/a
    Conservative hold Swing

    Lyneham

    Lyneham
    PartyCandidateVotes%±
    Conservative Allison Mary Bucknell93877.0+18.0
    Liberal Democrat Trudie Ann Clarkson21717.8+5.0
    Labour Terry Couchman645.3n/a
    Majority72159.0
    Turnout 1,22338.7+5.3
    Conservative hold Swing

    Malmesbury

    Malmesbury
    PartyCandidateVotes%±
    Liberal Democrat Gavin Grant 94653.9+5.7
    Conservative Frances Sheppard69939.8+11.6
    Labour Fred Price1106.3-1.7
    Majority24714.0
    Turnout 1,76143.1+3.3
    Liberal Democrat hold Swing

    Marlborough East

    Marlborough East
    PartyCandidateVotes%±
    Conservative Stewart Raymond Dobson73360.5+28.4
    Liberal Democrat John Alexander Kirk Wilson27422.6+10.9
    Labour Katherine Grace Davis20516.9+8.6
    Majority45937.7
    Turnout 1,21737.1+3.6
    Conservative hold Swing

    Marlborough West

    Marlborough West
    PartyCandidateVotes%±
    Independent Nick Fogg75454.6-0.9
    Conservative Tamara Louise Reay50736.7-1.9
    Labour Sylvia Christine Card1218.8+2.9
    Majority24717.8
    Turnout 1,38646.6+6.6
    Independent hold Swing

    Melksham Central

    Melksham Central
    PartyCandidateVotes%±
    Liberal Democrat Hayley Jayne Spencer48137.9+8.2
    Conservative Mike Swanton37929.8+6.2
    UKIP David Martin Pollitt15212.0-21.5
    Independent Martin Willard Pain15011.8n/a
    Labour Paul Grainger1088.5-4.7
    Majority1027.9
    Turnout 1,28433.7+4.0
    Liberal Democrat gain from UKIP Swing

    Melksham North

    Melksham North
    PartyCandidateVotes%±
    Liberal Democrat Pat Aves59045.5+13.7
    Conservative Nick Holder51940.0+11.0
    Independent Geoff Mitcham1048.0n/a
    Independent Richard George Wiltshire856.6n/a
    Majority715.4
    Turnout 1,31136.3+3.3
    Liberal Democrat hold Swing

    Melksham South

    Melksham South
    PartyCandidateVotes%±
    Liberal Democrat Jon Hubbard1,04568.4+17.6
    Conservative Mike Sankey48431.7+16.8
    Majority56136.3
    Turnout 1,54438.6+1.6
    Liberal Democrat hold Swing

    Melksham Without North

    Melksham Without North
    PartyCandidateVotes%±
    Conservative Phil Alford1,01954.9+28.4
    Independent Terry Chivers83845.1+4.2
    Majority1819.7
    Turnout 1,87143.3+0.9
    Conservative gain from Independent Swing

    Melksham Without South

    Melksham Without South
    PartyCandidateVotes%±
    Conservative Roy Sidney While70955.3+14.4
    Liberal Democrat Ryan James Clarke23218.1+5.9
    UKIP Paul Robert Carter17813.9-24.5
    Independent Steve Petty16312.7-n/a
    Majority47737.0
    Turnout 1,28932.0+2.4
    Conservative hold Swing

    Mere

    Mere
    PartyCandidateVotes%±
    Independent George Edwin Jeans1,33966.9-9.3
    Conservative Mike Liddicoat39919.9+4.1
    Labour John Anthony Jordan26413.2n/a
    Majority94046.8
    Turnout 2,01057.9
    Independent hold Swing

    Minety

    Minety
    PartyCandidateVotes%±
    Conservative Chuck Berry1,13774.3+21.7
    Liberal Democrat Nicola Helen Middleton29419.2+9.5
    Labour Hilary Ann Foord996.5-1.2
    Majority84354.9
    Turnout 1,53540.1-2.6
    Conservative hold Swing

    Nadder and East Knoyle

    Nadder and East Knoyle
    PartyCandidateVotes%±
    Conservative Bridget Anne Wayman96466.9+4.4
    Liberal Democrat Jill Caudle47833.2n/a
    Majority48633.6
    Turnout 1,44741.5+2.4
    Conservative hold Swing

    Pewsey

    Pewsey
    PartyCandidateVotes%±
    Conservative Jeremy James Kunkler1,08572.1-2.0
    Liberal Democrat David Roland Leighton24916.6n/a
    Labour Hannah Sarah White-Overton17011.3-14.6
    Majority83655.2
    Turnout 1,51439.4+4.6
    Conservative hold Swing

    Pewsey Vale

    Pewsey Vale
    PartyCandidateVotes%±
    Conservative Paul Oatway1,06477.3+12.9
    Liberal Democrat Fiona Clare Hornby17612.8-9.5
    Labour Michael Anthony Bohan13710.0-3.3
    Majority88864.3
    Turnout 1,38239.2+4.3
    Conservative hold Swing

    Purton

    Purton
    PartyCandidateVotes%±
    Conservative Jacqui Lay99174.7+3.9
    Liberal Democrat Kate Ann Blye33525.3n/a
    Majority65649.1
    Turnout 1,33732.2+2.9
    Conservative hold Swing

    Redlynch and Landford

    Redlynch and Landford
    PartyCandidateVotes%±
    Conservative Leo Randall1,02066.5+7.9
    Liberal Democrat Martin James Rosell31620.6n/a
    Labour Finbarr Sheehan19812.9-2.5
    Majority70445.9
    Turnout 1,53541.0+6.9
    Conservative hold Swing

    Roundway

    Roundway
    PartyCandidateVotes%±
    Conservative Laura Evelyn Mayes83869.0+5.1
    Labour Kathleen Margaret Shaw13711.3+1.3
    Green Geoff Brewer12410.2n/a
    Liberal Democrat Alasdair Kirkpatrick1159.5n/a
    Majority70157.7
    Turnout 1,21534.9+2.9
    Conservative hold Swing

    Royal Wootton Bassett East

    Royal Wootton Bassett East
    PartyCandidateVotes%±
    Conservative Mollie Eileen May Groom1,04869.8-4.0
    Liberal Democrat Simon Richard Hodkinson27918.6-7.6
    Labour James Edward Sexton17411.6n/a
    Majority76950.9
    Turnout 1,51239.2+5.8
    Conservative hold Swing

    Royal Wootton Bassett North

    Royal Wootton Bassett North
    PartyCandidateVotes%±
    Conservative Mary Isabel Champion74452.6+6.6
    Liberal Democrat Stephen Richard Walls51036.1+7.0
    Labour Heather Denise Reilly16011.3n/a
    Majority23416.5
    Turnout 1,41839.5+10.3
    Conservative hold Swing

    Royal Wootton Bassett South

    Royal Wootton Basset South
    PartyCandidateVotes%±
    Liberal Democrat Chris Hurst1,06149.2+9.5
    Conservative Paul Justin Heaphy86340.0+3.1
    Labour Ron Bardwell1326.1-0.1
    Independent Peter Joseph Doyle1024.7n/a
    Majority1989.1
    Turnout 2,16444.0+6.1
    Liberal Democrat hold Swing

    Salisbury Bemerton

    Salisbury Bemerton
    PartyCandidateVotes%±
    Labour Ricky Rogers56846.3-11.0
    Conservative Gavin Paul Barrett40833.2+14.6
    UKIP Dean Palethorpe927.5-16.6
    Liberal Democrat Robert William Steel877.1n/a
    Green Julia Anne Richardson735.9n/a
    Majority16013.0
    Turnout 1,23228.0+6.1
    Labour hold Swing

    Salisbury Fisherton and Bemerton Village

    Salisbury Fisherton and Bemerton Village
    PartyCandidateVotes%±
    Labour John Michael Perrings Walsh47134.3-2.2
    Conservative Jeremy Robert Lloyd Nettle40529.5-6.9
    Liberal Democrat Mark Philip Duly20815.1-12.0
    Independent Chris Cochrane13910.1n/a
    Green Alison Craig1027.4n/a
    UKIP Paddy Singh493.6n/a
    Majority674.9
    Turnout 1,37939.9+7.9
    Labour hold Swing

    Salisbury Harnham

    Salisbury Harnham
    PartyCandidateVotes%±
    Liberal Democrat Brian Edward Dalton82744.5-2.3
    Conservative Simon James Jackson75640.7+8.9
    Labour Merrin Holroyd1126.0-0.9
    Green Peter Jolyon Matthews975.2n/a
    UKIP Naomi May King663.6-9.9
    Majority713.8
    Turnout 1,86245.5+8.6
    Liberal Democrat hold Swing

    Salisbury St Edmund and Milford

    Salisbury St Edmund and Milford
    PartyCandidateVotes%±
    Conservative Atiqul Hoque65440.5+3.8
    Liberal Democrat Bobbie Chettleburgh55134.1+13.2
    Labour Clive Robert Vincent20912.9-7.1
    Green Sue Wright18211.3-7.3
    Together We Can ReformColin Skelton211.3n/a
    Majority1036.4
    Turnout 1,61944.4+12.5
    Conservative hold Swing

    Salisbury St Francis and Stratford

    Salisbury St Francis and Stratford
    PartyCandidateVotes%±
    Conservative Mary Jacquelin Douglas90949.4-4.7
    Liberal Democrat Julian James Sargood Ellis59632.4+18.4
    Green Richard Bolton18710.2-1.7
    Labour Steven Ian Wadsworth1478.0-12.1
    Majority31317.0
    Turnout 1,84545.0+11.0
    Conservative hold Swing

    Salisbury St Marks and Bishopdown

    Salisbury St Marks and Bishopdown
    PartyCandidateVotes%±
    Conservative Derek William Brown67145.0-12.4
    Independent Hilary Anne Davidson41627.9n/a
    Liberal Democrat Rebecca Ann Heulwen Foster24116.2+0.2
    Labour Tom Mettyear16411.0-15.6
    Majority25517.0
    Turnout 1,49637.2+5.8
    Conservative hold Swing

    Salisbury St Martins and Cathedral

    Salisbury St Martins and Cathedral
    PartyCandidateVotes%±
    Conservative Sven Hocking81741.0+9.8
    Labour Ian Robert Tomes69935.1-6.1
    Liberal Democrat Greg Condliffe31315.7+9.3
    Green Teresa Jane Mary Fallon1155.8-0.2
    UKIP Frances Mary Patricia Howard502.5-12.7
    Majority1185.9
    Turnout 2,00748.0+9.1
    Conservative gain from Labour Swing

    Salisbury St Pauls

    Salisbury St Pauls
    PartyCandidateVotes%±
    Conservative Matthew Jonathan Anthony Dean65044.7+11.7
    Liberal Democrat Paul William Leslie Sample32422.3+15.1
    Labour Caroline Susan Corbin30120.7-7.1
    Green Benji Goehl18012.4-2.6
    Majority32622.3
    Turnout 1,46239.3+7.7
    Conservative hold Swing

    Sherston

    Sherston
    PartyCandidateVotes%±
    Conservative John Percy Simon Stuart Thomson1,15068.6-6.0
    Liberal Democrat Martin Fausing Smith41824.9+10.9
    Labour Steven James Clark1086.4-5.0
    Majority73243.5
    Turnout 1,68342.0+6.4
    Conservative hold Swing

    Southwick

    Southwick
    PartyCandidateVotes%±
    Conservative Horace John Prickett1,14281.5+38.6
    Liberal Democrat Kevin Ian Cottrell25918.5+14.5
    Majority88362.4
    Turnout 1,41539.9+6.3
    Conservative hold Swing

    Summerham and Seend

    Summerham and Seend
    PartyCandidateVotes%±
    Conservative Jonathon Seed1,04756.1-12.2
    Liberal Democrat Jo McManus82144.0n/a
    Majority22612.1
    Turnout 1,87353.7+10.6
    Conservative hold Swing

    The Collingbournes and Netheravon

    The Collingbournes and Netheravon
    PartyCandidateVotes%±
    Conservative Ian Charles Duke Blair-Pilling80863.8n/a
    Independent Alan Stephen Wood27621.8n/a
    Liberal Democrat Glenn Barry Price917.2n/a
    Green Denis Christopher Griffin917.2n/a
    Majority53242.0
    Turnout 1,26638.6n/a
    Conservative hold Swing

    The Lavingtons and Erlestoke

    The Lavingtons and Erlestoke
    PartyCandidateVotes%±
    Conservative Richard Elliott Gamble1,21374.1-2.5
    Liberal Democrat Mark Domnech William Mangham1579.6n/a
    Labour Carol Black1428.7-14.7
    Green Chris Gingell1257.6n/a
    Majority1,05664.2
    Turnout 1,64440.7+8.2
    Conservative hold Swing

    Tidworth

    Tidworth
    PartyCandidateVotes%±
    Conservative Mark Connolly71184.3n/a
    Labour Joan Barnett13315.8n/a
    Majority57868.4
    Turnout 84518.1n/a
    Conservative hold Swing

    Till and Wylye Valley

    Till and Wylye Valley
    PartyCandidateVotes%±
    Conservative Darren George Henry1,13454.2+14.5
    Liberal Democrat Ian Clive West92344.1-11.0
    Labour Gary James Buckley341.6-3.6
    Majority21110.1
    Turnout 2,09557.8+12.5
    Conservative gain from Liberal Democrat Swing

    Tisbury

    Tisbury
    PartyCandidateVotes%±
    Conservative Tony Deane84661.8+1.3
    Liberal Democrat Marcus Deyes34124.9n/a
    Green Christopher H Walford18213.3n/a
    Majority50536.9
    Turnout 1,37038.4+1.4
    Conservative hold Swing

    Trowbridge Adcroft

    Trowbridge Adcroft
    PartyCandidateVotes%±
    Conservative Edward Kirk48342.7+25.0
    Liberal Democrat Nicholas Blakemore44639.4-12.3
    Labour Adrian John Poole20217.9n/a
    Majority373.3
    Turnout 1,13531.5+3.2
    Conservative gain from Liberal Democrat Swing

    Trowbridge Central

    Trowbridge Central
    PartyCandidateVotes%±
    Liberal Democrat Stewart Martin Palmen51142.6+1.8
    Conservative John Roland Wallace Knight41734.8+17.0
    Labour Phoebe Eliana Rosalind Kemp27122.6+7.6
    Majority947.8
    Turnout 1,20232.0+6.4
    Liberal Democrat hold Swing

    Trowbridge Drynham

    Trowbridge Drynham
    PartyCandidateVotes%±
    Conservative Graham David Payne65466.3-5.8
    Labour Laura Michelle Pictor20320.6n/a
    Liberal Democrat John Richard Marsden13013.2-14.7
    Majority45145.5
    Turnout 99231.2+7.7
    Conservative hold Swing

    Trowbridge Grove

    Trowbridge Grove
    PartyCandidateVotes%±
    Conservative David Edward Halik50940.2+18.8
    Liberal Democrat Bob Brice45720.6-25.3
    Labour Liz Gifford17015.0+6.6
    Majority524.6
    Turnout 1,13834.5
    Conservative gain from Liberal Democrat Swing

    Trowbridge Lambrok

    Trowbridge Lambrok
    PartyCandidateVotes%±
    Conservative Deborah Ann Halik48845.5+13.8
    Liberal Democrat Ben Midgley34432.1n/a
    Labour Shaun Samuel James Henley16515.4n/a
    Green Marie Hillcoat757.0n/a
    Majority14413.4
    Turnout 1,07529.3+2.3
    Conservative gain from Independent Swing

    Trowbridge Park

    Trowbridge Park
    PartyCandidateVotes%±
    Conservative Peter Fuller55147.8+7.6
    Independent Dennis Paul Drewett21318.5-24.6
    Labour Jackie Harding19917.3n/a
    Liberal Democrat Roger Guy Andrews19016.5-0.2
    Majority33829.2
    Turnout 1,15831.3+6.1
    Conservative gain from Independent Swing

    Trowbridge Paxcroft

    Trowbridge Paxcroft
    PartyCandidateVotes%±
    Liberal Democrat Stephen John Oldrieve75054.5-11.1
    Conservative James Rothschild St Clair51637.5+3.1
    Labour Maria Adlam-Apps1108.0n/a
    Majority23417.0
    Turnout 1,37930.8+1.5
    Liberal Democrat hold Swing

    Urchfont and The Cannings

    Urchfont and The Cannings
    PartyCandidateVotes%±
    Conservative Philip Whitehead1,15671.8+22.1
    Liberal Democrat John Nicholas Merrett25615.9n/a
    Labour Amanda Hopgood19912.4-4.5
    Majority90055.1
    Turnout 1,63342.4+5.3
    Conservative hold Swing

    Warminster Broadway

    Warminster Broadway
    PartyCandidateVotes%±
    Conservative Tony Jackson66549.5-5.1
    Independent Paul Batchelor33524.9n/a
    Labour Eden Morris17312.9n/a
    Liberal Democrat Martin David John Papworth17112.7n/a
    Majority33024.5
    Turnout 1,34936.8+6.3
    Conservative hold Swing

    Warminster Copheap and Wylye

    Warminster Copheap and Wylye
    PartyCandidateVotes%±
    Conservative Christopher Newbury 1,04674.6+3.3
    Liberal Democrat Ryan John Ellis Bird20414.5n/a
    Labour Nicola Clare Grove15310.9n/a
    Majority84259.5
    Turnout 1,41639.9+8.5
    Conservative hold Swing

    Warminster East

    Warminster East
    PartyCandidateVotes%±
    Conservative Andrew Davis73448.3+8.7
    Independent Paul Ian MacDonald48031.6-2.3
    Labour Eleanor May Free1369.0n/a
    Liberal Democrat Nigel Paul Hampson1097.2n/a
    Green Maggie Richens604.0n/a
    Majority25416.6
    Turnout 1,52836.1+3.9
    Conservative hold Swing

    Warminster West

    Warminster West
    PartyCandidateVotes%±
    Conservative Pip Ridout69458.4n/a
    Independent Stacie Allensby18915.9n/a
    Liberal Democrat Andy Hinchcliffe15212.8n/a
    Green Carrie Moyes907.6n/a
    Labour Tony Free645.4n/a
    Majority50542.3
    Turnout 1,19328.7n/a
    Conservative hold Swing

    Warminster Without

    Warminster Without
    PartyCandidateVotes%±
    Conservative Fleur de Rhé-Philipe 1,01473.3+0.9
    Liberal Democrat Jonathan Whitehead-Whiting21415.5n/a
    Labour Anthony Paul Tyler15611.3-11/4
    Majority65849.3
    Turnout 1,33439.4+7.3
    Conservative hold Swing

    West Selkley

    West Selkley
    PartyCandidateVotes%±
    Conservative Jane Frances Davies93370.2-7.1
    Liberal Democrat Sara Elizabeth Spratt27520.7n/a
    Labour Matthew James Bowman Lee1229.2n/a
    Majority80057.8
    Turnout 1,38540.3+4.4
    Conservative hold Swing

    Westbury East

    Westbury East
    PartyCandidateVotes%±
    Liberal Democrat Gordon Ian King66147.1+5.4
    Conservative Rupert Ashley Lescott60743.2+26.5
    Labour Mike Kettlety1379.8n/a
    Majority543.8
    Turnout 1,40837.1+5.3
    Liberal Democrat hold Swing

    Westbury North

    Westbury North
    PartyCandidateVotes%±
    Liberal Democrat David Jenkins59657.9+3.8
    Conservative David Lancashire29929.1+16.7
    Labour Michael Sutton13413.0+1.3
    Majority29728.8
    Turnout 1,03329.1+1.8
    Liberal Democrat hold Swing

    Westbury West

    Westbury West
    PartyCandidateVotes%±
    Independent Russell Mark Jonathan Hawker35233.4-4.7
    Conservative Nick Stovold30128.6+15.5
    Liberal Democrat Carole King26024.7+19.1
    Labour Jane Francesca Russ11110.5-4.6
    Green Margaret Frances Cavanna292.8n/a
    Majority514.8
    Turnout 1,05327.1+5.1
    Independent hold Swing

    Wilton and Lower Wylye Valley

    Wilton and Lower Wylye Valley
    PartyCandidateVotes%±
    Conservative Pauline Elizabeth Church76046.0+12.3
    Liberal Democrat Peter Derek Edge69241.9-15.1
    Labour Olivia McLennan20012.1+2.8
    Majority684.1
    Turnout 1,66143.3+10.0
    Conservative gain from Liberal Democrat Swing

    Winsley and Westwood

    Winsley and Westwood
    PartyCandidateVotes%±
    Conservative Johnny Kidney1,04056.9+15.7
    Liberal Democrat Magnus Ian Macdonald78843.1-3.0
    Majority25213.7
    Turnout 1,83655.2+11.8
    Conservative gain from Liberal Democrat Swing

    Winterslow

    Winterslow
    PartyCandidateVotes%±
    Independent Christopher Devine77547.2n/a
    Conservative Christopher Duncan Miller59035.9n/a
    Liberal Democrat Colin Richard Baxter1599.7n/a
    Green Alice Jean Kiff744.5n/a
    Labour Ian Martingale452.7n/a
    Majority18511.2
    Turnout 1,64551.9
    Independent hold Swing

    Related Research Articles

    Liberal Party (UK, 1989) political party of the United Kingdom, from 1989

    The Liberal Party is a British political party that was founded in 1989 by members of the original Liberal Party opposed to its merger with the Social Democratic Party (SDP) to form the Liberal Democrats. The party holds seven local council seats.

    2009 Cambridgeshire County Council election

    An election to Cambridgeshire County Council took place on 4 June 2009 as part of the United Kingdom local elections, 2009. The election was delayed from 7 May to coincide with elections to the European Parliament. 69 councillors were elected from 60 electoral divisions, which returned either one or two county councillors each by first-past-the-post voting. The Conservative Party retained their majority on the council, while the Green Party and UKIP gained their first seats.

    2012 East Lothian Council election

    Elections to East Lothian Council were held on 3 May 2012, on the same day as the other Scottish local government elections. The election used the 7 wards created as a result of the Local Governance (Scotland) Act 2004, with each ward electing three or four councillors using the single transferable vote system a form of proportional representation, with 23 councillors elected.

    2013 Norfolk County Council election

    The Norfolk County Council election took place across Norfolk on 2 May 2013, coinciding with local elections for all county councils in England. The results were announced the following day, Friday 3 May 2013. The result brought to an end 12 years of Conservative administration, who finished three seats short of a majority after losing 20 seats, leaving the Council in no overall control (NOC). UKIP and the Labour Party both made gains of 14 and 11 seats respectively. The Liberal Democrats and the Green Party both lost three seats each, whilst an independent won a single seat in North Norfolk.

    2013 Wiltshire Council election

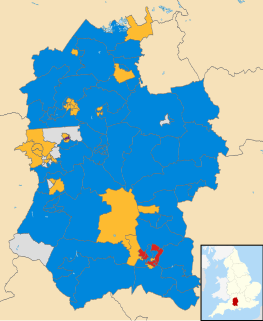
    Elections to the Wiltshire Council unitary authority took place on 2 May 2013. All ninety-eight seats were up for election, with each councillor being elected in a single-member electoral division, although in six of the divisions only one candidate was nominated and was thus declared the winner without elections taking place.

    2013 Hampshire County Council election

    An election to Hampshire County Council took place on 2 May 2013 as part of the United Kingdom local elections, 2013. 78 councillors were elected from 75 electoral divisions, which returned either one or two county councillors each by first-past-the-post voting for a four-year term of office. The electoral divisions were the same as those of the previous election in 2009. No elections were held in Portsmouth and Southampton, which are unitary authorities outside the area covered by the County Council. The election saw the Conservative Party retain overall control of the council, with a reduced majority of five councillors.

    2013 Hertfordshire County Council election

    An election to Hertfordshire County Council took place on 2 May 2013 as part of the United Kingdom local elections, 2013. 77 electoral divisions elected one county councillor each by first-past-the-post voting for a four-year term of office. The electoral divisions were the same as those used at the previous election in 2009.

    The fifth election to the Carmarthenshire County Council was held on 1 May 2012. It was preceded by the 2008 election and was followed by the 2017 election. Plaid Cymru won 28 seats whilst Labour and the Independents won 23 each. The main feature of the election was a Labour recovery in the Llanelli area, and to some extent in the Gwendraeth and Ammanford area also, mainly at the expense of Independent candidates. Plaid Cymru lost ground to Labour in the Llanelli area but gained seats elsewhere, becoming the largest party. An Independent-Labour coalition was again formed, but with Labour as the leading partner. As a result, Kevin Madge replaced Meryl Gravell as the leader of the council.

    2014 North East Lincolnshire Council election

    The 2014 North East Lincolnshire Council election took place on 22 May 2014 to elect members of North East Lincolnshire Council in England. This was on the same day as other local elections. These elections saw UKIP making significant gains largely at the expense of Labour, and stripping them of their majority on the council.

    2015 North East Lincolnshire Council election

    The 2015 North East Lincolnshire Council election took place on 7 May 2015 to elect members of North East Lincolnshire Council in England. This was on the same day as other local elections and the general election for the House of Commons of the United Kingdom.

    2015 Breckland District Council election

    The 2015 Breckland District Council election took place on 7 May 2015 to elect members of Breckland District Council in England. This was on the same day as other local elections.

    2017 United Kingdom local elections

    The 2017 United Kingdom local elections were held on Thursday 4 May 2017. Local elections were held across Great Britain, with elections to 35 English local authorities and all councils in Scotland and Wales.

    2017 Kent County Council election

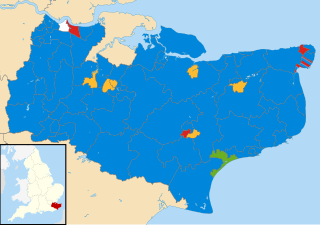
    The 2017 Kent County Council election was held on 4 May 2017 as part of the 2017 local elections in the United Kingdom. All 81 councillors were elected, from 72 electoral divisions, each of which returned either one or two county councillors by first-past-the-post voting for a four-year term of office.

    2017 Norfolk County Council election

    The 2017 Norfolk County Council election took place on 4 May 2017 as part of the 2017 local elections in the United Kingdom.

    2017 Cornwall Council election

    The 2017 Cornwall Council election was held on 4 May 2017 as part of the 2017 local elections in the United Kingdom. 122 councillors were elected from the 121 electoral divisions of Cornwall Council, which returned either one or two councillors each by first-past-the-post voting for a four-year term of office. Although originally scheduled to take place on the same day, the election in the Bodmin St Petroc ward was countermanded following the death of Liberal Democrat candidate Steve Rogerson and was held on 8 June.

    2017 Welsh local elections

    Local elections were held in Wales on Thursday 4 May 2017 to elect members of all 22 local authorities, including the Isle of Anglesey, which was last up for election in 2013 due to having its elections delayed for a year. These local elections were held alongside local elections in Scotland and parts of England.

    2017 Argyll and Bute Council election

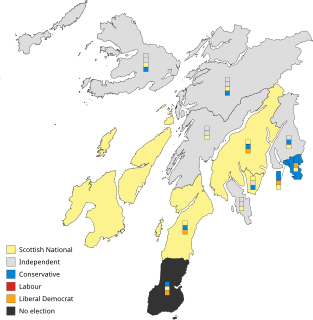
    The 2017 Argyll and Bute Council elections took place on 4 May 2017 alongside local elections across Scotland. This was the third local election to take place using the Single Transferable Vote electoral system.

    2019 United Kingdom local elections

    Local elections in the United Kingdom were held on Thursday 2 May 2019, with 248 English local councils, six directly elected mayors in England, and all 11 local councils in Northern Ireland being contested.

    The 2019 Bath and North East Somerset Council election was held on 2 May 2019 to elect members of Bath and North East Somerset Council in England.

    References

    1. "Upcoming elections & referendums". Electoral Commission. Retrieved 15 September 2016.
    2. "Unitary council election on Thursday 4 May 2017". Wiltshire Council. 11 May 2017. Retrieved 11 May 2017.