An election was held in Swale Borough Council in England as part of the United Kingdom local elections on 7 May 2015. [1] All 47 seats were up for election under new ward boundaries.
Swale Borough Council is the local authority for Swale in Kent, England.
The party results were as follows: Conservative Party (UK) 32, UK Independence Party 9, Labour Party (UK) 4, Independent politician 2.
The Conservative Party, officially the Conservative and Unionist Party, is a centre-right political party in the United Kingdom. Presently led by Theresa May, it has been the governing party since 2010. It presently has 314 Members of Parliament in the House of Commons, 249 members of the House of Lords, and 18 members of the European Parliament. It also has 31 Members of the Scottish Parliament, 12 members of the Welsh Assembly, eight members of the London Assembly and 9,008 local councillors. One of the major parties of UK politics, it has formed the government on 45 occasions, more than any other party.
The UK Independence Party is a hard Eurosceptic, right-wing political party in the United Kingdom. It currently has one representative in the House of Lords and seven Members of the European Parliament (MEPs). It has four Assembly Members (AMs) in the National Assembly for Wales and one member in the London Assembly. The party reached its greatest level of success in the mid-2010s, when it gained two Members of Parliament and was the largest UK party in the European Parliament.
The Labour Party is a centre-left political party in the United Kingdom which has been described as an alliance of social democrats, democratic socialists and trade unionists. The party's platform emphasises greater state intervention, social justice and strengthening workers' rights. Labour is a full member of the Party of European Socialists and Progressive Alliance, and holds observer status in the Socialist International. As of 2017, the party was considered the "largest party in Western Europe" in terms of party membership, with more than half a million members.
Party | Candidate | Votes | % | ± | |
---|---|---|---|---|---|
Conservative | Anita Walker | 839 | 18 | ||
Conservative | Bryan Mulhern | 799 | 17 | ||
Labour | Trevor Raymond Payne | 659 | 14 | ||
Labour | Frances Rehal | 513 | 11 | ||
Independent | Sue Akhurst | 448 | 10 | ||
Green | Tina Jane Hagger | 389 | 8 | ||
UKIP | Andrea Mckenna | 365 | 8 | ||
Green | Gary Miller | 331 | 7 | ||
Independent | Gulliver Immink | 305 | 7 | ||
Majority | |||||
Turnout | 4,648 | 63.0 | |||
Conservative hold | Swing | ||||
Conservative hold | Swing |
Party | Candidate | Votes | % | ± | |
---|---|---|---|---|---|
Conservative | Ben Stokes | 1,336 | 32 | ||
Conservative | Duncan Dewar-Whalley | 1,295 | 31 | ||
UKIP | Lloyd George Chapman | 881 | 21 | ||
Labour | Nigel Randell | 656 | 16 | ||
Majority | |||||
Turnout | 4,168 | 73.1 | |||
Conservative hold | Swing | ||||
Conservative hold | Swing |
Party | Candidate | Votes | % | ± | |
---|---|---|---|---|---|
Conservative | Nicholas Hampshire | 1,403 | 28 | ||
UKIP | Mike Baldock | 1,344 | 27 | ||
Conservative | Gareth Randall | 1,024 | 21 | ||
UKIP | Pat Kazim | 623 | 13 | ||
Labour | Margaret Cooper | 529 | 11 | ||
Majority | |||||
Turnout | 4,923 | 67.9 | |||
Conservative hold | Swing | ||||
UKIP gain from Conservative | Swing | ||||
Party | Candidate | Votes | % | ± | |
---|---|---|---|---|---|
Conservative | Andrew Bowles | 1,535 | 27 | ||
Conservative | George Bobbin | 1,434 | 25 | ||
UKIP | Eve Martin | 676 | 12 | ||
Independent | Jeff Tutt | 579 | 10 | ||
Labour | Valerie Janet Collman | 518 | 9 | ||
Green | Tim Valentine | 479 | 9 | ||
Labour | Ashok Kumar Rehal | 403 | 7 | ||
Majority | |||||
Turnout | 5,624 | 72.8 | |||
Conservative hold | Swing | ||||
Conservative hold | Swing |
Party | Candidate | Votes | % | ± | |
---|---|---|---|---|---|
Labour | Ghlin Whelan | 518 | 44 | ||
Conservative | Sylvia Bennett | 366 | 31 | ||
UKIP | Paul Ian Gebbie | 242 | 21 | ||
Liberal Democrat | Anthea Mary Spurling | 44 | 4 | ||
Majority | |||||
Turnout | 1,170 | 59.8 | |||
Labour hold | Swing |
Party | Candidate | Votes | % | ± | |
---|---|---|---|---|---|
Conservative | Colin Prescott | 1,027 | 64 | ||
Labour | Barry William Hefferon | 294 | 18 | ||
Green | Huw Maelor Jones | 274 | 17 | ||
Majority | |||||
Turnout | 1,595 | 75.2 | |||
Conservative hold | Swing |
Party | Candidate | Votes | % | ± | |
---|---|---|---|---|---|
Conservative | Gerry Lewin | 1,671 | 32 | ||
Conservative | John Wright | 1,226 | 23 | ||
UKIP | Richard Palmer | 1,070 | 20 | ||
UKIP | Helen Walker | 798 | 15 | ||
Labour | Simon Clark | 534 | 10 | ||
Majority | |||||
Turnout | 5,299 | 73.4 | |||
Conservative hold | Swing | ||||
Conservative hold | Swing |
Party | Candidate | Votes | % | ± | |
---|---|---|---|---|---|
Conservative | Alan Campbell Horton | 1,171 | 22 | ||
Labour | Roger Truelove | 1,052 | 20 | ||
Labour | Richard Raycraft | 983 | 19 | ||
Conservative | Danielle Marie Smith | 960 | 18 | ||
UKIP | Christine Palmer | 797 | 15 | ||
Liberal Democrat | Brenda Hammond | 295 | 6 | ||
Majority | |||||
Turnout | 5,258 | 69.2 | |||
Conservative gain from Labour | Swing | ||||
Labour hold | Swing |
Party | Candidate | Votes | % | ± | |
---|---|---|---|---|---|
Conservative | Susan Ann Gent | 1,118 | 25 | ||
Conservative | Mike Dendor | 1,031 | 23 | ||
UKIP | Derek William Carnell | 952 | 22 | ||
Labour | Andy Cooper | 561 | 13 | ||
Labour | Libby McCusker | 556 | 13 | ||
Liberal Democrat | Mary Zeng | 194 | 4 | ||
Majority | |||||
Turnout | 4,412 | 61.9 | |||
Conservative hold | Swing | ||||
Conservative hold | Swing |
Party | Candidate | Votes | % | ± | |
---|---|---|---|---|---|
Conservative | Roger Gordon Clark | 993 | 27 | ||
UKIP | Katy Coleman | 849 | 23 | ||
Labour | Adam Tolhurst | 845 | 23 | ||
Labour | Tony Winckless | 754 | 20 | ||
Liberal Democrat | David Spurling | 252 | 7 | ||
Majority | |||||
Turnout | 3,693 | 59.6 | |||
Conservative gain from Labour | Swing | ||||
UKIP gain from Labour | Swing | ||||
Party | Candidate | Votes | % | ± | |
---|---|---|---|---|---|
UKIP | Adrian Crowther | 1,552 | 23 | ||
Conservative | Andy Booth | 1,528 | 23 | ||
Conservative | Ken Pugh | 1,479 | 22 | ||
Conservative | Heather Thomas-Pugh | 1,217 | 18 | ||
Labour | Libby Tucker | 864 | 13 | ||
Majority | |||||
Turnout | 6,640 | 65.8 | |||
UKIP gain from Conservative | Swing | ||||
Conservative hold | Swing | ||||
Conservative hold | Swing |
Party | Candidate | Votes | % | ± | |
---|---|---|---|---|---|
Conservative | Samuel Koffie-Williams | 892 | 28 | ||
UKIP | James Hall | 876 | 28 | ||
Labour | Ken Rowles | 621 | 20 | ||
Labour | Paul Wilson | 466 | 15 | ||
Liberal Democrat | Rosemary Madgwick | 324 | 10 | ||
Majority | |||||
Turnout | 3,179 | 54.5 | |||
Conservative hold | Swing | ||||
UKIP gain from Labour | Swing | ||||
Party | Candidate | Votes | % | ± | |
---|---|---|---|---|---|
Independent | Michael Scott Henderson | 610 | 50 | ||
Conservative | Andrew Culham | 356 | 29 | ||
Labour | Janet Elizabeth Miall | 196 | 16 | ||
Green | Helen Eileen Miller | 61 | 5 | ||
Majority | |||||
Turnout | 1,223 | 62.5 | |||
Independent hold | Swing |
Party | Candidate | Votes | % | ± | |
---|---|---|---|---|---|
UKIP | Richard Darby | 1,511 | 25 | ||
Conservative | Cameron Beart | 1,230 | 20 | ||
Conservative | Peter Marchington | 1,115 | 18 | ||
Labour | Mick Cole | 810 | 13 | ||
Labour | Rikki Cole | 671 | 11 | ||
Labour | Terry Purvis | 518 | 8 | ||
Independent | Eddie Johnson | 258 | 4 | ||
Majority | |||||
Turnout | 6,113 | 62.9 | |||
UKIP gain from Labour | Swing | ||||
Conservative gain from Labour | Swing | ||||
Conservative hold | Swing |
Party | Candidate | Votes | % | ± | |
---|---|---|---|---|---|
Conservative | Sarah Aldridge | 1,211 | 26 | ||
UKIP | Paul Fleming | 1,008 | 21 | ||
Labour | Georgie Jessiman | 964 | 20 | ||
Conservative | Dawn Louise Gale | 784 | 17 | ||
Labour | Martin McCusker | 740 | 16 | ||
Majority | |||||
Turnout | 4,707 | 61.4 | |||
Conservative gain from Labour | Swing | ||||
UKIP gain from Labour | Swing | ||||
Party | Candidate | Votes | % | ± | |
---|---|---|---|---|---|
UKIP | Mick Galvin | 1,562 | 22 | ||
Labour | Angela Harrison | 1,315 | 18 | ||
Labour | Mark Ellen | 1,149 | 16 | ||
Labour | Steve Worrall | 1,106 | 15 | ||
Conservative | John Dewey | 1,054 | 15 | ||
Conservative | Andrew James Scott | 742 | 10 | ||
Liberal Democrat | David Kemp | 278 | 4 | ||
Majority | |||||
Turnout | 7,206 | 52.1 | |||
UKIP gain from Labour | Swing | ||||
Labour hold | Swing | ||||
Labour hold | Swing |
Party | Candidate | Votes | % | ± | |
---|---|---|---|---|---|
Conservative | Tina Booth | 1,227 | 16 | ||
UKIP | June Garrad | 1,203 | 16 | ||
Conservative | Ken Ingleton | 1,152 | 15 | ||
UKIP | David Lloyd Jones | 1,108 | 15 | ||
Conservative | Peter Macdonald | 987 | 13 | ||
Labour | Alan Henley | 704 | 9 | ||
Labour | Pat Wiggins | 647 | 9 | ||
Independent | Elliott Matthew Jayes | 251 | 3 | ||
Monster Raving Loony | Mad Mike Young | 230 | 3 | ||
Majority | |||||
Turnout | 7,509 | 60.8 | |||
Conservative hold | Swing | ||||
UKIP hold | Swing | ||||
Conservative hold | Swing |
Party | Candidate | Votes | % | ± | |
---|---|---|---|---|---|
UKIP | Padmini Nissanga | 1089 | 32 | ||
Conservative | Lesley Ingham | 815 | 24 | ||
Conservative | Pat Sandle | 680 | 20 | ||
Labour | Mark Tucker | 336 | 10 | ||
Labour | Matt Wheatcroft | 273 | 8 | ||
Independent | Geoff Partis | 205 | 6 | ||
Majority | |||||
Turnout | 3,398 | 61.3 | |||
UKIP gain from Conservative | Swing | ||||
Conservative hold | Swing |
Party | Candidate | Votes | % | ± | |
---|---|---|---|---|---|
Conservative | Mike Cosgrove | 1096 | 22 | ||
Conservative | Nigel Kay | 879 | 18 | ||
Labour | Paul Durkin | 663 | 14 | ||
Labour | Carole Hannah Jackson | 614 | 13 | ||
UKIP | Shelley Wilson | 451 | 9 | ||
Green | Gavin Alastair Eugene McGregor | 327 | 7 | ||
Independent | Mark Hinton | 318 | 7 | ||
Independent | Paul John Cumberland | 305 | 6 | ||
Green | Juman Simaan | 223 | 5 | ||
Majority | |||||
Turnout | 4,876 | 68.7 | |||
Conservative hold | Swing | ||||
Conservative hold | Swing |
Party | Candidate | Votes | % | ± | |
---|---|---|---|---|---|
Conservative | Lloyd Bowen | 1,680 | 40 | ||
Conservative | Mike Whiting | 990 | 23 | ||
UKIP | Trevor Howard Fentiman | 878 | 21 | ||
Labour | Philip Dangerfield | 691 | 16 | ||
Majority | |||||
Turnout | 4,239 | 68.5 | |||
Conservative hold | Swing | ||||
Conservative hold | Swing |
Party | Candidate | Votes | % | ± | |
---|---|---|---|---|---|
Conservative | James Christopher Hunt | 722 | 54 | ||
UKIP | Matthew Palmer | 354 | 26 | ||
Labour | Karen Watson | 267 | 20 | ||
Majority | |||||
Turnout | 1,343 | 64.3 | |||
Conservative hold | Swing |
Party | Candidate | Votes | % | ± | |
---|---|---|---|---|---|
Conservative | David Simmons | 1307 | 23 | ||
Conservative | Ted Wilcox | 1260 | 22 | ||
UKIP | Warren George Wilson | 1119 | 20 | ||
Labour | Catherine Read | 806 | 14 | ||
Labour | Anna Hefferon | 707 | 12 | ||
Green | Viv Moore | 486 | 9 | ||
Majority | |||||
Turnout | 5,685 | 74.2 | |||
Conservative hold | Swing | ||||
Conservative hold | Swing |
Party | Candidate | Votes | % | ± | |
---|---|---|---|---|---|
Independent | Monique Bonney | 838 | 51 | ||
Conservative | Keith Ferrin | 807 | 49 | ||
Majority | |||||
Turnout | 1,645 | 78.7 | |||
Independent hold | Swing |
Party | Candidate | Votes | % | ± | |
---|---|---|---|---|---|
Conservative | Derek Conway | 1604 | 27 | ||
Conservative | George Samuel | 1238 | 21 | ||
UKIP | Lee Burgess | 762 | 13 | ||
UKIP | Ian Davison | 692 | 12 | ||
Labour | James Beer | 473 | 8 | ||
Labour | Shelley Cheesman | 458 | 8 | ||
Liberal Democrat | Ann McLean | 332 | 6 | ||
Independent | Sue Senior | 184 | 3 | ||
Independent | Allyson Spicer | 152 | 3 | ||
Majority | |||||
Turnout | 5,895 | 74.7 | |||
Conservative hold | Swing | ||||
Conservative hold | Swing |
A by-election was held in Milton Regis on 3 August 2017 after the death of UKIP councillor Katy Coleman. [2] The seat was gained for Labour by former councillor Tony Winckless with a majority of 318 votes over Conservative candidate Kane Roy Blackwell.
By-elections, also spelled bye-elections, are used to fill elected offices that have become vacant between general elections.
Milton Regis is a village in the district of Swale in Kent, England. Former names include Milton-next-Sittingbourne, Milton Royal, Middleton, Midletun and Middletune. It has a population of about 5,000. Today it is a suburb of Sittingbourne although this has not always been the case, Milton Regis has the older and richer history. Until around 1800 Sittingbourne was a smaller hamlet and under the control of the Manor of Milton Regis.
Party | Candidate | Votes | % | ± | |
---|---|---|---|---|---|
Labour | Tony Winckless | 573 | 53.7 | ||
Conservative | Kane Roy Blackwell | 255 | 23.9 | ||
UKIP | Richard Frank Palmer | 151 | 14.1 | ||
Liberal Democrat | Tony Clark | 86 | 8.0 | ||
Majority | 318 | ||||
Turnout | 1,066 | 23.4 | |||
Labour gain from UKIP | Swing | ||||
A by-election was held in Sheppey East on 3 May 2018 after the resignation of Conservative councillor Lesley Ingham. The seat was held for the Conservatives by Lynd Ernest Taylor with a majority of 184 votes over Labour candidate Gill Smith.
Party | Candidate | Votes | % | ± | |
---|---|---|---|---|---|
Conservative | Lynd Ernest Taylor | 522 | 46.5 | ||
Labour | Gillian Barbara Smith | 338 | 30.1 | ||
UKIP | Sunatha Nissanga | 235 | 20.9 | ||
Liberal Democrat | Marc Justin Wilson | 23 | 2.0 | ||
Majority | 184 | ||||
Turnout | 1,121 | 26.5 | |||
Conservative hold | Swing |
UKIP councillor Katy Coleman (Milton Regis) died suddenly on 30 May 2017. [3] At the consequent by-election on 3 August 2017 Labour gained the seat. New councillor Tony Winckless.
Conservative councillor Lesley Ingham (Sheppey East) resigned her seat in March 2018. [4] At the consequent by-election on 3 May 2018 the Conservatives held the seat. New councillor Lynd Taylor.
All 8 remaining UKIP councillors as of April 2018 sit as 'The Swale Group'. [5]
Sittingbourne and Sheppey is a constituency represented in the House of Commons since 2010 by Gordon Henderson, a Conservative.
The 2011 council elections in Guildford saw the Conservatives retain control over Guildford Borough Council with an increased majority of 20 seats. Full results for each ward can be found at Guildford Council election, full results, 2011.
The 2012 Plymouth City Council election took place on 3 May 2012 to elect members of Plymouth City Council in England. This was on the same day as other local elections. The election was won by the Labour Party, who gained control of the council from the Conservative Party.
The Kent County Council election, 2013 was an election to all 84 seats on Kent County Council held on Thursday 2 May as part of the United Kingdom local elections, 2013. 84 councillors were elected from 72 electoral divisions, which returned either one or two county councillors each by first-past-the-post voting for a four-year term of office. The electoral divisions were the same as those used at the previous election in 2009. No elections were held in Medway, which is a unitary authority outside the area covered by the County Council. The election saw the Conservative Party narrowly retain overall control of the council.
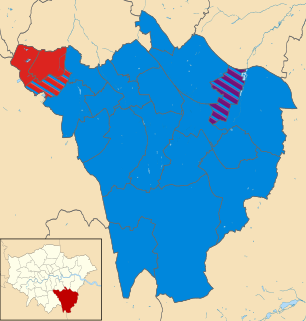
Elections to Bromley Council were held on 22 May 2014.
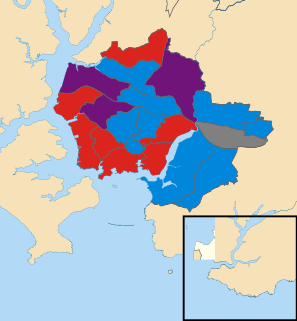
The 2014 Plymouth City Council election took place on 22 May 2014 to elect members of Plymouth City Council in England. This was on the same day as other local elections. The election was won by the Labour Party, who maintained their overall majority. The UK Independence Party gained representation on the council for the first time, and this was the only election in which the party won seats in Plymouth.
The 2012 Huntingdonshire District Council election took place on 3 May 2012 to elect members of Huntingdonshire District Council in Cambridgeshire, England. One third of the council was up for election and the Conservative party stayed in overall control of the council.
The 2006 Swale Borough Council election took place on 4 May 2006 to elect members of Swale Borough Council in Kent, England. One third of the council was up for election and the Conservative party stayed in overall control of the council.
The 2007 Swale Borough Council election took place on 3 May 2007 to elect members of Swale Borough Council in Kent, England. One third of the council was up for election and the Conservative party stayed in overall control of the council.
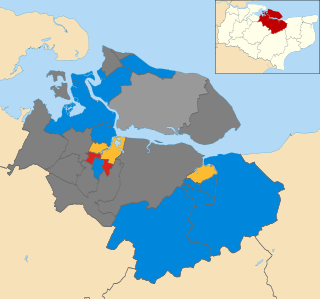
The 2008 Swale Borough Council election took place on 1 May 2008 to elect members of Swale Borough Council in Kent, England. One third of the council was up for election and the Conservative party stayed in overall control of the council.
The 2010 Swale Borough Council election took place on 6 May 2010 to elect members of Swale Borough Council in Kent, England. One third of the council was up for election and the Conservative party stayed in overall control of the council.
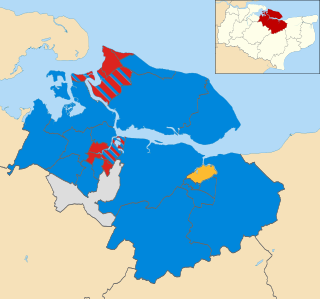
The 2011 Swale Borough Council election took place on 5 May 2011 to elect members of Swale Borough Council in Kent, England. The whole council was up for election and the Conservative party stayed in overall control of the council.
The 2015 Harlow District Council election took place on 7 May 2015 to elect members of Harlow District Council in Essex, England. One third of the council was up for election and Labour party councillors increased their control of the council as the governing group, gaining one councillor and suffering no losses.
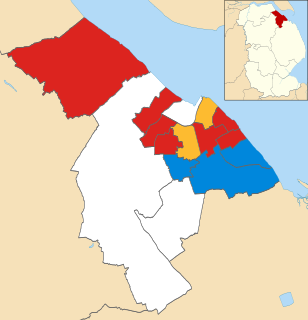
The 2016 North East Lincolnshire Council election took place on 5 May 2016 to elect members of North East Lincolnshire Council in England. This was on the same day as other local elections.
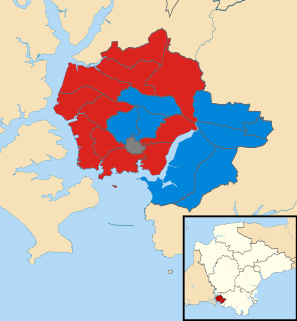
The 2016 Plymouth City Council election took place on 5 May 2016 to elect members of Plymouth City Council in England. The Conservatives gained one seat from Labour, resulting in both parties having twenty-seven members of the council. A coalition of Conservative and UKIP members took overall control of the Council, having thirty members in total and a working majority.
The 2017 United Kingdom local elections were held on Thursday 4 May 2017. Local elections were held across Great Britain, with elections to 35 English local authorities and all councils in Scotland and Wales.
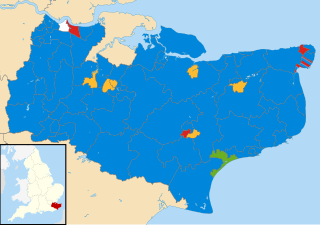
The 2017 Kent County Council election was held on 4 May 2017 as part of the 2017 local elections in the United Kingdom. All 81 councillors were elected, from 72 electoral divisions, each of which returned either one or two county councillors by first-past-the-post voting for a four-year term of office.
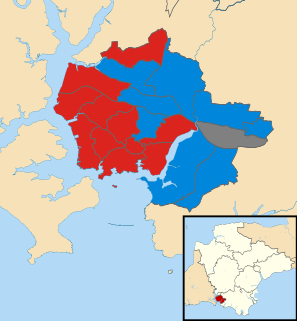
The 2018 Plymouth City Council election took place on 3 May 2018 to elect members of Plymouth City Council in England. The election was won by the Labour Party, who gained enough seats to achieve an overall majority and took control of the council.
Elections to Cannock Chase District Council took place on 3 May 2018 on the same day as other local elections in England. A third of the council was up for election, meaning a total of 13 councillors were elected from all but two of the council's wards.
The 2018 Sunderland City Council election took place on 3 May 2018 to elect members of Sunderland City Council in England. The election took place on the same day as other local elections.
This Elections in England related article is a stub. You can help Wikipedia by expanding it. |