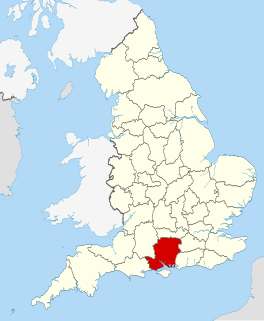
The 2006 Winchester Council election took place on 4 May 2006 to elect members of Winchester District Council in Hampshire, England. One third of the council was up for election and the Conservative party gained overall control of the council from no overall control. [1]
The City of Winchester is a local government district in Hampshire, England, with city status.
Non-metropolitan districts, or colloquially "shire districts", are a type of local government district in England. As created, they are sub-divisions of non-metropolitan counties in a two-tier arrangement.
Hampshire is a county on the southern coast of England. The county town is the city of Winchester. Its two largest cities, Southampton and Portsmouth, are administered separately as unitary authorities; the rest of the county is governed by Hampshire County Council.
After the election, the composition of the council was
The Conservative Party, officially the Conservative and Unionist Party, is a centre-right political party in the United Kingdom. The governing party since 2010, it is the largest in the House of Commons, with 313 Members of Parliament, and also has 249 members of the House of Lords, 18 members of the European Parliament, 31 Members of the Scottish Parliament, 12 members of the Welsh Assembly, eight members of the London Assembly and 8,916 local councillors.
The Liberal Democrats are a centrist, liberal political party in the United Kingdom. It is currently led by Vince Cable. It has 11 Members of Parliament in the House of Commons, 96 members of the House of Lords, one member of the European Parliament, five Members of the Scottish Parliament and one member in the Welsh Assembly and London Assembly. At the height of its influence, the party served as junior partners in a coalition government with the Conservative Party from 2010 to 2015.
The Labour Party is a centre-left political party in the United Kingdom that has been described as an alliance of social democrats, democratic socialists and trade unionists. The party's platform emphasises greater state intervention, social justice and strengthening workers' rights.
Before the election the Liberal Democrats had 26 seats, the Conservatives 22, independents 5 and Labour 4. [3] 19 seats were being contested with 4 Liberal Democrat and 1 independent councillors standing down at the election, while the council leader Sheila Campbell and 2 other cabinet members were defending seats. [3]
A Councillor is a member of a local government council.
Issues in the election included anti-social behaviour, council tax, rural transportation and planning policy. [4]
Anti-social behaviours are actions that harm or lack consideration for the well-being of others. It has also been defined as any type of conduct that violates the basic rights of another person and any behaviour that is considered to be disruptive to others in society. This can be carried out in various ways, which includes but is not limited to intentional aggression, as well as covert and overt hostility. Anti-social behaviour also develops through social interaction within the family and community. It continuously affects a child's temperament, cognitive ability and their involvement with negative peers, dramatically affecting children's problem solving skills. Many people also label behaviour which is deemed contrary to prevailing norms for social conduct as anti-social behaviour. However, researchers have stated that it is a difficult term to define, particularly in the United Kingdom where there are an infinite number of acts that fall into its category. The term is especially used in British English.
The count was disrupted delaying the last result after some of the ballot papers were set on fire meaning water had to be poured into the ballot box. [5] [6] The results saw the Conservatives take control of the council for the first time since the early 1990s. [7] They gained 7 seats included 5 from the Liberal Democrats and 1 each from Labour and the independents. [5] [6] Conservatives defeated both the Liberal Democrat council leader Sheila Campbell and the Labour leader Patrick Davies. [7]
A ballot box is a temporarily sealed container, usually a square box though sometimes a tamper resistant bag, with a narrow slot in the top sufficient to accept a ballot paper in an election but which prevents anyone from accessing the votes cast until the close of the voting period.
The widespread press coverage earlier in the year about the local Liberal Democrat MP Mark Oaten having had sex with male prostitutes was seen as having damaged the Liberal Democrats and benefited the Conservatives. [8] [9] [10] Oaten took no part in the campaign and the former leader of the council, Sheila Campbell, agreed that his troubles had hurt the Liberal Democrats. [5] In the July after the election Oaten announced that he would be standing down from parliament at the next general election. [11]
Mark Oaten is a British politician who was a senior member of the Liberal Democrats. He served as the Member of Parliament for Winchester from 1997-2010.
Male prostitution is the act or practice of men providing sexual services in return for payment. It is a form of sex work. Although clients can be any gender, the vast majority are male. Compared to female prostitutes, male prostitutes have been far less studied by researchers.
Following the election George Beckett became the new Conservative leader of the council. [12]
Party | Seats | Gains | Losses | Net gain/loss | Seats % | Votes % | Votes | +/− | |
---|---|---|---|---|---|---|---|---|---|
Conservative | 13 | 7 | 0 | +7 | 68.4 | 53.8 | 17,604 | +12.1% | |
Liberal Democrat | 4 | 0 | 5 | -5 | 21.1 | 33.8 | 11,047 | -8.3% | |
Labour | 1 | 0 | 1 | -1 | 5.3 | 6.4 | 2,100 | -1.0% | |
Independent | 1 | 0 | 1 | -1 | 5.3 | 5.8 | 1,898 | -0.1% | |
UKIP | 0 | 0 | 0 | 0 | 0 | 0.2 | 64 | -2.6% |
Party | Candidate | Votes | % | ± | |
---|---|---|---|---|---|
Independent | Georgina Busher | 985 | 45.8 | +0.6 | |
Conservative | Roger Hockin | 928 | 43.2 | +16.9 | |
Labour | Stephen Haines | 120 | 5.6 | +1.3 | |
Independent | Ruby Forrest | 117 | 5.4 | +5.4 | |
Majority | 57 | 2.6 | -16.3 | ||
Turnout | 2,150 | 42 | |||
Independent hold | Swing |
Party | Candidate | Votes | % | ± | |
---|---|---|---|---|---|
Conservative | Harry Verney | 565 | 62.6 | +10.1 | |
Liberal Democrat | Christopher Day | 338 | 37.4 | -7.5 | |
Majority | 227 | 25.2 | +17.6 | ||
Turnout | 903 | 53 | |||
Conservative hold | Swing |
Party | Candidate | Votes | % | ± | |
---|---|---|---|---|---|
Liberal Democrat | Richard Izard | 971 | 51.3 | -10.1 | |
Conservative | Theresa Marshall | 850 | 44.9 | +12.3 | |
Labour | Tessa Valentine | 73 | 3.9 | -2.2 | |
Majority | 121 | 6.4 | -22.4 | ||
Turnout | 1,894 | 47 | |||
Liberal Democrat hold | Swing |
Party | Candidate | Votes | % | ± | |
---|---|---|---|---|---|
Conservative | Frederick Allgood | 1,742 | 81.4 | +9.6 | |
Liberal Democrat | Thomas Houghton | 320 | 15.0 | -9.3 | |
Labour | David Picton-Jones | 78 | 3.6 | -0.4 | |
Majority | 1,422 | 66.4 | +18.9 | ||
Turnout | 2,140 | 41 | |||
Conservative hold | Swing |
Party | Candidate | Votes | % | ± | |
---|---|---|---|---|---|
Conservative | Antony Coates | 740 | 78.5 | +10.0 | |
Liberal Democrat | Margaret Scriven | 203 | 21.5 | -8.2 | |
Majority | 537 | 57.0 | +18.2 | ||
Turnout | 943 | 59 | |||
Conservative hold | Swing |
Party | Candidate | Votes | % | ± | |
---|---|---|---|---|---|
Conservative | Stanley Howell | 799 | 51.0 | +9.6 | |
Liberal Democrat | Hilary Jones | 697 | 44.5 | -0.6 | |
Labour | Elaine Fullaway | 70 | 4.5 | -0.6 | |
Majority | 102 | 6.5 | |||
Turnout | 1,566 | 49 | |||
Conservative gain from Liberal Democrat | Swing | ||||
Party | Candidate | Votes | % | ± | |
---|---|---|---|---|---|
Liberal Democrat | Brian Colin | 837 | 48.7 | -9.2 | |
Conservative | Susan Evershed | 829 | 48.2 | +11.1 | |
Labour | David Smith | 53 | 3.1 | -1.9 | |
Majority | 8 | 0.5 | -20.3 | ||
Turnout | 1,719 | 54 | |||
Liberal Democrat hold | Swing |
Party | Candidate | Votes | % | ± | |
---|---|---|---|---|---|
Conservative | Laurence Ruffell | 881 | 60.2 | +15.9 | |
Liberal Democrat | Roy Stainton | 539 | 36.8 | -16.0 | |
Labour | Brian Fullaway | 44 | 3.0 | +0.1 | |
Majority | 342 | 23.4 | |||
Turnout | 1,464 | 49 | |||
Conservative gain from Liberal Democrat | Swing | ||||
Party | Candidate | Votes | % | ± | |
---|---|---|---|---|---|
Conservative | Roger Huxstep | 649 | 44.5 | +0.7 | |
Independent | Andrew Archard | 554 | 38.0 | -11.9 | |
Independent | Stuart Jones | 173 | 11.9 | +11.9 | |
Labour | Patricia Hayward | 82 | 5.6 | -0.7 | |
Majority | 95 | 6.5 | |||
Turnout | 1,458 | 47 | |||
Conservative gain from Independent | Swing | ||||
Party | Candidate | Votes | % | ± | |
---|---|---|---|---|---|
Conservative | Keith Wood | 484 | 62.0 | +13.3 | |
Liberal Democrat | Richard Coleman | 297 | 38.0 | -13.3 | |
Majority | 187 | 24.0 | |||
Turnout | 781 | 52 | |||
Conservative gain from Liberal Democrat | Swing | ||||
Party | Candidate | Votes | % | ± | |
---|---|---|---|---|---|
Conservative | Richard Worrall | 1,350 | 52.7 | +3.7 | |
Liberal Democrat | Allan Mitchell | 1,099 | 42.9 | -1.4 | |
Labour | Adrian Field | 111 | 4.3 | -2.4 | |
Majority | 251 | 9.8 | +5.1 | ||
Turnout | 2,560 | 55 | |||
Conservative gain from Liberal Democrat | Swing | ||||
Party | Candidate | Votes | % | ± | |
---|---|---|---|---|---|
Liberal Democrat | Dominic Hiscock | 978 | 49.4 | +2.8 | |
Conservative | Patrick Cunningham | 869 | 43.9 | +8.9 | |
Labour | Timothy Curran | 133 | 6.7 | -3.4 | |
Majority | 109 | 5.5 | -6.1 | ||
Turnout | 1,980 | 43 | |||
Liberal Democrat hold | Swing |
Party | Candidate | Votes | % | ± | |
---|---|---|---|---|---|
Labour | Chris Pines | 507 | 32.7 | +3.4 | |
Conservative | Michael Lovegrove | 498 | 32.1 | +6.8 | |
Liberal Democrat | Adrian Hicks | 478 | 30.8 | -1.8 | |
Independent | Harold Robbins | 69 | 4.4 | +4.4 | |
Majority | 9 | 0.6 | |||
Turnout | 1,552 | 35 | |||
Labour hold | Swing |
Party | Candidate | Votes | % | ± | |
---|---|---|---|---|---|
Conservative | James Stephens | 614 | 43.1 | +5.9 | |
Liberal Democrat | Simon Hobson | 458 | 32.1 | -10.4 | |
Labour | Patrick Davies | 354 | 24.8 | +4.5 | |
Majority | 156 | 11.0 | |||
Turnout | 1,426 | 35 | |||
Conservative gain from Labour | Swing | ||||
Party | Candidate | Votes | % | ± | |
---|---|---|---|---|---|
Conservative | Ian Tait | 1,240 | 58.7 | +18.0 | |
Liberal Democrat | Susan Chester | 702 | 33.2 | -10.7 | |
Labour | Albert Edwards | 107 | 5.1 | +1.2 | |
UKIP | Judith Napier-Clark | 64 | 3.0 | -4.0 | |
Majority | 538 | 25.5 | |||
Turnout | 2,113 | 47 | |||
Conservative hold | Swing |
Party | Candidate | Votes | % | ± | |
---|---|---|---|---|---|
Liberal Democrat | Raymond Pearce | 845 | 50.4 | -6.0 | |
Conservative | Gillian Allen | 725 | 43.2 | +9.5 | |
Labour | Debra Grech | 108 | 6.4 | -3.5 | |
Majority | 120 | 7.2 | -15.5 | ||
Turnout | 1,678 | 39 | |||
Liberal Democrat hold | Swing |
Party | Candidate | Votes | % | ± | |
---|---|---|---|---|---|
Conservative | Victoria Weston | 1,101 | 56.2 | +0.9 | |
Liberal Democrat | Sheila Campbell | 805 | 41.1 | -0.8 | |
Labour | Dennis May | 52 | 2.7 | -0.1 | |
Majority | 296 | 15.1 | +1.7 | ||
Turnout | 1,958 | 60 | |||
Conservative gain from Liberal Democrat | Swing | ||||
Party | Candidate | Votes | % | ± | |
---|---|---|---|---|---|
Conservative | George Hollingbery | 1,469 | 59.3 | +18.3 | |
Liberal Democrat | Jacqueline Porter | 876 | 35.4 | -7.4 | |
Labour | Robin Atkins | 131 | 5.3 | -1.5 | |
Majority | 593 | 23.9 | |||
Turnout | 2,476 | 51 | |||
Conservative hold | Swing |
Party | Candidate | Votes | % | ± | |
---|---|---|---|---|---|
Conservative | Stephen Godfrey | 1,271 | 65.1 | +7.4 | |
Liberal Democrat | Peter McLoughlin | 604 | 30.9 | -6.9 | |
Labour | Nigel Lickley | 77 | 3.9 | -0.5 | |
Majority | 667 | 34.2 | +14.3 | ||
Turnout | 1,952 | 48 | |||
Conservative hold | Swing |
Elections to Purbeck District Council were held on 1 May 2008. Nine of the twenty-four seats on the council were up for election and the council stayed under no overall control. Overall turnout was 44.86%.
The 2008 St Helens Metropolitan Borough Council election took place on 1 May 2008 to elect members of St Helens Metropolitan Borough Council in Merseyside, England. One third of the council was up for election and the council stayed under no overall control.
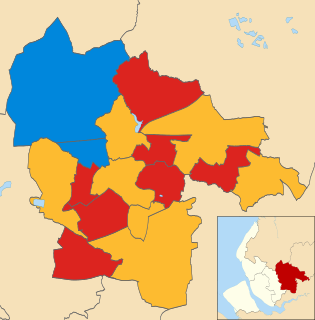
The 2007 St Helens Metropolitan Borough Council election took place on 3 May 2007 to elect members of St Helens Metropolitan Borough Council in Merseyside, England. One third of the council was up for election and the council stayed under no overall control.
The 2007 Hull City Council election took place on 3 May 2007 to elect members of Hull City Council in England. One third of the council was up for election and the Liberal Democrats gained overall control of the council from no overall control. Overall turnout was 27%.
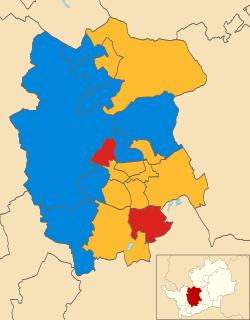
The 2006 St Albans City and District Council election took place on 4 May 2006 to elect members of St Albans District Council in Hertfordshire, England. One third of the council was up for election and the Liberal Democrats gained overall control of the council from no overall control.
The 2010 Winchester Council election took place on 6 May 2010 to elect members of Winchester District Council in Hampshire, England. One third of the council was up for election and the Liberal Democrats gained overall control of the council from the Conservative party.
The 2007 Winchester Council election took place on 3 May 2007 to elect members of Winchester District Council in Hampshire, England. One third of the council was up for election and the Conservative party stayed in overall control of the council.
The 2008 Winchester Council election took place on 1 May 2008 to elect members of Winchester District Council in Hampshire, England. One third of the council was up for election and the Conservative party stayed in overall control of the council.
The 2006 Halton Borough Council election took place on 4 May 2006 to elect members of Halton Unitary Council in Cheshire, England. One third of the council was up for election and the Labour party stayed in overall control of the council.
The 2006 Stratford-on-Avon District Council election took place on 4 May 2006 to elect members of Stratford-on-Avon District Council in Warwickshire, England. One third of the council was up for election and the Conservative party stayed in overall control of the council.
The 2010 West Lancashire Borough Council election took place on 6 May 2010 to elect members of West Lancashire Borough Council in Lancashire, England. One third of the council was up for election and the Conservative party stayed in overall control of the council.
The 2008 Cheltenham Council election took place on 1 May 2008 to elect members of Cheltenham Borough Council in Gloucestershire, England. Half of the council was up for election and the council stayed under no overall control.
The 2006 Sunderland Council election took place on 4 May 2006 to elect members of Sunderland City Council in Tyne and Wear, England. One third of the Council was up for election and the Labour party stayed in overall control.
The 2006 Southampton Council election took place on 4 May 2006 to elect members of Southampton Unitary Council in Hampshire, England. One third of the council was up for election and the council stayed under no overall control.
The 2008 Southampton Council election took place on 1 May 2008 to elect members of Southampton Unitary Council in Hampshire, England. One third of the council was up for election and the Conservative party gained overall control of the council from no overall control.
The 2006 Basingstoke and Deane Council election took place on 4 May 2006 to elect members of Basingstoke and Deane Borough Council in Hampshire, England. One third of the council was up for election and the council stayed under no overall control.
The 2008 Colchester Borough Council election took place on 1 May 2008 to elect members of Colchester Borough Council in Essex, England. One third of the council was up for election and the Conservative party lost overall control of the council to no overall control.
The 2015 Christchurch Borough Council election took place on 7 May 2015 to elect members of Christchurch Borough Council in Dorset, England. The whole council was up for election and the Conservative party stayed in overall control of the council.
Elections to Winchester City Council took place on Thursday 2 May 2019, alongside other local elections across the country. The Conservatives party held a narrow majority of one at the last election, with the seats contested in this election were last contested in 2016 the Conservatives defended 10 seats, whilst the Liberal Democrats defended 4. Town and parish councils in the city boundary were also up for election.
Preceded by Winchester Council election, 2004 | Winchester local elections | Succeeded by Winchester Council election, 2007 |