Cambridge City Council election, 2006

Last updated

Elections for Cambridge City Council were held on Thursday 4 May 2006. As Cambridge City Council is elected by thirds, one seat in each of the city's 14 wards was up for election. The exception was Romsey, where two seats were up for election as a by-election for the other seat was held on the same day. Therefore, 15 of the 42 seats on the Council were up for election. Overall turnout was 34.4%, down from 37.0% in 2004. The lowest turnout (28.4%) was in Abbey ward and the highest (40.8%) in Queen Edith's.

Election process by which a population chooses an individual to hold public office

An election is a formal group decision-making process by which a population chooses an individual to hold public office. Elections have been the usual mechanism by which modern representative democracy has operated since the 17th century. Elections may fill offices in the legislature, sometimes in the executive and judiciary, and for regional and local government. This process is also used in many other private and business organizations, from clubs to voluntary associations and corporations.

Cambridge City and non-metropolitan district in England

Cambridge is a university city and the county town of Cambridgeshire, England, on the River Cam approximately 50 miles (80 km) north of London. At the United Kingdom Census 2011, its population was 123,867 including 24,506 students. Cambridge became an important trading centre during the Roman and Viking ages, and there is archaeological evidence of settlement in the area as early as the Bronze Age. The first town charters were granted in the 12th century, although modern city status was not officially conferred until 1951.

By-elections, also spelled bye-elections, are used to fill elected offices that have become vacant between general elections.

Contents

Results

Cambridge Local Election Result 2006
PartySeatsGainsLossesNet gain/lossSeats %Votes %Votes+/−
  Liberal Democrat 11 1 0 +1 73.3 38.4 11853 -4.8
  Labour 4 1 1 0 26.7 25.4 7837 -2.1
  Conservative 0 0 1 -1 0 22.1 6799 3.0
  Green 0 0 0 0 0 12.7 3908 2.7
  Respect 0 0 0 0 0 1.0 294 N/A
  UKIP 0 0 0 0 0 0.4 138 0.2

The composition of the Council after the election was:

Results by ward

Abbey

PartyCandidateVotes%±
Labour Miriam Lynn 668 37.4
Green Margaret Wright 464 26.0
Conservative Simon Mitton 362 20.3
Liberal Democrat Edward Sexton 292 16.3
Majority 204 11.4
Turnout 1,786 28.5
Labour hold Swing

Arbury

PartyCandidateVotes%±
Liberal Democrat Timothy Ward 1,022 40.3
Labour Michael Todd-Jones 816 32.1
Conservative Shapour Meftah 482 19.0
Green Michael Smith 219 8.6
Majority 206 8.1
Turnout 2,539 36.9
Liberal Democrat hold Swing

Castle

PartyCandidateVotes%±
Liberal Democrat Simon Kightley 985 48.3
Conservative Edward MacNaghten 476 23.3
Green Stephen Lawrence 298 14.6
Labour Lucy Sheerman 282 13.8
Majority 509 24.9
Turnout 2,041 31.5
Liberal Democrat hold Swing

Cherry Hinton

PartyCandidateVotes%±
Labour Stuart Newbold 1,071 42.9
Conservative Eric Barrett-Payton 864 34.6
Liberal Democrat Natalie Mayer-Hutchings 367 14.7
Green Neal Ford 193 7.7
Majority 207 8.3
Turnout 2,495 32.0
Labour gain from Conservative Swing

Coleridge

PartyCandidateVotes%±
Labour Lewis Herbert 909 41.8
Liberal Democrat Andrew Blackhurst 477 22.0
Conservative Stephen Alexander Jones 463 21.3
Green Hamish Downer 186 8.6
UKIP Albert Watts 138 6.4
Majority 432 19.9
Turnout 2,173 36.3
Labour hold Swing

East Chesterton

PartyCandidateVotes%±
Liberal Democrat Marian Holness 884 40.6
Labour Richard Layfield 583 26.8
Conservative Kevin Francis 482 22.1
Green Peter Pope 228 10.5
Majority 301 13.8
Turnout 2,177 35.9
Liberal Democrat hold Swing

King's Hedges

PartyCandidateVotes%±
Liberal Democrat Neale Upstone 718 40.0
Labour Gerri Bird 533 29.7
Conservative Mark Taylor 350 19.5
Green Gerhard Goldbeck-Wood 193 10.8
Majority 185 10.3
Turnout 1,794 29.61
Liberal Democrat gain from Labour Swing

Market

PartyCandidateVotes%±
Liberal Democrat Colin Rosenstiel 772 42.7
Conservative Timothy Haire 392 21.7
Green Martin Lucas-Smith 359 19.9
Labour Maureen Donnelly 285 15.8
Majority 380 21.0
Turnout 1,808 28.7
Liberal Democrat hold Swing

Newnham

PartyCandidateVotes%±
Liberal Democrat Roderick Cantrill 974 46.2
Conservative James Strachan 475 22.6
Labour Joseph Powell 336 16.0
Green Anna Gomori-Woodcock 321 15.2
Majority 499 23.7
Turnout 2,106 31.7
Liberal Democrat hold Swing

Petersfield

PartyCandidateVotes%±
Labour Kevin Blencowe 879 39.0
Liberal Democrat Steven Cooper 848 37.7
Green John Collins 282 12.5
Conservative Rosemary Clarkson 243 10.8
Majority 31 1.4
Turnout 2,252 35.8
Labour hold Swing

Queen Edith's

PartyCandidateVotes%±
Liberal Democrat Alan Baker 1,489 56.7
Conservative Donald Douglas 735 28.0
Labour Leonard Freeman 219 8.3
Green Shayne Mitchell 181 6.9
Majority 754 28.7
Turnout 2,624 40.8
Liberal Democrat hold Swing

Romsey

Note: the top two candidates were elected; vote percentage and swing for parties, not candidates
PartyCandidateVotes%±
Liberal Democrat Sarah Ellis-Miller 1,065Lib Dem
Liberal Democrat Raj Shah 815 41.0
Labour Jonathan Goodacre 623Lab
Labour Tariq Sadiq 491 24.3
Green Jesse Griffiths 358Green
Respect Thomas Woodcock 294Respect
Respect Samuel Caldwell 268 12.3
Conservative Hugh Mennie 235Con
Green Neil Hewett 216 12.5
Conservative Angela Ozturk 216 9.8
Majority 192 8.1
Turnout 2291 36.9
Liberal Democrat hold Swing

Because both seats were up for election each voter had two votes (i.e. plurality-at-large bloc voting). Party vote percentages are calculated as percent of the total number of votes; the number (not the percentage) of turnout has been estimated by halving the total number of votes.

Plurality-at-large voting, also known as block vote or multiple non-transferable vote (MNTV), is a non-proportional voting system for electing several representatives from a single multimember electoral district using a series of check boxes and tallying votes similar to a plurality election. Multiple winners are elected simultaneously to serve the district. Block voting is not a system for obtaining proportional representation; instead the usual result is that where the candidates divide into definitive parties the most popular party in the district sees its full slate of candidates elected, resulting in a landslide.

Trumpington

PartyCandidateVotes%±
Liberal Democrat Sheila Stuart 960 45.5
Conservative John Ionides 752 35.7
Green Ceri Galloway 205 9.7
Labour Pamela Stacey 191 9.1
Majority 208 9.9
Turnout 2,108 39.5
Liberal Democrat hold Swing

West Chesterton

PartyCandidateVotes%±
Liberal Democrat Max Boyce 1,000 42.5
Conservative Steven Mastin 488 20.8
Labour Simon Watkins 442 18.8
Green Sarah Peake 421 17.9
Majority 512 21.8
Turnout 2,351 36.7
Liberal Democrat hold Swing

Sources

See also

Elections in the United Kingdom types of elections in the United Kingdom

There are six types of elections in the United Kingdom: elections to the House of Commons of the United Kingdom, elections to devolved parliaments and assemblies, elections to the European Parliament, local elections, mayoral elections and Police and Crime Commissioner elections. Within each of those categories, there may be by-elections as well as general elections. Elections are held on Election Day, which is conventionally a Thursday. Since the passing of the Fixed-term Parliaments Act 2011 for general elections, all six types of elections are held after fixed periods, though early elections to parliament and the devolved assemblies and parliaments can occur in certain situations. Currently, six electoral systems are used: the single member plurality system, the multi member plurality system, party-list proportional representation, the single transferable vote, the additional member system and the supplementary vote.

Related Research Articles

Elections to Oxford City Council were held on 10 June 2004. The council is elected by halves, so one seat in each ward was up for election. Labour lost majority control of the council but remained in minority administration. Overall turnout was 37.6%, with the lowest turnout (26.5%) in Carfax ward and the highest (49.5%) in Wolvercote.

Elections for Oxford City Council were held on Thursday 4 May 2006. As Oxford City Council is elected by halves, one seat in each of the 24 wards was up for election. The exception was St Clement's, where both seats were up for election as a by-election for the other seat was held on the same day. Therefore, 25 of the 48 seats on the Council were up for election. Overall turnout was 35.8%, down from 37.6% in 2004. The lowest turnout (24.9%) was in Carfax ward and the highest (49.6%) in Marston.

2006 Redbridge London Borough Council election

Elections for London Borough of Redbridge Council were held on Thursday 4 May 2006. The whole council was up for election. Redbridge is split up into 21 wards, each electing 3 councilors, so a total of 63 seats were up for election.

Elections to the Borough Council in Slough, England, were held on 3 May 2007. One third of the council was up for election. This was the 122nd Slough general local authority election since Slough became a local government unit in 1863.

Elections for Oxford City Council were held on Thursday 1 May 2008. As Oxford City Council is elected by halves, one seat in each of the 24 wards is up for election.

2007 Calderdale Metropolitan Borough Council election

Elections to Calderdale Metropolitan Borough Council were held on 3 May 2007 with the exception of the Warley ward which was postponed until 14 June 2007 due to the sudden death of one of the candidates. One third of the council was up for election and the council stayed under no overall control with a minority Conservative administration. The total turnout of the election was 38.01%. The winning candidate in each ward is highlighted in bold.

Elections for Oxford City Council were held on Thursday 6 May 2010. As Oxford City Council is elected by halves, one seat in each of the 24 wards was up for election.

2011 Cambridge City Council election

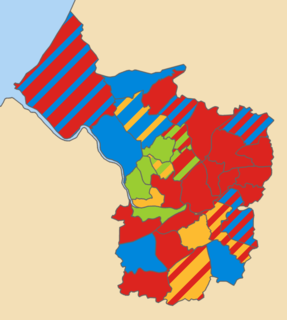
Elections for Cambridge City Council were held on Thursday 5 May 2011. As the council is elected by thirds, one seat in each of the wards was up for election, with the exception of Cherry Hinton ward where two seats were up for election due to the early retirement of Councillor Stuart Newbold. The vote took place alongside the United Kingdom Alternative Vote referendum, 2011 and a Cambridgeshire County Council by-election for Arbury ward.

The 2011 council elections in Guildford saw the Conservatives retain control over Guildford Borough Council with an increased majority of 20 seats. Full results for each ward can be found at Guildford Council election, full results, 2011.

2012 Sheffield City Council election

Sheffield City Council elections took place on Thursday 3 May 2012 as part of the United Kingdom local elections, 2012.

Elections for Oxford City Council were held on Thursday 3 May 2012. As Oxford City Council is elected by halves, one seat in each of the 24 wards is up for election.

Elections to the Charnwood Borough Council took place on 5 May 2011, in line with other local elections in the United Kingdom. A total of 52 councillors were elected from 28 wards as the whole council was up for election.

The 2015 Guildford Borough Council election took place on 7 May 2015 to elect members of Guildford Borough Council in England as one of the 2015 local elections, held simultaneously with the General Election.

2016 Bristol City Council election

The 2016 Bristol City Council election took place on Thursday 5 May 2016, alongside nationwide local elections. Following a boundary review, the number of wards in the City was reduced to 34, with each electing one, two or three Councillors. The overall number of Councillors remained 70, with all seats are up for election at the same time. Elections would then be held every 4 years.

2007 Mid Bedfordshire District Council election

Elections to Mid Bedfordshire District Council were held in May 2007. These were the last elections to council, with all 53 seats being up for election. Councillors elected would serve a two-year term, expiring in 2009, when Mid Bedfordshire District Council was replaced by Central Bedfordshire Council. The Conservative Party retained overall control of the council, winning 37 of 53 seats on the council. The Conservatives won 8 seats unopposed, as did an Independent candidate in one ward.

2003 Mid Bedfordshire District Council election

Elections to Mid Bedfordshire District Council were held on 1 May 2003. All 53 seats were up for election. Councillors elected would serve a four-year term, expiring in 2007. The Conservative Party retained overall control of the council, winning 37 of 53 seats on the council. The Conservatives won 7 seats unopposed.

1999 Mid Bedfordshire District Council election

Elections to Mid Bedfordshire District Council were held on 6 May 1999. All 53 seats were up for election. The Conservative Party gained overall control of the council, increasing their number of seats from 22 to 34, whilst the Labour Party declined from having 20 seats in 1995 to 7.

1995 Mid Bedfordshire District Council election

Elections to Mid Bedfordshire District Council were held on 4 May 1995. All 53 seats were up for election.

1979 Mid Bedfordshire District Council election


Elections to Mid Bedfordshire District Council were held on 3 May 1979, on the same day as the general election, so turnout was higher than usual in district council elections for Mid Bedfordshire. All 53 seats were up for election.

2018 Leeds City Council election

The 2018 Leeds City Council election took place on 3 May 2018 to elect members of Leeds City Council in England. They were held on the same day as other local elections across England and the rest of the UK.