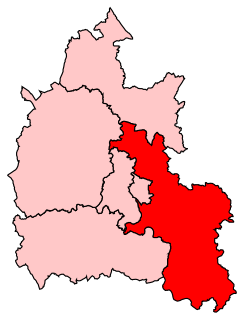
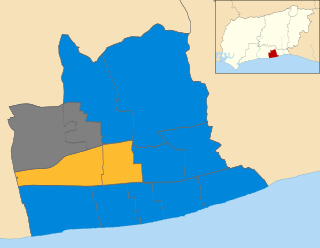
The 2007 Cherwell District Council election took place on 3 May 2007 to elect members of Cherwell District Council in Oxfordshire, England. One third of the council was up for election and the Conservative party stayed in overall control of the council. [1]
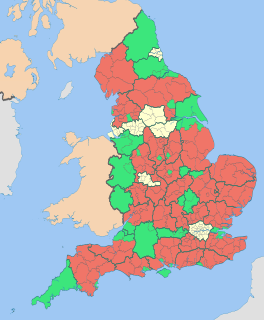
Non-metropolitan districts, or colloquially "shire districts", are a type of local government district in England. As created, they are sub-divisions of non-metropolitan counties in a two-tier arrangement.
Oxfordshire is a county in South East England. The ceremonial county borders Warwickshire to the north-west, Northamptonshire to the north-east, Buckinghamshire to the east, Berkshire to the south, Wiltshire to the south-west and Gloucestershire to the west.
The Conservative Party, officially the Conservative and Unionist Party, is a centre-right political party in the United Kingdom. Presently led by Theresa May, it has been the governing party since 2010. It presently has 314 Members of Parliament in the House of Commons, 249 members of the House of Lords, and 18 members of the European Parliament. It also has 31 Members of the Scottish Parliament, 12 members of the Welsh Assembly, eight members of the London Assembly and 9,008 local councillors. One of the major parties of UK politics, it has formed the government on 45 occasions, more than any other party.
In all 16 seats were contested with one independent candidate, David Chapman, standing in Ambrosden and Chesterton ward after resigning from the Conservative party in protest at plans to build 1,585 houses near Bicester. [2] [3] The results saw the Conservatives strengthen their control of the council going from 39 to 42 seats. [4] They gained three seats from Labour in Banbury Ruscote, Kidlington South and Yarnton, Gosford and Water Eaton wards. [5] Consequently, Labour only managed to hold on to one of their seats in Bicester West. [5] The Conservatives also gained one seat from the Liberal Democrats in The Astons and Heyfords, but lost Bicester South back to them by one vote. [5] The results meant that Labour and the Liberal Democrats only had 4 seats each in opposition on the council. [4]
Ambrosden is a village and civil parish in Cherwell, Oxfordshire, England, 3 miles (5 km) southwest of Bicester to which it is linked by the A41 road, and 13 miles (21 km) from Oxford. The 2011 Census recorded the parish's population as 2,248. The parish is bounded by the River Ray to the south, its tributary the River Bure to the west, the outskirts of Bicester to the north and field boundaries to the east.
Chesterton is a village and civil parish on Gagle Brook, a tributary of the Langford Brook in north Oxfordshire. The village is about 1 1⁄2 miles (2.4 km) southwest of the market town of Bicester. The village has sometimes been called Great Chesterton to distinguish it from the hamlet of Little Chesterton, about 3⁄4 mile (1.2 km) to the south in the same parish. The 2011 Census recorded the parish population as 850.
Bicester is a town and civil parish in the Cherwell district of northeastern Oxfordshire in England.
After the election, the composition of the council was
Party | Seats | Gains | Losses | Net gain/loss | Seats % | Votes % | Votes | +/− | |
---|---|---|---|---|---|---|---|---|---|
Conservative | 13 | 4 | 1 | +3 | 81.3 | 57.0 | 13,112 | -3.2% | |
Liberal Democrat | 2 | 1 | 1 | 0 | 12.5 | 20.5 | 4,717 | -4.3% | |
Labour | 1 | 0 | 3 | -3 | 6.3 | 18.9 | 4,356 | +4.6% | |
UKIP | 0 | 0 | 0 | 0 | 0 | 1.9 | 438 | +1.9% | |
Independent | 0 | 0 | 0 | 0 | 0 | 1.6 | 376 | +1.6% |
Party | Candidate | Votes | % | ± | |
---|---|---|---|---|---|
Conservative | Andrew Fulljames | 435 | 48.3 | -25.3 | |
Independent | David Chapman | 376 | 41.7 | +41.7 | |
Liberal Democrat | Neil Walton | 90 | 10.0 | -16.4 | |
Majority | 59 | 6.6 | -40.6 | ||
Turnout | 901 | 37.0 | |||
Conservative hold | Swing |
Party | Candidate | Votes | % | ± | |
---|---|---|---|---|---|
Conservative | Nigel Morris | 1,240 | 61.1 | -3.0 | |
Labour | Bruce Lucas | 396 | 19.5 | +1.5 | |
Liberal Democrat | Bruce Shakespeare | 216 | 10.6 | -7.3 | |
UKIP | Lynne Shawyer | 178 | 8.8 | +8.8 | |
Majority | 844 | 41.6 | -4.5 | ||
Turnout | 2,030 | 34.7 | |||
Conservative hold | Swing |
Party | Candidate | Votes | % | ± | |
---|---|---|---|---|---|
Conservative | Christopher Smithson | 1,015 | 61.7 | +11.5 | |
Labour | Henry Goodman | 631 | 38.3 | +8.0 | |
Majority | 384 | 23.4 | +3.5 | ||
Turnout | 1,646 | 25.5 | |||
Conservative hold | Swing |
Party | Candidate | Votes | % | ± | |
---|---|---|---|---|---|
Conservative | Nicholas Turner | 841 | 61.6 | +1.7 | |
Labour | Roy Mold | 249 | 18.2 | -8.1 | |
Liberal Democrat | John Willett | 146 | 10.7 | -3.2 | |
UKIP | John Brown | 130 | 9.5 | +9.5 | |
Majority | 592 | 43.4 | +9.8 | ||
Turnout | 1,366 | 24.0 | |||
Conservative hold | Swing |
Party | Candidate | Votes | % | ± | |
---|---|---|---|---|---|
Conservative | Keith Strangwood | 764 | 49.1 | +10.6 | |
Labour | Martin Weir | 569 | 36.6 | -14.9 | |
UKIP | Mark Clifton | 130 | 8.4 | +8.4 | |
Liberal Democrat | Andrew Murray | 92 | 5.9 | -4.1 | |
Majority | 195 | 12.5 | |||
Turnout | 1,555 | 27.0 | |||
Conservative gain from Labour | Swing | ||||
Party | Candidate | Votes | % | ± | |
---|---|---|---|---|---|
Conservative | Rose Stratford | 773 | 60.2 | +4.6 | |
Labour | John Broad | 319 | 24.8 | -19.6 | |
Liberal Democrat | Martin Chadwick | 192 | 15.0 | +15.0 | |
Majority | 454 | 35.4 | +24.2 | ||
Turnout | 1,284 | 29.5 | |||
Conservative gain from Labour | Swing | ||||
Party | Candidate | Votes | % | ± | |
---|---|---|---|---|---|
Conservative | Carol Steward | 881 | 71.0 | +6.8 | |
Liberal Democrat | Stephen Creed | 187 | 15.1 | -20.7 | |
Labour | Chris Bream | 172 | 13.9 | +13.9 | |
Majority | 694 | 55.9 | +27.5 | ||
Turnout | 1,240 | 25.5 | |||
Conservative hold | Swing |
Party | Candidate | Votes | % | ± | |
---|---|---|---|---|---|
Liberal Democrat | Nicholas Cotter | 600 | 50.0 | +5.0 | |
Conservative | Lawrie Stratford | 599 | 50.0 | -5.0 | |
Majority | 1 | 0.1 | |||
Turnout | 1,199 | 32.3 | |||
Liberal Democrat gain from Conservative | Swing | ||||
Party | Candidate | Votes | % | ± | |
---|---|---|---|---|---|
Conservative | Diana Edwards | 698 | 58.5 | -4.8 | |
Labour | Claudine Thompson | 276 | 23.1 | -13.6 | |
Liberal Democrat | Liz Yardley | 220 | 18.4 | +18.4 | |
Majority | 422 | 35.4 | +8.8 | ||
Turnout | 1,194 | 30.3 | |||
Conservative hold | Swing |
Party | Candidate | Votes | % | ± | |
---|---|---|---|---|---|
Labour | Leslie Sibley | 1,069 | 53.0 | +22.5 | |
Conservative | Adam Collyer | 949 | 47.0 | -22.5 | |
Majority | 120 | 6.0 | |||
Turnout | 2,018 | 36.1 | |||
Labour hold | Swing |
Party | Candidate | Votes | % | ± | |
---|---|---|---|---|---|
Conservative | Ken Atack | 851 | 76.3 | +2.0 | |
Liberal Democrat | Anthony Burns | 264 | 23.7 | -2.0 | |
Majority | 587 | 52.6 | +4.0 | ||
Turnout | 1,115 | 51.0 | |||
Conservative hold | Swing |
Party | Candidate | Votes | % | ± | |
---|---|---|---|---|---|
Conservative | Victoria Irvine | 610 | 71.7 | -5.9 | |
Liberal Democrat | Peter Davis | 241 | 28.3 | +5.9 | |
Majority | 369 | 43.4 | -11.8 | ||
Turnout | 851 | 41.8 | |||
Conservative hold | Swing |
Party | Candidate | Votes | % | ± | |
---|---|---|---|---|---|
Liberal Democrat | John Wyse | 711 | 50.2 | -9.5 | |
Conservative | Michael Hunt | 549 | 38.8 | -1.5 | |
Labour | Martin Keighery | 155 | 11.0 | +11.0 | |
Majority | 162 | 11.4 | -8.0 | ||
Turnout | 1,415 | 34.0 | |||
Liberal Democrat hold | Swing |
Party | Candidate | Votes | % | ± | |
---|---|---|---|---|---|
Conservative | Neil Prestidge | 1,008 | 44.3 | +9.8 | |
Liberal Democrat | Philip Rawlins | 749 | 32.9 | -11.7 | |
Labour | Catherine Arakelian | 520 | 22.8 | +7.9 | |
Majority | 259 | 11.4 | |||
Turnout | 2,277 | 35.7 | |||
Conservative gain from Labour | Swing | ||||
Party | Candidate | Votes | % | ± | |
---|---|---|---|---|---|
Conservative | Luke Annaly | 960 | 61.6 | -11.6 | |
Liberal Democrat | Richard Makepeace | 598 | 38.4 | +11.6 | |
Majority | 362 | 23.2 | -21.2 | ||
Turnout | 1,558 | 41.5 | |||
Conservative gain from Liberal Democrat | Swing | ||||
Party | Candidate | Votes | % | ± | |
---|---|---|---|---|---|
Conservative | Michael Gibbard | 939 | 69.6 | +22.4 | |
Liberal Democrat | Suzanne Wilson-Higgins | 411 | 30.4 | -13.0 | |
Majority | 528 | 39.2 | +35.4 | ||
Turnout | 1,350 | 36.5 | |||
Conservative hold | Swing |
Henley is a constituency in Oxfordshire represented in the House of Commons of the UK Parliament since 2008 by John Howell, a member of the Conservative Party.
Banbury is a constituency in Oxfordshire created in 1553 and represented in the House of Commons of the UK Parliament since 2015 by Victoria Prentis of the Conservative Party. The constituency is occasionally, but erroneously, referred to as the North Oxfordshire constituency.
The 2007 Worthing Borough Council election took place on 3 May 2007 to elect members of Worthing Borough Council in West Sussex, England. One third of the council was up for election and the Conservative party stayed in overall control of the council.
The 1998 Cherwell District Council election took place on 7 May 1998 to elect members of Cherwell District Council in Oxfordshire, England. One third of the council was up for election and the council stayed under no overall control.
The 1999 Cherwell District Council election took place on 6 May 1999 to elect members of Cherwell District Council in Oxfordshire, England. One third of the council was up for election and the council stayed under no overall control.
The 2000 Cherwell District Council election took place on 4 May 2000 to elect members of Cherwell District Council in Oxfordshire, England. One third of the council was up for election and the Conservative party gained overall control of the council from no overall control.
The 2002 Cherwell District Council election took place on 2 May 2002 to elect members of Cherwell District Council in Oxfordshire, England. The whole council was up for election with boundary changes since the last election in 2000 reducing the number of seats by 2. The Conservative party stayed in overall control of the council.
The 2003 Cherwell District Council election took place on 1 May 2003 to elect members of Cherwell District Council in Oxfordshire, England. One third of the council was up for election and the Conservative party stayed in overall control of the council.
The 2006 Cherwell District Council election took place on 4 May 2006 to elect members of Cherwell District Council in Oxfordshire, England. One third of the council was up for election and the Conservative party stayed in overall control of the council.
The 2008 Cherwell District Council election took place on 1 May 2008 to elect members of Cherwell District Council in Oxfordshire, England. One third of the council was up for election and the Conservative party stayed in overall control of the council.
The 2004 Wyre Forest District Council election took place on 10 June 2004 to elect members of Wyre Forest District Council in Worcestershire, England. The whole council was up for election with boundary changes since the last election in 2003. The council stayed under no overall control, but with the Conservatives taking over as the largest party on the council from the Health Concern party.
The 2003 Solihull Metropolitan Borough Council election took place on 1 May 2003 to elect members of Solihull Metropolitan Borough Council in the West Midlands, England. One third of the council was up for election and the Conservative party stayed in overall control of the council.
The 2007 Sandwell Metropolitan Borough Council election took place on 3 May 2007 to elect members of Sandwell Metropolitan Borough Council in the West Midlands, England. One third of the council was up for election and the Labour party stayed in overall control of the council.
The 2008 Sandwell Metropolitan Borough Council election took place on 1 May 2008 to elect members of Sandwell Metropolitan Borough Council in the West Midlands, England. One third of the council was up for election and the Labour party stayed in overall control of the council.
The 2011 Cherwell District Council election took place on 5 May 2011 to elect members of Cherwell District Council in Oxfordshire, England. One third of the council was up for election and the Conservative party stayed in overall control of the council.
The 2007 West Oxfordshire District Council election took place on 3 May 2007 to elect members of West Oxfordshire District Council in Oxfordshire, England. One third of the council was up for election and the Conservative party stayed in overall control of the council.
The 2014 West Oxfordshire District Council election took place on 22 May 2014 to elect members of West Oxfordshire District Council in Oxfordshire, England. One third of the council was up for election and the Conservative party stayed in overall control of the council.
The 2015 West Oxfordshire District Council election took place on 22 May 2015 to elect members of West Oxfordshire District Council in Oxfordshire, England. One third of the council was up for election and the Conservative party stayed in overall control of the council.
The 2018 Cherwell District Council election was held on 3 May 2018 to elect members of Cherwell District Council in England. This was on the same day as other local elections.