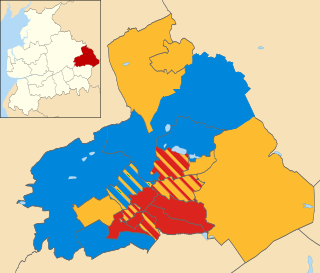
Elections to Burnley Borough Council in Lancashire, England were held on 1 May 2008. One third of the council was up for election and the Liberal Democrat party gained overall control of the council from no overall control.
Lancashire is a ceremonial county in North West England. The administrative centre is Preston. The county has a population of 1,449,300 and an area of 1,189 square miles (3,080 km2). People from Lancashire are known as Lancastrians.
England is a country that is part of the United Kingdom. It shares land borders with Wales to the west and Scotland to the north-northwest. The Irish Sea lies west of England and the Celtic Sea lies to the southwest. England is separated from continental Europe by the North Sea to the east and the English Channel to the south. The country covers five-eighths of the island of Great Britain, which lies in the North Atlantic, and includes over 100 smaller islands, such as the Isles of Scilly and the Isle of Wight.
The Liberal Democrats are a liberal political party in the United Kingdom. They presently have 11 Members of Parliament in the House of Commons, 96 members of the House of Lords, and one member of the European Parliament. They also have five Members of the Scottish Parliament and a member each in the Welsh Assembly and London Assembly. The party reached the height of its influence in the early 2010s, forming a junior partner in a coalition government from 2010 to 2015. It is presently led by Vince Cable.
Police launched an investigation on the day of the election into a fake Liberal Democrat leaflet which was distributed in Rosegrove and Gannow wards. [1] Following the election the Labour group leader Andy Tatchell was replaced by Julie Cooper. [2]
After the election, the composition of the council was
The Labour Party is a centre-left political party in the United Kingdom which has been described as an alliance of social democrats, democratic socialists and trade unionists. The party's platform emphasises greater state intervention, social justice and strengthening workers' rights.
The Conservative Party, officially the Conservative and Unionist Party, is a centre-right political party in the United Kingdom. Presently led by Theresa May, it has been the governing party since 2010. It presently has 314 Members of Parliament in the House of Commons, 249 members of the House of Lords, and 18 members of the European Parliament. It also has 31 Members of the Scottish Parliament, 12 members of the Welsh Assembly, eight members of the London Assembly and 9,008 local councillors. One of the major parties of UK politics, it has formed the government on 45 occasions, more than any other party.
The British National Party (BNP) is a far-right, fascist political party in the United Kingdom. It is headquartered in Wigton, Cumbria, and its current leader is Adam Walker. A minor party, it has no elected representatives at any level of UK government. Founded in 1982, the party reached its greatest level of success in the 2000s, when it had over fifty seats in local government, one seat on the London Assembly, and two Members of the European Parliament.
Party | Seats | Gains | Losses | Net gain/loss | Seats % | Votes % | Votes | +/− | |
---|---|---|---|---|---|---|---|---|---|
Liberal Democrat | 9 | 5 | 0 | +5 | 60.0 | 37.3 | 9,156 | +3.1 | |
Labour | 3 | 0 | 5 | -5 | 20.0 | 27.8 | 6,833 | +0.5 | |
Conservative | 2 | 0 | 0 | 0 | 13.3 | 18.9 | 4,648 | +3.5 | |
BNP | 1 | 0 | 0 | 0 | 6.7 | 14.9 | 3,650 | -2.6 | |
England First | 0 | 0 | 0 | 0 | 0 | 1.0 | 254 | -2.1 | |
Party | Candidate | Votes | % | ± | |
---|---|---|---|---|---|
Labour | Julie Cooper | 621 | 43.5 | -3.4 | |
Liberal Democrat | Asif Raja | 571 | 40.0 | -0.8 | |
Conservative | Paul Coates | 237 | 16.6 | +4.3 | |
Majority | 50 | 3.5 | -2.6 | ||
Turnout | 1,429 | 33.9 | |||
Labour hold | Swing | ||||
Party | Candidate | Votes | % | ± | |
---|---|---|---|---|---|
Liberal Democrat | Margaret Lishman | 912 | 55.5 | -3.2 | |
BNP | Patricia Thomson | 326 | 19.9 | -8.2 | |
Conservative | Susan Nutter | 219 | 13.3 | +7.0 | |
Labour | Laurence Embley | 185 | 11.3 | +1.2 | |
Majority | 586 | 35.6 | +5.1 | ||
Turnout | 1,642 | 35.7 | |||
Liberal Democrat hold | Swing | ||||
Party | Candidate | Votes | % | ± | |
---|---|---|---|---|---|
Liberal Democrat | Linda White | 633 | 37.2 | -0.9 | |
Labour | David Halsall | 451 | 26.5 | -1.5 | |
BNP | Paul McDevitt | 384 | 22.6 | -3.6 | |
Conservative | Arthur Coates | 233 | 13.7 | +6.0 | |
Majority | 182 | 10.7 | +0.1 | ||
Turnout | 1,701 | 34.1 | |||
Liberal Democrat gain from Labour | Swing | ||||
Party | Candidate | Votes | % | ± | |
---|---|---|---|---|---|
Conservative | Michael Heys | 923 | 45.6 | +7.6 | |
Liberal Democrat | Paula Riley | 486 | 24.0 | +14.4 | |
England First | Steven Smith | 254 | 12.5 | -4.3 | |
Labour | Brenda Lambert | 214 | 10.6 | +0.4 | |
BNP | Ben Smalley | 149 | 7.4 | -4.4 | |
Majority | 437 | 21.6 | +0.4 | ||
Turnout | 2,026 | 46.2 | |||
Conservative hold | Swing | ||||
Party | Candidate | Votes | % | ± | |
---|---|---|---|---|---|
Liberal Democrat | Charles Bullas | 953 | 66.6 | -13.3 | |
BNP | Scott Atkinson | 274 | 19.1 | +19.1 | |
Labour | Joanne Whitaker | 205 | 14.3 | -5.8 | |
Majority | 679 | 47.5 | -12.3 | ||
Turnout | 1,432 | 35.0 | |||
Liberal Democrat hold | Swing | ||||
Party | Candidate | Votes | % | ± | |
---|---|---|---|---|---|
Liberal Democrat | Mohammed Malik | 1,234 | 52.4 | +12.4 | |
Labour | Shah Hussain | 1,123 | 47.6 | -12.4 | |
Majority | 111 | 4.8 | |||
Turnout | 2,357 | 60.4 | |||
Liberal Democrat gain from Labour | Swing | ||||
Party | Candidate | Votes | % | ± | |
---|---|---|---|---|---|
Liberal Democrat | Justin Birtwistle | 544 | 33.7 | +0.7 | |
BNP | John Cave | 473 | 29.3 | +0.8 | |
Labour | Mark Townsend | 386 | 23.9 | -2.4 | |
Conservative | Sharon Everitt | 212 | 13.1 | +0.9 | |
Majority | 71 | 4.4 | -0.1 | ||
Turnout | 1,615 | 36.9 | |||
Liberal Democrat gain from Labour | Swing | ||||
Party | Candidate | Votes | % | ± | |
---|---|---|---|---|---|
Labour | Andy Tatchell | 727 | 50.0 | -3.1 | |
BNP | Christopher Vanns | 289 | 19.9 | -5.3 | |
Conservative | Barry Robinson | 284 | 19.5 | +7.0 | |
Liberal Democrat | Denise Embra | 154 | 10.6 | +1.4 | |
Majority | 438 | 30.1 | +2.2 | ||
Turnout | 1,454 | 31.1 | |||
Labour hold | Swing | ||||
Party | Candidate | Votes | % | ± | |
---|---|---|---|---|---|
BNP | Sharon Wilkinson | 674 | 38.6 | +0.9 | |
Labour | Jean Cunningham | 586 | 33.6 | +3.2 | |
Conservative | Alan Marsden | 323 | 18.5 | +3.4 | |
Liberal Democrat | Vincent McCrae | 162 | 9.3 | -7.4 | |
Majority | 78 | 5.0 | -2.3 | ||
Turnout | 1,745 | 37.5 | |||
BNP hold | Swing | ||||
Party | Candidate | Votes | % | ± | |
---|---|---|---|---|---|
Liberal Democrat | Bill Brindle | 852 | 56.1 | +13.5 | |
Labour | Peter Kenyon | 357 | 23.5 | -1.0 | |
Conservative | Michael Raistrick | 309 | 20.4 | +7.8 | |
Majority | 495 | 32.6 | +14.4 | ||
Turnout | 1,518 | 33.5 | |||
Liberal Democrat hold | Swing | ||||
Party | Candidate | Votes | % | ± | |
---|---|---|---|---|---|
Liberal Democrat | Bill Bennett | 740 | 47.2 | +15.7 | |
Labour | Abid Sharif | 571 | 36.4 | +8.6 | |
Conservative | Brent Whittam | 256 | 16.3 | +1.2 | |
Majority | 169 | 10.8 | +7.1 | ||
Turnout | 1,567 | 37.1 | |||
Liberal Democrat hold | Swing | ||||
Party | Candidate | Votes | % | ± | |
---|---|---|---|---|---|
Liberal Democrat | Lynne Briggs | 637 | 40.2 | +11.9 | |
BNP | John Rowe | 491 | 31.0 | +0.3 | |
Labour | Marion Smith | 293 | 18.5 | -12.2 | |
Conservative | Peter Raistrick | 164 | 10.3 | +0.0 | |
Majority | 146 | 9.2 | |||
Turnout | 1,585 | 33.6 | |||
Liberal Democrat gain from Labour | Swing | ||||
Party | Candidate | Votes | % | ± | |
---|---|---|---|---|---|
Liberal Democrat | Karen Heseltine | 742 | 52.6 | +17.1 | |
Labour | Colette Bailey | 353 | 25.0 | -4.0 | |
Conservative | David Tierney | 316 | 22.4 | +5.8 | |
Majority | 389 | 27.6 | +21.2 | ||
Turnout | 1,411 | 31.4 | |||
Liberal Democrat gain from Labour | Swing | ||||
Party | Candidate | Votes | % | ± | |
---|---|---|---|---|---|
Labour | Tony Lambert | 497 | 42.4 | +2.6 | |
BNP | David Shapcott | 283 | 24.2 | -4.4 | |
Liberal Democrat | Martyn Hurt | 244 | 20.8 | -3.3 | |
Conservative | Thomas Picton | 147 | 12.6 | +5.1 | |
Majority | 214 | 18.2 | +7.0 | ||
Turnout | 1,171 | 30.0 | |||
Labour hold | Swing | ||||
Party | Candidate | Votes | % | ± | |
---|---|---|---|---|---|
Conservative | Peter Doyle | 1,025 | 54.3 | +0.8 | |
BNP | Joan Shapcott | 307 | 16.3 | +0.0 | |
Liberal Democrat | Michael McHugh | 292 | 15.5 | +1.5 | |
Labour | Angela Donovan | 264 | 14.0 | -2.2 | |
Majority | 718 | 38.0 | |||
Turnout | 1,888 | 38.7 | +1.6 | ||
Conservative hold | Swing | ||||
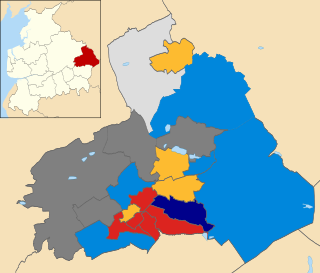
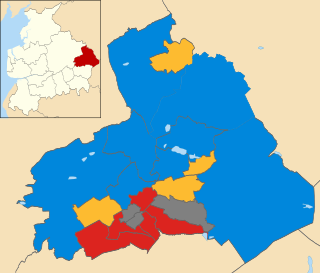
Elections to Rossendale Borough Council were held on 1 May 2008. One third of the council was up for election and the Conservative party gained overall control of the council from no overall control. Overall turnout was up by one per cent from the last election in 2007 at 36.3%.
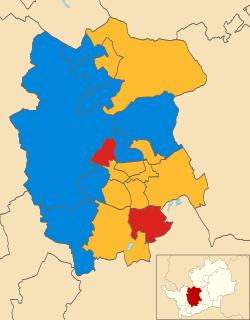
The 2006 St Albans City and District Council election took place on 4 May 2006 to elect members of St Albans District Council in Hertfordshire, England. One third of the council was up for election and the Liberal Democrats gained overall control of the council from no overall control.
The 1998 Burnley Borough Council election took place on 7 May 1998 to elect members of Burnley Borough Council in Lancashire, England. One third of the council was up for election and the Labour party stayed in overall control of the council.
The 1999 Burnley Borough Council election took place on 6 May 1999 to elect members of Burnley Borough Council in Lancashire, England. One third of the council was up for election and the Labour party stayed in overall control of the council.
The 2000 Burnley Borough Council election took place on 4 May 2000 to elect members of Burnley Borough Council in Lancashire, England. One third of the council was up for election and the Labour party lost overall control of the council to no overall control.
The 2010 Rossendale Borough Council election took place on 6 May 2010 to elect members of Rossendale Borough Council in Lancashire, England. One third of the council was up for election and the Conservative party stayed in overall control of the council.
Elections to Burnley Borough Council in Lancashire, England were held on 6 May 2010. One-third of the council was up for election plus a by-election in the Queensgate ward following the death of Liberal Democrat councillor Bill Bennett. The Liberal Democrat party retained overall control of the council.
Elections to Burnley Borough Council in Lancashire, England were held on 4 May 2006. One third of the council was up for election, with by-elections in the Bank Hall and Brunshaw wards. The by-elections followed the resignations of Labour councillor Caroline Kavanagh and (Brunshaw) BNP-turned-independent-with-links-to-Labour councillor Maureen Stowe. No party won overall control of the council.
The 1998 Pendle Borough Council election took place on 7 May 1998 to elect members of Pendle Borough Council in Lancashire, England. One third of the council was up for election and the Liberal Democrats stayed in overall control of the council.
The 1999 Pendle Borough Council election took place on 6 May 1999 to elect members of Pendle Borough Council in Lancashire, England. One third of the council was up for election and the Liberal Democrats lost overall control of the council to no overall control.
The 2002 Pendle Borough Council election took place on 2 May 2002 to elect members of Pendle Borough Council in Lancashire, England. The whole council was up for election with boundary changes since the last election in 2000 reducing the number of seats by 2. The council stayed under no overall control.
The 2003 Pendle Borough Council election took place on 1 May 2003 to elect members of Pendle Borough Council in Lancashire, England. One third of the council was up for election and the council stayed under no overall control.
The 2004 Pendle Borough Council election took place on 10 June 2004 to elect members of Pendle Borough Council in Lancashire, England. One third of the council was up for election and the Liberal Democrats gained overall control of the council from no overall control.
The 2006 Pendle Borough Council election took place on 4 May 2006 to elect members of Pendle Borough Council in Lancashire, England. One third of the council was up for election and the Liberal Democrats stayed in overall control of the council.
The 2007 Pendle Borough Council election took place on 3 May 2007 to elect members of Pendle Borough Council in Lancashire, England. One third of the council was up for election and the Liberal Democrats stayed in overall control of the council.
The 2008 Pendle Borough Council election took place on 1 May 2008 to elect members of Pendle Borough Council in Lancashire, England. One third of the council was up for election and the Liberal Democrats lost overall control of the council to no overall control.
The 2010 Pendle Borough Council election took place on 6 May 2010 to elect members of Pendle Borough Council in Lancashire, England. One third of the council was up for election and the council stayed under no overall control.
The 2011 Pendle Borough Council election took place on 5 May 2011 to elect members of Pendle Borough Council in Lancashire, England. One third of the council was up for election and the council stayed under no overall control.
The 2012 Pendle Borough Council election took place on 3 May 2012 to elect members of Pendle Borough Council in Lancashire, England. One third of the council was up for election and the council stayed under no overall control.
The 2014 Pendle Borough Council election took place on 22 May 2014 to elect members of Pendle Borough Council in Lancashire, England. One third of the council was up for election and the council stayed under no overall control.