Blackpool Borough Council election, 2011

Last updated

Blackpool Council election, 2011
Flag of the United Kingdom.svg
  2007 5 May 2011 2015  

All 42 council seats
Turnout 37.41%

  First party Second party
 
Leader Simon Blackburn Peter Callow
Party Labour Conservative
Leader since 2009
Last election 12 seats, 34.4% 27 seats, 47.3%
Seats won27 14
Seat changeIncrease2.svg15Decrease2.svg13
Popular vote38,828 32,024
Percentage50.2% 41.4%
SwingIncrease2.svg15.8%Decrease2.svg5.9%

Leader of Largest Party before election

Peter Callow
Conservative

Subsequent Leader of Largest Party

Simon Blackburn
Labour

Map of results of 2011 election Blackpool Council election 2011 map.svg
Map of results of 2011 election

The 2011 Blackpool Borough Council election took place on 5 May 2011 to elect members of the unitary Blackpool Borough Council in England. The whole council was up for election and the Labour party gained overall control of the council from the Conservative party. [1]

Unitary authorities of England top and only level of local government in some parts of England

Unitary authorities of England are local authorities that are responsible for the provision of all local government services within a district. They are constituted under the Local Government Act 1992, which amended the Local Government Act 1972 to allow the existence of counties that do not have multiple districts. They typically allow large towns to have separate local authorities from the less urbanised parts of their counties and provide a single authority for small counties where division into districts would be impractical. Unitary authorities do not cover all of England. Most were established during the 1990s and a further tranche were created in 2009. Unitary authorities have the powers and functions that are elsewhere separately administered by councils of non-metropolitan counties and the non-metropolitan districts within them.

England Country in north-west Europe, part of the United Kingdom

England is a country that is part of the United Kingdom. It shares land borders with Wales to the west and Scotland to the north-northwest. The Irish Sea lies west of England and the Celtic Sea lies to the southwest. England is separated from continental Europe by the North Sea to the east and the English Channel to the south. The country covers five-eighths of the island of Great Britain, which lies in the North Atlantic, and includes over 100 smaller islands, such as the Isles of Scilly and the Isle of Wight.

The Labour Party is a centre-left political party in the United Kingdom which has been described as an alliance of social democrats, democratic socialists and trade unionists. The party's platform emphasises greater state intervention, social justice and strengthening workers' rights.

Contents

Election result

The results saw Blackpool Labour gain 15 seats to take control from the Conservatives. [2] Conservative councillors who lost seats included the deputy leader of the party Ian Fowler and the cabinet member for education, Peter Collins. [3] Meanwhile, the Liberal Democrats were reduced to just one councillor, Douglas Green. [3] Overall turnout at the election was 37.41%. [4]

A Councillor is a member of a local government council.

Liberal Democrats (UK) Political party in the United Kingdom

The Liberal Democrats are a liberal political party in the United Kingdom. They presently have 11 Members of Parliament in the House of Commons, 96 members of the House of Lords, and one member of the European Parliament. They also have five Members of the Scottish Parliament and a member each in the Welsh Assembly and London Assembly. The party reached the height of its influence in the early 2010s, forming a junior partner in a coalition government from 2010 to 2015. It is presently led by Vince Cable.

Voter turnout percentage of eligible voters who cast a ballot in an election

Voter turnout is the percentage of eligible voters who cast a ballot in an election. Eligibility varies by country, and the voting-eligible population should not be confused with the total adult population. Age and citizenship status are often among the criteria used to determine eligibility, but some countries further restrict eligibility based on sex, race, or religion.

The Conservative leader of the council Peter Callow said the Labour result was "well-earned" and that cuts made by the national government were to blame for the Conservative losses. [2] Meanwhile, the Labour leader Simon Blackburn called the result "very pleasing, but not unexpected". [2]

Blackpool Local Election Result 2011 [5]
PartySeatsGainsLossesNet gain/lossSeats %Votes %Votes+/−
  Labour 27 15 0 +15 64.3 50.2 38,828 +15.8%
  Conservative 14 1 14 -13 33.3 41.4 32,024 -5.9%
  Liberal Democrat 1 0 2 -2 2.4 5.2 4,010 -8.7%
  UKIP 0 0 0 0 0 2.0 1,511 +1.5%
  Independent 0 0 0 0 0 1.1 861 +0.8%
  Green 0 0 0 0 0 0.1 112 +0.1%

Ward results

Ancorsholme

Anchorsholme (2) [5]
PartyCandidateVotes%±
Conservative Tony Williams1,20225.49%+6.18%
Conservative Paul Galley1,10723.47%+4.95%
Labour Danny Bradford 970 20.57% +7.05%
Labour Rosemary Southern 883 18.72% +4.49%
Liberal Democrat Jon Bamborough 318 6.74% -11.37%
Liberal Democrat Gill Jackson 236 5.00% -11.30%
Turnout 47.7 -2.0%
Conservative hold Swing +8.8%
Conservative hold Swing +8.2%

Bispham

Bispham (2) [5]
PartyCandidateVotes%±
Conservative Don Clapham1,18730.53%-1.40%
Conservative Henry Mitchell1,06527.40%-3.21%
Labour Kathryn Benson 743 19.11% +7.05%
Labour Bob Harrison 681 17.52% +7.45%
Liberal Democrat Anne Heyworth 211 5.43% -1.11%
Turnout 41.7 -3.0%
Conservative hold Swing -4.2%
Conservative hold Swing -5.4%

Bloomfield

Bloomfield (2) [5]
PartyCandidateVotes%±
Labour Graham Cain84932.79%+16.85%
Labour Mary Smith77730.01%+12.84%
Conservative Irene James 322 12.44% +1.59%
Conservative Michael Ruane 282 10.89% +1.52%
UKIP Hamish Howitt 159 6.14% -0.46%
UKIP Len Booth 146 5.64% +5.64%
Liberal Democrat Michael Hodkinson 54 2.09% -16.90%
Turnout 26.5 -3.4%
Labour hold Swing +7.5%
Labour gain from Liberal Democrat Swing +16.9%

Brunswick

Brunswick (2) [5]
PartyCandidateVotes%±
Labour Gary Coleman1,05931.73%+4.90%
Labour Simon Blackburn1,04931.43%+5.31%
Conservative Timothy Cox 472 14.14% -6.15%
Conservative Geoff Hodson 435 13.03% -5.88%
UKIP Robert McDowell 176 5.27% +5.27%
UKIP Colin Porter 147 4.40% -3.45%
Turnout 33.8 +3.4%
Labour hold Swing +5.5%
Labour hold Swing +5.6%

Claremont

Claremont (2) [5]
PartyCandidateVotes%±
Labour Ivan Taylor1,03134.18%+7.9%
Labour Sylvia Taylor96532.00%+8.6%
Conservative Brian Bell 450 14.92% -2.7%
Conservative Ian Benson 419 13.89% -2.2%
Liberal Democrat David Charles-Cully 151 5.01% -4.5%
Turnout 28.3 +0.5%
Labour hold Swing +5.3%
Labour hold Swing +5.4%

Clifton

Clifton (2) [5]
PartyCandidateVotes%±
Labour Joan Greenhalgh1,09033.39%+8.69%
Labour Adrian Hutton91127.91%+6.23%
Conservative Joe Best 567 17.37% -5.73%
Conservative Marlene Ruane 475 14.55% -7.13%
Independent Michael Carr 221 6.77% -14.91%
Turnout 34.9 +0.2%
Labour hold Swing +7.2%
Labour gain from Conservative Swing +6.7%

Greenlands

Greenlands (2) [5]
PartyCandidateVotes%±
Labour Christine Wright86121.6%+1.9%
Labour Chris Ryan85121.4%+4.2%
Conservative Steve Houghton 816 20.5% -3.3%
Conservative Angela Brown 758 19.0% -3.2%
Independent Julian Mineur 295 7.4% +7.4%
UKIP John Bebbington 258 6.5% +6.5%
Liberal Democrat Carole Bate 142 3.6% -1.7%
Turnout 3,981 40.4 -0.1%
Labour gain from Conservative Swing +2.6%
Labour gain from Conservative Swing +3.2%

Hawes Side

Hawes Side (2) [5]
PartyCandidateVotes%±
Labour Norman Hardy1,24434.6%+12.8%
Labour Val Haynes1,17732.7%+11.8%
Conservative Pam Knight 616 17.1% -1.5%
Conservative Bev Warren 563 14.4% -0.9%
Turnout 3,600 35.4 -0.1%
Labour hold Swing +7.2%
Labour hold Swing +6.4%

Highfield

Highfield (2) [5]
PartyCandidateVotes%±
Conservative Lily Henderson86823.9% '-4.4%
Labour Chris Maughan84923.3%+9.2%
Conservative Susan Fowler 777 21.4% -6.7%
Labour James Sorah 701 19.3% +5.3%
Independent Robert Mottershead 345 9.5% +9.5%
Liberal Democrat Robert Osinski 99 2.7% -4.0%
Turnout 3,639 38.6 -5.8%
Conservative hold Swing -4.9%
Labour gain from Conservative Swing +8.0%

Ingthorpe

Ingthorpe (2) [5]
PartyCandidateVotes%±
Labour Kath Rowson1,13527.6%+3.9%
Labour Amy Cross1,01324.7%+2.9%
Conservative Sheila Haskett 633 15.4% -8.7%
Conservative Tony Normington 633 15.4% -7.3%
Liberal Democrat Steven Bate 477 11.6% +3.9%
Liberal Democrat Geoffrey Newman 215 5.2% +5.2%
Turnout 4,106 42.4 -1.5%
Labour hold Swing +5.6%
Labour gain from Conservative Swing +5.8%

Layton

Layton (2) [5]
PartyCandidateVotes%±
Labour John Boughton1,09128.7%+7.2%
Labour Martin Mitchell92124.2%+2.8%
Conservative Sue Ridyard 837 22.0% -3.6%
Conservative Roy Haskett 817 21.5% -2.1%
Liberal Democrat Steven Farley 141 3.7% -4.3%
Turnout 3,807 39.0 -2.5%
Labour gain from Conservative Swing +5.4%
Labour gain from Conservative Swing +2.5%

Marton

Marton (2) [5]
PartyCandidateVotes%±
Conservative Jim Houldsworth99725.7%-0.5%
Labour Debbie Coleman98425.4%+12.7%
Labour Jim Elmes 932 24.0% +12.9%
Conservative David Christy 816 21.0% -5.3%
Liberal Democrat Betty Newman 151 3.9% -0.6%
Turnout 3,880 38.7 -9.3%
Conservative hold Swing -6.6%
Labour gain from Conservative Swing +9.0%

Norbreck

Norbreck (2) [5]
PartyCandidateVotes%±
Conservative Maxine Callow1,46731.5%-6.0%
Conservative Peter Callow1,46531.5%-5.2%
Labour Betty Bradford 886 19.0% +8.7%
Labour Roy Lewis 840 18.0% +8.6%
Turnout 4,658 48.0 -0.2%
Conservative hold Swing -7.4%
Conservative hold Swing -6.9%

Park

Park (2) [5]
PartyCandidateVotes%±
Labour Gillian Campbell1,08430.3%+9.2%
Labour Brian Doherty1,08330.3%+10.2%
Conservative Peter Collins 784 21.9% +4.8%
Conservative Kevin Wilson 632 17.6% +1.1%
Turnout 3,583 37.3 +4.8%
Labour hold Swing +7.0%
Labour gain from Conservative Swing +5.6%

Squires Gate

Squires Gate (2) [5]
PartyCandidateVotes%±
Conservative Christian Cox82121.1%+7.4%
Liberal Democrat Douglas Green69817.9%-10.1%
Conservative Richard Brodowski 653 16.8% +2.9%
Labour Pat Carson 636 16.4% +9.1%
Labour Robert Wood 624 16.0% +10.0%
Liberal Democrat Susan Close 457 11.8% -18.4%
Turnout 3,889 40.3 -5.0%
Conservative gain from Liberal Democrat Swing +12.9%
Liberal Democrat hold Swing -6.5%

Stanley

Stanley (2) [5]
PartyCandidateVotes%±
Conservative Peter Evans1,08224.6%-9.3%
Conservative Andrew Stansfield97422.2%-9.4%
Labour Pamela Jackson 943 21.5% +7.1%
Labour John Jones 869 19.8% +7.0%
UKIP Jacqueline Bleeker 227 5.2% +5.2%
UKIP Martin Bleeker 213 4.8% +4.8%
Liberal Democrat Eric Close 88 2.0% -5.3%
Turnout 4,396 43.4 +2.6%
Conservative hold Swing -8.2%

Talbot

Talbot (2) [5]
PartyCandidateVotes%±
Labour Sarah Riding89229.0% '+8.2%
Labour Mark Smith85427.8%+8.1%
Conservative Charlie Docherty 697 22.7% -2.9%
Conservative Mike Warren 629 20.5% -4.4%
Turnout 3,072 29.9 +0.3%
Labour gain from Conservative Swing +5.6%
Labour gain from Conservative Swing +6.3%

Tyldesley

Tyldesley (2) [5]
PartyCandidateVotes%±
Labour Allan Matthews1,13731.6%+9.4%
Labour Eddie Collett1,10530.7%+9.2%
Conservative Jim Price 689 19.1% -4.8%
Conservative Roger Stansfield 667 18.5% -4.5%
Turnout 3,598 35.6 +1.1%
Labour gain from Conservative Swing +7.1%
Labour gain from Conservative Swing + 6.9%

Victoria

Victoria (2) [5]
PartyCandidateVotes%±
Labour Fred Jackson1,22137.1%+10.7%
Labour David Owen1,08833.1%+10.8%
Conservative Sharon Sanderson-Robert 519 15.8% -2.0%
Conservative Pat Francioni 461 14.0% -3.7%
Turnout 3,289 33.7 +3.4%
Labour hold Swing +6.4%
Labour hold Swing +7.3%

Warbreck

Warbreck (2) [5]
PartyCandidateVotes%±
Conservative Joyce Delves93825.6%-1.3%
Conservative Tony Brown91124.9%-1.3%
Labour Steven Hemingway 621 17.0% +5.8%
Labour Doreen Peters 582 15.9% +5.6%
Liberal Democrat Kevan Benfold 185 5.1% -3.8%
UKIP Alex Ewan 185 5.1% +5.1%
Liberal Democrat Joleen Rixon 124 3.4% -5.3%
Green Philip Mitchell 112 3.1% +3.1%
Turnout 3,658 37.4 -3.8%
Conservative hold Swing -3.6%
Conservative hold Swing -3.5%

Waterloo

Waterloo (2) [5]
PartyCandidateVotes%±
Labour David O'Hara93727.7%+7.1%
Conservative Tony Lee79323.5%-3.9%
Conservative Ian Fowler 728 21.5% -5.0%
Labour Tasurraf Shah 659 19.5% +2.4%
Liberal Democrat Alma Rollinson 263 7.8% -0.6%
Turnout 3,380 34.6 -1.7%
Labour gain from Conservative Swing +5.5%
Conservative hold Swing -3.7%

Related Research Articles

2007 Woking Borough Council election

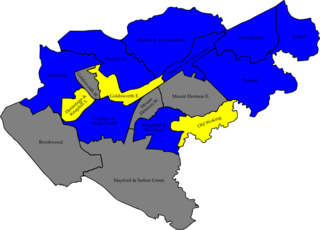
The 2007 Woking Council election took place on 3 May 2007 to elect members of Woking Borough Council in Surrey, England. One third of the council was up for election and the Conservative party gained overall control of the council from no overall control.

The 1999 Pendle Borough Council election took place on 6 May 1999 to elect members of Pendle Borough Council in Lancashire, England. One third of the council was up for election and the Liberal Democrats lost overall control of the council to no overall control.

The 1999 Sandwell Metropolitan Borough Council election took place on 6 May 1999 to elect members of Sandwell Metropolitan Borough Council in the West Midlands, England. One third of the council was up for election and the Labour party stayed in overall control of the council.

2008 Maidstone Borough Council election

The 2008 Maidstone Borough Council election took place on 1 May 2008 to elect members of Maidstone Borough Council in Kent, England. One third of the council was up for election and the Conservative party gained overall control of the council from no overall control.

2011 Barnsley Metropolitan Borough Council election

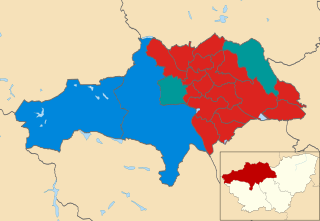
The 2011 Barnsley Metropolitan Borough Council election took place on 5 May 2011 to elect members of Barnsley Metropolitan Borough Council in South Yorkshire, England. One third of the council was up for election and the Labour party stayed in overall control of the council.

2011 Fylde Borough Council election

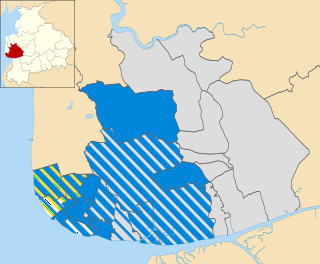
The 2011 Fylde Borough Council election took place on 5 May 2011 to elect members of Fylde Borough Council in Lancashire, England. The whole council was up for election and the Conservative party stayed in overall control of the council.

2011 Barrow-in-Furness Borough Council election

The 2011 Barrow-in-Furness Borough Council election took place on 5 May 2011 to elect members of Barrow-in-Furness Borough Council in Cumbria, England. The whole council was up for election and the Labour party gained overall control of the council from no overall control.

2011 Basildon Borough Council election

The 2011 Basildon Council election took place on 5 May 2011 to elect members of Basildon Borough Council in Essex, England. One third of the council was up for election and the Conservative party stayed in overall control of the council.

The 2002 Basingstoke and Deane Council election took place on 2 May 2002 to elect members of Basingstoke and Deane Borough Council in Hampshire, England. The whole council was up for election with boundary changes since the last election in 2000 increasing the number of seats by 3. The council stayed under no overall control.

2011 Copeland Borough Council election

The 2011 Copeland Borough Council election took place on 5 May 2011 to elect members of Copeland Borough Council in Cumbria, England. The whole council was up for election and the Labour party stayed in overall control of the council.

2011 Sunderland City Council election

The 2011 Sunderland Council election took place on 5 May 2011 to elect members of Sunderland Metropolitan Borough Council in Tyne and Wear, England. One third of the council was up for election and the Labour party stayed in overall control of the council.

2011 Gedling Borough Council election

The 2011 Gedling Borough Council election took place on 5 May 2011 to elect members of Gedling Borough Council in Nottinghamshire, England. The whole council was up for election and the Labour party gained overall control of the council from the Conservative party.

2011 Swindon Borough Council election

The 2011 Swindon Borough Council election took place on 5 May 2011 to elect members of Swindon Unitary Council in Wiltshire, England. One third of the council was up for election and the Conservative party stayed in overall control of the council.

2007 Walsall Metropolitan Borough Council election

The 2007 Walsall Metropolitan Borough Council election took place on 3 May 2007 to elect members of Walsall Metropolitan Borough Council in the West Midlands, England. One third of the council was up for election and the Conservative party stayed in overall control of the council.

2007 Gravesham Borough Council election

The 2007 Gravesham Borough Council election took place on 3 May 2007 to elect members of Gravesham Borough Council in Kent, England. The whole council was up for election and the Conservative party gained overall control of the council from the Labour party.

2007 Redcar and Cleveland Borough Council election

The 2007 Redcar and Cleveland Borough Council election took place on 3 May 2007 to elect members of Redcar and Cleveland Unitary Council in England. The whole council was up for election and the council stayed under no overall control.

2011 Pendle Borough Council election

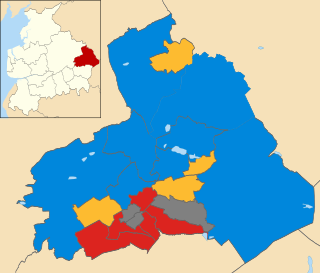
The 2011 Pendle Borough Council election took place on 5 May 2011 to elect members of Pendle Borough Council in Lancashire, England. One third of the council was up for election and the council stayed under no overall control.

2011 St Helens Metropolitan Borough Council election

The 2011 St Helens Metropolitan Borough Council election took place on 5 May 2011 to elect members of St Helens Metropolitan Borough Council in Merseyside, England. One third of the council was up for election and the Labour party stayed in overall control of the council.

2015 Christchurch Borough Council election

The 2015 Christchurch Borough Council election took place on 7 May 2015 to elect members of Christchurch Borough Council in Dorset, England. The whole council was up for election and the Conservative party stayed in overall control of the council.

2011 West Oxfordshire District Council election

The 2011 West Oxfordshire District Council election took place on 5 May 2011 to elect members of West Oxfordshire District Council in Oxfordshire, England. One third of the council was up for election and the Conservative party stayed in overall control of the council.

References

  1. "England council elections". BBC News Online . Retrieved 7 May 2011.
  2. 1 2 3 "Labour gains as Tories lose three Lancashire councils". BBC News Online. 6 May 2011. Retrieved 7 May 2011.
  3. 1 2 "Labour take control of Blackpool". Blackpool Gazette . 6 May 2011. Retrieved 7 May 2011.
  4. "Election results finalised". Blackpool Council. Retrieved 16 September 2011.
  5. 1 2 3 4 5 6 7 8 9 10 11 12 13 14 15 16 17 18 19 20 21 22 "Local Election Results". Blackpool Council. Archived from the original on 3 October 2011. Retrieved 7 May 2011.