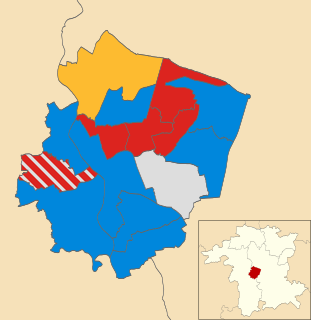
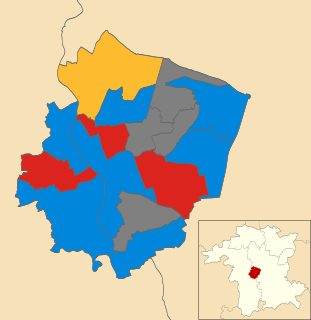
The 2003 Worcester City Council election took place on 1 May 2003 to elect members of Worcester District Council in Worcestershire, England. One third of the council was up for election and the Conservative party gained overall control of the council from no overall control. [1]
Worcester is a city in Worcestershire, England, 31 miles (50 km) southwest of Birmingham, 101 miles (163 km) west-northwest of London, 27 miles (43 km) north of Gloucester and 23 miles (37 km) northeast of Hereford. The population is approximately 100,000. The River Severn flanks the western side of the city centre, which is overlooked by Worcester Cathedral.
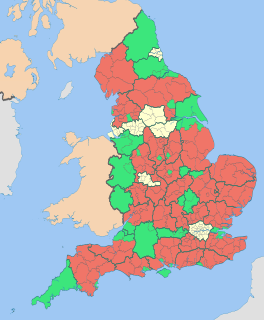
Non-metropolitan districts, or colloquially "shire districts", are a type of local government district in England. As created, they are sub-divisions of non-metropolitan counties in a two-tier arrangement.
Worcestershire is a county in the West Midlands of England. Between 1974 and 1998, it was merged with the neighbouring county of Herefordshire as Hereford and Worcester.
After the election, the composition of the council was
The Conservative Party, officially the Conservative and Unionist Party, is a centre-right political party in the United Kingdom. Presently led by Theresa May, it has been the governing party since 2010. It presently has 314 Members of Parliament in the House of Commons, 249 members of the House of Lords, and 18 members of the European Parliament. It also has 31 Members of the Scottish Parliament, 12 members of the Welsh Assembly, eight members of the London Assembly and 9,008 local councillors. One of the major parties of UK politics, it has formed the government on 45 occasions, more than any other party.
The Labour Party is a centre-left political party in the United Kingdom which has been described as an alliance of social democrats, democratic socialists and trade unionists. The party's platform emphasises greater state intervention, social justice and strengthening workers' rights. Labour is a full member of the Party of European Socialists and Progressive Alliance, and holds observer status in the Socialist International. As of 2017, the party was considered the "largest party in Western Europe" in terms of party membership, with more than half a million members.
The Liberal Democrats are a liberal, centrist political party in the United Kingdom. They presently have 11 Members of Parliament in the House of Commons, 96 members of the House of Lords, and one member of the European Parliament. They also have five Members of the Scottish Parliament and a member each in the Welsh Assembly and London Assembly. The party reached the height of its influence in the early 2010s, forming a junior partner in a coalition government from 2010 to 2015. It is presently led by Vince Cable.
13 seats were contested in the election with 2 seats available in St Nicholas ward after a Labour councillor stood down. [3] Labour defended 7 seats as against 5 for the Conservatives and 1 for the independents. [4] Meanwhile, the decision of the British National Party to put up a candidate in Holy Trinity ward received attention in the press. [3]
A Councillor is a member of a local government council.
The British National Party (BNP) is a far-right, fascist political party in the United Kingdom. It is headquartered in Wigton, Cumbria, and its current leader is Adam Walker. A minor party, it has no elected representatives at any level of UK government. Founded in 1982, the party reached its greatest level of success in the 2000s, when it had over fifty seats in local government, one seat on the London Assembly, and two Members of the European Parliament.
Worcester was a top Conservative target council in the 2003 local elections, [5] [6] with gains here seen as important signal for the parties performance at the next general election. [7] The Conservatives had controlled the council as a minority administration since the 2000 election and were hoping to win a majority. [4] They said Labour had been out of touch when they ran the council and had made poor decisions suching as using green fields for transport schemes. [4] However Labour attacked the Conservatives for the council's budget, including a council tax rise of 9.5% and poor waste collection services; as well as the controversy over the closing and then rescue of Swan Theatre in Worcester. [4]
Waste collection is a part of the process of waste management. It is the transfer of solid waste from the point of use and disposal to the point of treatment or landfill. Waste collection also includes the curbside collection of recyclable materials that technically are not waste, as part of a municipal landfill diversion program.
The level of postal voting in the election was up on previous years with 5,000 postal voting forms being sent, compared to 3,000 in 2002. [8] [9]
Postal voting is voting in an election whereby ballot papers are distributed to electors or returned by post, in contrast to electors voting in person at a polling station or electronically via an electronic voting system. Historically, postal votes must be distributed and placed in return mail before the scheduled election day, it is sometimes referred to as a form of early voting. It can also be used as an absentee ballot. However, in recent times the model in the US has morphed, in municipalities that use postal voting exclusively, to be one of ballots being mailed out to voters, but the return method taking on alternatives of return by mail or dropping off the ballot in person via secure drop boxes and/or voting centers.
The results saw the Conservatives win a majority on the council, [10] after gaining 2 seats from Labour but losing 1 seat to the Liberal Democrats. [11] This meant that Labour only held 10 seats which was the lowest number of seats they had held on the council up to then. [11] However Labour did manage to retain Holy Trinity ward, defeating the British National Party who came second in the ward. [11] Voter turnout was low, dropping as low as 18% in St Barnabus ward. [11]
Voter turnout is the percentage of eligible voters who cast a ballot in an election. Eligibility varies by country, and the voting-eligible population should not be confused with the total adult population. Age and citizenship status are often among the criteria used to determine eligibility, but some countries further restrict eligibility based on sex, race, or religion.
Party | Seats | Gains | Losses | Net gain/loss | Seats % | Votes % | Votes | +/− | |
---|---|---|---|---|---|---|---|---|---|
Conservative | 6 | 2 | 1 | +1 | 46.2 | 41.3 | 9,399 | -3.1% | |
Labour | 5 | 0 | 2 | -2 | 38.5 | 35.9 | 8,163 | -2.2% | |
Liberal Democrat | 1 | 1 | 0 | +1 | 7.7 | 10.8 | 2,452 | -0.7% | |
Independent | 1 | 0 | 0 | 0 | 7.7 | 9.5 | 2,164 | +3.5% | |
BNP | 0 | 0 | 0 | 0 | 0 | 1.2 | 271 | +1.2% | |
Socialist Alternative | 0 | 0 | 0 | 0 | 0 | 1.0 | 220 | +1.0% | |
UKIP | 0 | 0 | 0 | 0 | 0 | 0.4 | 83 | +0.4% |
Party | Candidate | Votes | % | ± | |
---|---|---|---|---|---|
Conservative | Francis Lankester | 722 | 48.1 | -8.7 | |
Labour | Andrew Watson | 559 | 37.2 | -6.0 | |
Socialist Alternative | Douglas Menzies | 220 | 14.7 | +14.7 | |
Majority | 163 | 10.9 | -2.7 | ||
Turnout | 1,501 | 32.0 | |||
Conservative hold | Swing |
Party | Candidate | Votes | % | ± | |
---|---|---|---|---|---|
Conservative | David Clark | 900 | 55.8 | -4.0 | |
Labour | Simon Arnold | 389 | 24.1 | -4.4 | |
Liberal Democrat | Louis Stephen | 325 | 20.1 | +8.4 | |
Majority | 511 | 31.7 | +0.4 | ||
Turnout | 1,614 | 30.5 | |||
Conservative hold | Swing |
Party | Candidate | Votes | % | ± | |
---|---|---|---|---|---|
Liberal Democrat | Elizabeth Smith | 1,346 | 57.2 | -1.0 | |
Conservative | William Elsy | 1,009 | 42.8 | +1.0 | |
Majority | 337 | 14.4 | -2.0 | ||
Turnout | 2,355 | 44.0 | |||
Liberal Democrat gain from Conservative | Swing | ||||
Party | Candidate | Votes | % | ± | |
---|---|---|---|---|---|
Labour | Geoffrey Williams | 566 | 51.6 | -5.9 | |
BNP | Martin Roberts | 271 | 24.7 | +24.7 | |
Conservative | Robert Campbell | 259 | 23.6 | -2.9 | |
Majority | 295 | 26.9 | -4.1 | ||
Turnout | 1,096 | 26.2 | |||
Labour hold | Swing |
Party | Candidate | Votes | % | ± | |
---|---|---|---|---|---|
Independent | Michael Layland | 852 | 54.3 | +9.4 | |
Labour | Christopher Taylor | 505 | 32.2 | -7.7 | |
Conservative | James Denlegh-Maxwell | 212 | 13.5 | -1.7 | |
Majority | 347 | 22.1 | +17.1 | ||
Turnout | 1,569 | 32.0 | |||
Independent hold | Swing |
Party | Candidate | Votes | % | ± | |
---|---|---|---|---|---|
Labour | Adrian Gregson | 563 | 74.2 | -5.0 | |
Conservative | Nicholas Turner | 196 | 25.8 | +5.0 | |
Majority | 367 | 48.4 | -10.0 | ||
Turnout | 759 | 18.3 | |||
Labour hold | Swing |
Party | Candidate | Votes | % | ± | |
---|---|---|---|---|---|
Conservative | Colin Phillips | 871 | 41.0 | -9.1 | |
Labour | Matthew Lamb | 858 | 40.4 | -9.5 | |
Independent | Paul Coveney | 394 | 18.6 | +18.6 | |
Majority | 13 | 0.6 | +0.4 | ||
Turnout | 2,123 | 33.5 | |||
Conservative gain from Labour | Swing | ||||
Party | Candidate | Votes | % | ± | |
---|---|---|---|---|---|
Labour | David Candler | 753 | 53.1 | +0.6 | |
Independent | Colin Layland | 396 | 27.9 | +0.1 | |
Conservative | Gordon Hazelton | 185 | 13.1 | -6.6 | |
UKIP | Jean Eaves | 83 | 5.9 | +5.9 | |
Majority | 357 | 25.2 | +0.5 | ||
Turnout | 1,417 | 28.5 | |||
Labour hold | Swing |
Party | Candidate | Votes | % | ± | |
---|---|---|---|---|---|
Conservative | Lucy Hodgson | 1,460 | 50.2 | -1.1 | |
Labour | Pamela Clayton | 1,447 | 49.8 | +1.1 | |
Majority | 13 | 0.4 | -2.2 | ||
Turnout | 2,907 | 23.6 | |||
Conservative gain from Labour | Swing | ||||
Party | Candidate | Votes | % | ± | |
---|---|---|---|---|---|
Labour | Robert Peachey | 837 | |||
Labour | Richard Bird | 834 | |||
Conservative | David Tibbutt | 759 | |||
Conservative | Rodney Staines | 715 | |||
Turnout | 3,145 | 33.0 | |||
Labour hold | Swing | ||||
Labour hold | Swing |
Party | Candidate | Votes | % | ± | |
---|---|---|---|---|---|
Conservative | Robert Rowden | 1,121 | 42.9 | -8.8 | |
Labour | George Squires | 524 | 20.1 | -7.7 | |
Independent | Craig Mills | 522 | 20.0 | +20.0 | |
Liberal Democrat | Iain Macbriar | 446 | 17.1 | -3.4 | |
Majority | 597 | 22.8 | -1.1 | ||
Turnout | 2,613 | 30.0 | |||
Conservative hold | Swing |
Party | Candidate | Votes | % | ± | |
---|---|---|---|---|---|
Conservative | Stephen Inman | 990 | 59.9 | -1.4 | |
Liberal Democrat | Paul Griffiths | 335 | 20.3 | +2.8 | |
Labour | Ali Asghar | 328 | 19.8 | -1.4 | |
Majority | 655 | 39.6 | -0.5 | ||
Turnout | 1,653 | 30.0 | |||
Conservative hold | Swing |
The 1998 Solihull Metropolitan Borough Council election took place on 7 May 1998 to elect members of Solihull Metropolitan Borough Council in the West Midlands, England. One third of the council was up for election and the council stayed under no overall control.
The 2002 Redditch Borough Council election of 2 May 2002 elected members of Redditch Borough Council in the West Midlands region, England. One third of the council stood for re-election and the Labour party lost overall control of the council to no overall control for the first time in many years.
The 2003 Redditch Borough Council election took place on 1 May 2003 to elect members of Redditch Borough Council in the West Midlands region, England. One third of the council was up for election and the council stayed under no overall control.
The 1999 Bromsgrove District Council election took place on 6 May 1999 to elect members of Bromsgrove district council in Worcestershire, England. The whole council was up for election and the Conservative party gained overall control of the council from the Labour party.
The 1998 Wyre Forest District Council election took place on 7 May 1998 to elect members of Wyre Forest District Council in Worcestershire, England. One third of the council was up for election and the Labour party stayed in overall control of the council.
The 2006 Wyre Forest District Council election took place on 4 May 2006 to elect members of Wyre Forest District Council in Worcestershire, England. One third of the council was up for election and the council stayed under no overall control.
The 2008 Wyre Forest District Council election took place on 1 May 2008 to elect members of Wyre Forest District Council in Worcestershire, England. One third of the council was up for election and the Conservative party gained overall control of the council from no overall control.
The 1998 Worcester City Council election took place on 7 May 1998 to elect members of Worcester District Council in Worcestershire, England. One third of the council was up for election and the Labour party stayed in overall control of the council.
The 1999 Worcester City Council election took place on 6 May 1999 to elect members of Worcester District Council in Worcestershire, England. One third of the council was up for election and the Labour party stayed in overall control of the council.
The 2000 Worcester City Council election took place on 4 May 2000 to elect members of Worcester District Council in Worcestershire, England. One third of the council was up for election and the Labour party lost overall control of the council to no overall control.
The 2002 Worcester City Council election took place on 2 May 2002 to elect members of Worcester District Council in Worcestershire, England. One third of the council was up for election and the council stayed under no overall control.
The 2004 Worcester City Council election took place on 10 June 2004 to elect members of Worcester District Council in Worcestershire, England. The whole council was up for election with boundary changes since the last election in 2003 reducing the number of seats by one. The Conservative party stayed in overall control of the council.
The 2006 Worcester City Council election took place on 4 May 2006 to elect members of Worcester District Council in Worcestershire, England. One third of the council was up for election and the Conservative party stayed in overall control of the council.
The 2007 Worcester City Council election took place on 3 May 2007 to elect members of Worcester District Council in Worcestershire, England. One third of the council was up for election and the Conservative party stayed in overall control of the council.
The 2008 Worcester City Council election took place on 1 May 2008 to elect members of Worcester District Council in Worcestershire, England. One third of the council was up for election and the council stayed under no overall control.
The 2003 Stratford-on-Avon District Council election took place on 1 May 2003 to elect members of Stratford-on-Avon District Council in Warwickshire, England. One third of the council was up for election and the Conservative party gained overall control of the council from no overall control.
The 1999 Solihull Metropolitan Borough Council election took place on 6 May 1999 to elect members of Solihull Metropolitan Borough Council in the West Midlands, England. One third of the council was up for election and the council stayed under no overall control.
The 2003 Solihull Metropolitan Borough Council election took place on 1 May 2003 to elect members of Solihull Metropolitan Borough Council in the West Midlands, England. One third of the council was up for election and the Conservative party stayed in overall control of the council.
The 2006 Solihull Metropolitan Borough Council election took place on 4 May 2006 to elect members of Solihull Metropolitan Borough Council in the West Midlands, England. One third of the council was up for election and the Conservative party stayed in overall control of the council.
The 2007 Solihull Metropolitan Borough Council election took place on 4 May 2007 to elect members of Solihull Metropolitan Borough Council in the West Midlands, England. One third of the council was up for election and the Conservative party lost overall control of the council to no overall control.