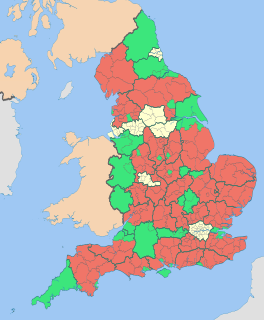
The 2008 Stratford-on-Avon District Council election took place on 1 May 2008 to elect members of Stratford-on-Avon District Council in Warwickshire, England. One third of the council was up for election and the Conservative party stayed in overall control of the council. [1]
Non-metropolitan districts, or colloquially "shire districts", are a type of local government district in England. As created, they are sub-divisions of non-metropolitan counties in a two-tier arrangement.
Warwickshire is a landlocked county in the West Midlands region of England. The county town is Warwick, although the largest town is Nuneaton. The county is famous for being the birthplace of William Shakespeare.
England is a country that is part of the United Kingdom. It shares land borders with Wales to the west and Scotland to the north-northwest. The Irish Sea lies west of England and the Celtic Sea lies to the southwest. England is separated from continental Europe by the North Sea to the east and the English Channel to the south. The country covers five-eighths of the island of Great Britain, which lies in the North Atlantic, and includes over 100 smaller islands, such as the Isles of Scilly and the Isle of Wight.
After the election, the composition of the council was
The Conservative Party, officially the Conservative and Unionist Party, is a centre-right political party in the United Kingdom. Presently led by Theresa May, it has been the governing party since 2010. It presently has 314 Members of Parliament in the House of Commons, 249 members of the House of Lords, and 18 members of the European Parliament. It also has 31 Members of the Scottish Parliament, 12 members of the Welsh Assembly, eight members of the London Assembly and 9,008 local councillors. One of the major parties of UK politics, it has formed the government on 45 occasions, more than any other party.
The Liberal Democrats are a liberal, centrist political party in the United Kingdom. They presently have 11 Members of Parliament in the House of Commons, 96 members of the House of Lords, and one member of the European Parliament. They also have five Members of the Scottish Parliament and a member each in the Welsh Assembly and London Assembly. The party reached the height of its influence in the early 2010s, forming a junior partner in a coalition government from 2010 to 2015. It is presently led by Vince Cable.
Before the election the Conservatives had a 21-seat majority with 37 councillors, as compared to 14 for the Liberal Democrats and 2 independents. [3] 19 seats were being contested in the election, which was expected to be fought mainly between the Conservatives and Liberal Democrats. [3]
A Councillor is a member of a local government council.
The results saw the Liberal Democrats make 5 gains to reduce the Conservatives majority on the council. [4] 3 of the gains for the Liberal Democrats came in the wards of Stratford-upon-Avon itself, along with 2 in Harbury and Shipston. [5] Meanwhile, the one independent councillor who was up for election, Kim James, successfully held his seat in Bidford and Salford ward, defeating the Liberal Democrat candidate by 185 votes. [4]
Stratford-upon-Avon, commonly known as just Stratford, is a market town and civil parish in the Stratford-on-Avon District, in the county of Warwickshire, England, on the River Avon, 91 miles (146 km) north west of London, 22 miles (35 km) south east of Birmingham, and 8 miles (13 km) south west of Warwick. The estimated population in 2007 was 25,505, increasing to 27,445 at the 2011 Census.
Harbury is a village and civil parish in the Stratford-on-Avon district of Warwickshire, England. It is about 3 miles (5 km) west-southwest of Southam and about 5 miles (8 km) southeast of Royal Leamington Spa. The parish includes the hamlet of Deppers Bridge. The 2011 Census recorded the parish's population as 2,420.
Shipston-on-Stour is a town and civil parish in south Warwickshire. It lies on the River Stour about 10 miles (16 km) south of Stratford-upon-Avon in the heart of the area historically known as the Vale of the Red Horse, close to the boundaries with Oxfordshire and Gloucestershire.
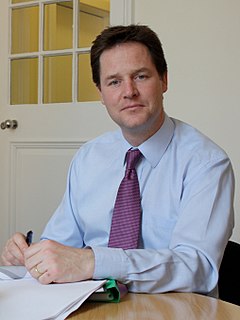
The losses for the Conservatives were one of the worst performances by the party in the 2008 local elections, in contrast to the national picture where they made strong gains. Meanwhile, the Liberal Democrat leader, Nick Clegg described the Stratford election as "an excellent result". [6]
Sir Nicholas William Peter Clegg is a British former politician who served as Deputy Prime Minister of the United Kingdom from 2010 to 2015 and as Leader of the Liberal Democrats from 2007 to 2015. An "Orange Book" liberal, Clegg served as a Member of Parliament (MP) for Sheffield Hallam from 2005 to 2017 and has been associated with both socially liberal and economically liberal policies. He is currently Vice-President for Global Affairs and Communications at Facebook.
Party | Seats | Gains | Losses | Net gain/loss | Seats % | Votes % | Votes | +/− | |
---|---|---|---|---|---|---|---|---|---|
Conservative | 11 | 0 | 5 | -5 | 57.9 | 51.0 | 15,222 | -0.9% | |
Liberal Democrat | 7 | 5 | 0 | +5 | 36.8 | 39.9 | 11,916 | +4.3% | |
Independent | 1 | 0 | 0 | 0 | 5.3 | 3.4 | 1,019 | +0.4% | |
Labour | 0 | 0 | 0 | 0 | 0 | 3.7 | 1,103 | -1.8% | |
UKIP | 0 | 0 | 0 | 0 | 0 | 1.4 | 406 | -0.9% | |
Green | 0 | 0 | 0 | 0 | 0 | 0.6 | 183 | -1.1% |
Party | Candidate | Votes | % | ± | |
---|---|---|---|---|---|
Conservative | Susan Adams | 1,139 | 55.1 | -4.9 | |
Liberal Democrat | Carol Lane | 856 | 41.4 | +10.3 | |
Labour | Michael Gerrard | 73 | 3.5 | -0.2 | |
Majority | 283 | 13.7 | -15.2 | ||
Turnout | 2,068 | 43.9 | +0.2 | ||
Conservative hold | Swing |
Party | Candidate | Votes | % | ± | |
---|---|---|---|---|---|
Conservative | William Lawrence | 524 | 73.0 | +11.9 | |
Liberal Democrat | John Bicknell | 194 | 27.0 | -11.9 | |
Majority | 330 | 46.0 | +23.8 | ||
Turnout | 718 | 47.0 | -5.9 | ||
Conservative hold | Swing |
Party | Candidate | Votes | % | ± | |
---|---|---|---|---|---|
Conservative | Valerie Hobbs | 537 | 73.1 | +10.8 | |
Liberal Democrat | John Insoll | 198 | 26.9 | +3.8 | |
Majority | 339 | 46.1 | +6.9 | ||
Turnout | 735 | 41.7 | -0.5 | ||
Conservative hold | Swing |
Party | Candidate | Votes | % | ± | |
---|---|---|---|---|---|
Independent | Kim James | 903 | 52.0 | +52.0 | |
Liberal Democrat | Rona Fitzpatrick | 718 | 41.3 | +4.9 | |
Labour | Alec Brown | 116 | 6.7 | -0.9 | |
Majority | 185 | 10.7 | |||
Turnout | 1,737 | 32.9 | -5.3 | ||
Independent hold | Swing |
Party | Candidate | Votes | % | ± | |
---|---|---|---|---|---|
Conservative | Simon Jackson | 647 | 78.8 | +13.0 | |
Liberal Democrat | Alan Hill | 174 | 21.2 | -13.0 | |
Majority | 473 | 57.6 | +26.1 | ||
Turnout | 821 | 45.9 | -3.7 | ||
Conservative hold | Swing |
Party | Candidate | Votes | % | ± | |
---|---|---|---|---|---|
Conservative | John Horner | 684 | 82.6 | +9.3 | |
Liberal Democrat | Jeanne Lowe | 144 | 17.4 | -9.3 | |
Majority | 540 | 65.2 | +18.7 | ||
Turnout | 828 | 45.9 | -1.4 | ||
Conservative hold | Swing |
Party | Candidate | Votes | % | ± | |
---|---|---|---|---|---|
Conservative | Izzi Seccombe | 597 | 68.0 | +2.6 | |
Liberal Democrat | Christian Senior | 165 | 18.8 | -15.8 | |
Independent | Darryl Armstrong | 116 | 13.2 | +13.2 | |
Majority | 432 | 49.2 | +18.4 | ||
Turnout | 878 | 47.4 | -2.3 | ||
Conservative hold | Swing |
Party | Candidate | Votes | % | ± | |
---|---|---|---|---|---|
Liberal Democrat | Beverley Mann | 861 | 50.3 | +6.8 | |
Conservative | Peter Barton | 850 | 49.7 | -6.8 | |
Majority | 11 | 0.6 | |||
Turnout | 1,711 | 45.5 | +2.1 | ||
Liberal Democrat gain from Conservative | Swing | ||||
Party | Candidate | Votes | % | ± | |
---|---|---|---|---|---|
Conservative | Stephen Thirlwell | 1,172 | 74.6 | -2.3 | |
Liberal Democrat | Karyl Rees | 215 | 13.7 | +6.0 | |
UKIP | Brett Parsons | 184 | 11.7 | +3.5 | |
Majority | 957 | 60.9 | -7.8 | ||
Turnout | 1,571 | 44.0 | -2.2 | ||
Conservative hold | Swing |
Party | Candidate | Votes | % | ± | |
---|---|---|---|---|---|
Conservative | Susan Wixey | 979 | 70.0 | +10.9 | |
Liberal Democrat | Vivien Purdy | 420 | 30.0 | -10.9 | |
Majority | 559 | 40.0 | +21.7 | ||
Turnout | 1,399 | 41.5 | -4.5 | ||
Conservative hold | Swing |
Party | Candidate | Votes | % | ± | |
---|---|---|---|---|---|
Liberal Democrat | Richard Cheney | 934 | 48.7 | -0.5 | |
Conservative | Trevor Russel | 921 | 48.0 | +1.5 | |
Labour | Jeffrey Kenner | 64 | 3.3 | -1.0 | |
Majority | 13 | 0.7 | -1.9 | ||
Turnout | 1,919 | 48.6 | -0.7 | ||
Liberal Democrat gain from Conservative | Swing | ||||
Party | Candidate | Votes | % | ± | |
---|---|---|---|---|---|
Conservative | John Appleton | 853 | 52.1 | -4.7 | |
Labour | Peter Thomas | 404 | 24.7 | -7.6 | |
Liberal Democrat | Angela Adkins | 380 | 23.2 | +12.3 | |
Majority | 449 | 27.4 | +2.9 | ||
Turnout | 1,637 | 33.1 | -1.5 | ||
Conservative hold | Swing |
Party | Candidate | Votes | % | ± | |
---|---|---|---|---|---|
Liberal Democrat | Kate Rolfe | 1,264 | 49.1 | +10.3 | |
Conservative | Lynda Organ | 1,088 | 42.3 | -6.3 | |
UKIP | Ralph Berry | 222 | 8.6 | +0.7 | |
Majority | 176 | 6.8 | |||
Turnout | 2,574 | 48.3 | +1.7 | ||
Liberal Democrat gain from Conservative | Swing | ||||
Party | Candidate | Votes | % | ± | |
---|---|---|---|---|---|
Liberal Democrat | Trevor Honychurch | 991 | 47.6 | +30.0 | |
Conservative | Juliet Short | 957 | 46.0 | +5.1 | |
Labour | Matthew Stephens | 132 | 6.3 | +0.2 | |
Majority | 34 | 1.6 | |||
Turnout | 2,080 | 37.5 | -5.5 | ||
Liberal Democrat gain from Conservative | Swing | ||||
Party | Candidate | Votes | % | ± | |
---|---|---|---|---|---|
Liberal Democrat | Ron Cockings | 1,141 | 47.3 | +16.3 | |
Conservative | Michael Perry | 956 | 39.6 | -10.8 | |
Green | Hugh Chatwin | 183 | 7.6 | +1.7 | |
Labour | George Hathaway | 134 | 5.6 | -2.1 | |
Majority | 185 | 7.7 | |||
Turnout | 2,414 | 42.0 | -2.4 | ||
Liberal Democrat gain from Conservative | Swing | ||||
Party | Candidate | Votes | % | ± | |
---|---|---|---|---|---|
Liberal Democrat | Joyce Taylor | 798 | 66.8 | -1.3 | |
Conservative | Karen Parnell | 317 | 26.5 | +3.3 | |
Labour | David Talbot | 80 | 6.7 | -2.0 | |
Majority | 481 | 40.3 | -4.6 | ||
Turnout | 1,195 | 35.6 | -4.5 | ||
Liberal Democrat hold | Swing |
Party | Candidate | Votes | % | ± | |
---|---|---|---|---|---|
Liberal Democrat | Paul Beaman | 1,083 | 59.0 | +15.1 | |
Conservative | Jon Vale | 652 | 35.5 | -13.0 | |
Labour | Jacqueline Abbott | 100 | 5.4 | -2.2 | |
Majority | 431 | 23.5 | |||
Turnout | 1,835 | 40.6 | +0.0 | ||
Liberal Democrat hold | Swing |
Party | Candidate | Votes | % | ± | |
---|---|---|---|---|---|
Conservative | George Atkinson | 1,140 | 86.6 | +5.7 | |
Liberal Democrat | Sally Hinchley | 176 | 13.4 | -5.7 | |
Majority | 964 | 73.3 | +1.5 | ||
Turnout | 1,316 | 41.5 | +0.3 | ||
Conservative hold | Swing |
Party | Candidate | Votes | % | ± | |
---|---|---|---|---|---|
Conservative | Sue Main | 1,209 | 50.1 | +7.2 | |
Liberal Democrat | Michala Piotrowski | 1,204 | 49.9 | -2.5 | |
Majority | 5 | 0.2 | |||
Turnout | 2,413 | 45.0 | +1.5 | ||
Conservative hold | Swing |
One third of Stratford-on-Avon District Council in Warwickshire, England is elected each year, followed by one year without election. Since the last boundary changes in 2002, 53 councillors have been elected from 31 wards.
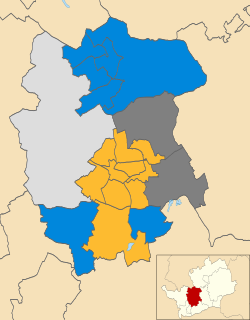
The 2008 St Albans City and District Council election took place on 1 May 2008 to elect members of St Albans District Council in Hertfordshire, England. One third of the council was up for election and the Liberal Democrats gained overall control of the council from no overall control.
The 2008 Derby City Council election took place on 1 May 2008 to elect members of Derby City Council in England. One third of the council was up for election and the council stayed under no overall control. Overall turnout was 34.6%.
The 2008 Solihull Metropolitan Borough Council election took place on 1 May 2008 to elect members of Solihull Metropolitan Borough Council in the West Midlands, England. One third of the council was up for election and the Conservative party gained overall control of the council from no overall control.
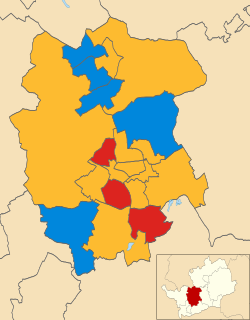
The 2003 St Albans City and District Council election took place on 1 May 2003 to elect members of St Albans District Council in Hertfordshire, England. One third of the council was up for election and the council stayed under no overall control.
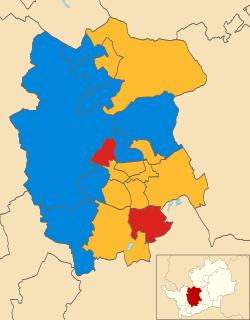
The 2006 St Albans City and District Council election took place on 4 May 2006 to elect members of St Albans District Council in Hertfordshire, England. One third of the council was up for election and the Liberal Democrats gained overall control of the council from no overall control.
The 2007 St Albans City and District Council election took place on 3 May 2007 to elect members of St Albans District Council in Hertfordshire, England. One third of the council was up for election and the Liberal Democrats lost overall control of the council to no overall control.
The 2010 Winchester Council election took place on 6 May 2010 to elect members of Winchester District Council in Hampshire, England. One third of the council was up for election and the Liberal Democrats gained overall control of the council from the Conservative party.
The 2006 Winchester Council election took place on 4 May 2006 to elect members of Winchester District Council in Hampshire, England. One third of the council was up for election and the Conservative party gained overall control of the council from no overall control.
The 1999 Stratford-on-Avon District Council election took place on 6 May 1999 to elect members of Stratford-on-Avon District Council in Warwickshire, England. One third of the council was up for election and the council stayed under no overall control.
The 2000 Stratford-on-Avon District Council election took place on 4 May 2000 to elect members of Stratford-on-Avon District Council in Warwickshire, England. One third of the council was up for election and the Conservative party gained overall control of the council from no overall control.
The 2002 Stratford-on-Avon District Council election took place on 2 May 2002 to elect members of Stratford-on-Avon District Council in Warwickshire, England. The whole council was up for election with boundary changes since the last election in 2000 reducing the number of seats by 2. The Conservative party stayed in overall control of the council.
The 2003 Stratford-on-Avon District Council election took place on 1 May 2003 to elect members of Stratford-on-Avon District Council in Warwickshire, England. One third of the council was up for election and the Conservative party gained overall control of the council from no overall control.
The 2004 Stratford-on-Avon District Council election took place on 10 June 2004 to elect members of Stratford-on-Avon District Council in Warwickshire, England. One third of the council was up for election and the Conservative party stayed in overall control of the council.
The 2006 Stratford-on-Avon District Council election took place on 4 May 2006 to elect members of Stratford-on-Avon District Council in Warwickshire, England. One third of the council was up for election and the Conservative party stayed in overall control of the council.
The 2007 Stratford-on-Avon District Council election took place on 3 May 2007 to elect members of Stratford-on-Avon District Council in Warwickshire, England. One third of the council was up for election and the Conservative party stayed in overall control of the council.
The 2008 Cheltenham Council election took place on 1 May 2008 to elect members of Cheltenham Borough Council in Gloucestershire, England. Half of the council was up for election and the council stayed under no overall control.
The 2006 Solihull Metropolitan Borough Council election took place on 4 May 2006 to elect members of Solihull Metropolitan Borough Council in the West Midlands, England. One third of the council was up for election and the Conservative party stayed in overall control of the council.
The 2006 Sunderland Council election took place on 4 May 2006 to elect members of Sunderland City Council in Tyne and Wear, England. One third of the Council was up for election and the Labour party stayed in overall control.
The 2011 Wealden District Council election took place on 5 May 2011 to elect members of Wealden District Council in East Sussex, England. The whole council was up for election and the Conservative party stayed in overall control of the council.