Elections to Epping Forest Council were held on 4 May 2000. One third of the council was up for election and the council stayed under no overall control. Overall turnout was 30.4%.
In the context of local authorities in the United Kingdom, the term no overall control refers to a situation in which no single political group achieves a majority of seats; and is analogous to a hung parliament. Of the 310 councils who had members up for election in the 2007 local elections, 85 resulted in a NOC administration.
After the election, the composition of the council was
The Conservative Party, officially the Conservative and Unionist Party, is a centre-right political party in the United Kingdom. The governing party since 2010, it is the largest in the House of Commons, with 314 Members of Parliament, and also has 249 members of the House of Lords, 18 members of the European Parliament, 31 Members of the Scottish Parliament, 12 members of the Welsh Assembly, eight members of the London Assembly and 9,008 local councillors.
The Liberal Democrats are a liberal political party in the United Kingdom who have 11 Members of Parliament in the House of Commons, 96 members of the House of Lords, one member of the European Parliament, five Members of the Scottish Parliament and one member in the Welsh Assembly and London Assembly. The party formed a coalition government with the Conservative Party from 2010 to 2015 with its leader Nick Clegg serving as Deputy Prime Minister. It is currently led by Vince Cable.
The Labour Party is a centre-left political party in the United Kingdom which has been described as an alliance of social democrats, democratic socialists and trade unionists. The party's platform emphasises greater state intervention, social justice and strengthening workers' rights.
Party | Seats | Gains | Losses | Net gain/loss | Seats % | Votes % | Votes | +/− | |
---|---|---|---|---|---|---|---|---|---|
Conservative | 8 | +2 | 40.0 | 43.1 | 8,465 | +0.4% | |||
Liberal Democrat | 5 | 0 | 25.0 | 24.2 | 4,751 | -0.9% | |||
Labour | 3 | -2 | 15.0 | 19.1 | 3,738 | -7.3% | |||
Loughton Residents Association | 3 | 0 | 15.0 | 8.9 | 1,751 | +6.3% | |||
Independent | 1 | 0 | 5.0 | 4.7 | 917 | +1.5% | |||
1 Conservative candidate was unopposed
Party | Candidate | Votes | % | ± | |
---|---|---|---|---|---|
Labour | Margaret Owen | 498 | 65.1 | -12.5 | |
Conservative | Ian Locks | 267 | 34.9 | +12.5 | |
Majority | 231 | 30.2 | -25.0 | ||
Turnout | 765 | 19.8 | -2.5 | ||
Party | Candidate | Votes | % | ± | |
---|---|---|---|---|---|
Liberal Democrat | Leonard Martin | 620 | 60.0 | -4.8 | |
Conservative | George Denny | 301 | 29.1 | +6.0 | |
Labour | Ronald Rodwell | 112 | 10.8 | -1.3 | |
Majority | 319 | 30.9 | -10.8 | ||
Turnout | 1,033 | 31.6 | +5.5 | ||
Party | Candidate | Votes | % | ± | |
---|---|---|---|---|---|
Liberal Democrat | Ann Haigh | 876 | 55.0 | +2.0 | |
Conservative | Richard Watts | 648 | 40.7 | -1.8 | |
Labour | Janice Croke | 70 | 4.4 | +0.0 | |
Majority | 228 | 14.3 | +3.8 | ||
Turnout | 1,594 | 32.2 | -0.5 | ||
Party | Candidate | Votes | % | ± | |
---|---|---|---|---|---|
Conservative | John Gilliham | 564 | 79.2 | +47.3 | |
Liberal Democrat | Peter Netherclift | 148 | 20.8 | +14.9 | |
Majority | 416 | 58.4 | |||
Turnout | 712 | 22.5 | -9.1 | ||
Party | Candidate | Votes | % | ± | |
---|---|---|---|---|---|
Labour | Colin Huckle | 485 | 62.1 | -13.4 | |
Conservative | Derek Knight | 296 | 37.9 | +13.4 | |
Majority | 189 | 24.2 | -26.8 | ||
Turnout | 781 | 20.1 | -1.0 | ||
Party | Candidate | Votes | % | ± | |
---|---|---|---|---|---|
Liberal Democrat | Janet Whitehouse | 862 | 50.6 | +0.5 | |
Conservative | Ian Hull | 704 | 41.3 | +0.7 | |
Labour | Barry Johns | 137 | 8.0 | -1.4 | |
Majority | 158 | 9.3 | -0.2 | ||
Turnout | 1,703 | 37.4 | -3.3 | ||
Party | Candidate | Votes | % | ± | |
---|---|---|---|---|---|
Conservative | Richard Brady | 705 | 41.8 | -7.6 | |
Liberal Democrat | Robert Goold | 558 | 33.1 | +13.0 | |
Labour | Thomas Norris | 422 | 25.0 | -5.5 | |
Majority | 147 | 8.7 | -10.2 | ||
Turnout | 1,685 | 36.3 | +6.1 | ||
Party | Candidate | Votes | % | ± | |
---|---|---|---|---|---|
Liberal Democrat | William Maclaine | 740 | 53.4 | -1.5 | |
Conservative | Ronald McCarthy | 561 | 40.4 | +4.1 | |
Labour | Sidney Miller | 86 | 6.2 | -2.6 | |
Majority | 179 | 13.0 | -5.6 | ||
Turnout | 1,387 | 31.8 | +5.8 | ||
Party | Candidate | Votes | % | ± | |
---|---|---|---|---|---|
Conservative | Margaret McEwen | unopposed | |||
Party | Candidate | Votes | % | ± | |
---|---|---|---|---|---|
Loughton Residents Association | Ronald Gow | 537 | 51.2 | +0.7 | |
Conservative | Stephen Metcalf | 402 | 38.4 | +5.0 | |
Labour | Joan Ormston | 109 | 10.4 | -2.8 | |
Majority | 135 | 12.8 | -4.3 | ||
Turnout | 1,048 | 33.3 | -0.7 | ||
Party | Candidate | Votes | % | ± | |
---|---|---|---|---|---|
Labour | Stanley Goodwin | 630 | 54.6 | -6.6 | |
Conservative | Jessica Bostock | 375 | 32.5 | +3.3 | |
Liberal Democrat | Lucille Thompson | 148 | 12.8 | +3.2 | |
Majority | 255 | 22.1 | -9.9 | ||
Turnout | 1,153 | 28.8 | +4.2 | ||
Party | Candidate | Votes | % | ± | |
---|---|---|---|---|---|
Loughton Residents Association | Roger Pearce | 602 | 53.8 | +0.2 | |
Conservative | Colin Finn | 401 | 35.8 | +2.9 | |
Labour | Thomas Owen | 116 | 10.4 | -3.0 | |
Majority | 201 | 18.0 | -2.7 | ||
Turnout | 1,119 | 27.8 | +5.3 | ||
Party | Candidate | Votes | % | ± | |
---|---|---|---|---|---|
Loughton Residents Association | Michael Wardle | 612 | 61.4 | +1.7 | |
Conservative | John Silberrad | 290 | 29.1 | +5.7 | |
Labour | Peter Lavin | 94 | 9.4 | -7.5 | |
Majority | 322 | 32.3 | -4.0 | ||
Turnout | 996 | 31.0 | +0.4 | ||
Party | Candidate | Votes | % | ± | |
---|---|---|---|---|---|
Conservative | Diana Collins | 391 | 84.6 | ||
Liberal Democrat | Susan Hutchings | 71 | 15.4 | ||
Majority | 320 | 69.2 | |||
Turnout | 462 | 29.7 | |||
Party | Candidate | Votes | % | ± | |
---|---|---|---|---|---|
Conservative | Peter Johnson | 514 | 56.3 | -7.2 | |
Labour | Albert Farren | 360 | 39.4 | +7.4 | |
Liberal Democrat | Olive Dunseath | 39 | 4.3 | -0.2 | |
Majority | 154 | 16.9 | -14.6 | ||
Turnout | 913 | 27.3 | +1.4 | ||
Party | Candidate | Votes | % | ± | |
---|---|---|---|---|---|
Liberal Democrat | Douglas Kelly | 431 | 66.5 | ||
Conservative | William White | 217 | 33.5 | ||
Majority | 214 | 33.0 | |||
Turnout | 648 | 54.5 | |||
Party | Candidate | Votes | % | ± | |
---|---|---|---|---|---|
Independent | Norman Clark | 435 | 82.7 | ||
Labour | Robin Walker | 91 | 17.3 | ||
Majority | 344 | 65.4 | |||
Turnout | 526 | 25.2 | |||
Party | Candidate | Votes | % | ± | |
---|---|---|---|---|---|
Conservative | John Harrington | 397 | 76.9 | ||
Labour | Jill Finlay | 119 | 23.1 | ||
Majority | 278 | 53.8 | |||
Turnout | 516 | 23.8 | |||
Party | Candidate | Votes | % | ± | |
---|---|---|---|---|---|
Conservative | Robert Glozier | 591 | 45.2 | -17.7 | |
Independent | Ronald Smith | 482 | 36.9 | +36.9 | |
Liberal Democrat | Monica Richardson | 165 | 12.6 | -13.1 | |
Labour | Derek Clark | 69 | 5.3 | -6.1 | |
Majority | 109 | 8.3 | -28.9 | ||
Turnout | 1,307 | 42.5 | +10.5 | ||
Party | Candidate | Votes | % | ± | |
---|---|---|---|---|---|
Conservative | Mark Gilding | 841 | 66.0 | +5.2 | |
Labour | John Langer | 340 | 26.7 | -4.4 | |
Liberal Democrat | Ingrid Black | 93 | 7.3 | -0.8 | |
Majority | 501 | 39.3 | +9.6 | ||
Turnout | 1,274 | 22.8 | +0.0 | ||
Epping Forest is a local government district in Essex, England. It is named after, and contains a large part of, Epping Forest.
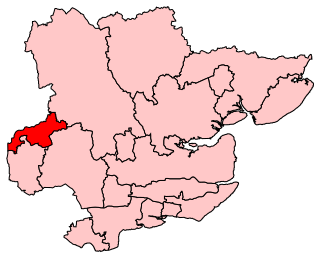
Harlow is a constituency represented in the House of Commons of the UK Parliament since 2010 by Robert Halfon, a Conservative.
Epping Forest is a parliamentary constituency in Essex represented in the House of Commons of the UK Parliament since 1997 by Eleanor Laing, a Conservative.
The district of Epping Forest is in the county of Essex in England. It was created on 1 April 1974, following the merger of Epping Urban District, Chigwell Urban District, Waltham Holy Cross Urban District, and part of Epping and Ongar Rural District.
Elections to Epping Forest Council were held on 7 May 1998. One third of the council was up for election and the council stayed under no overall control. Overall turnout was 29.4%.
Elections to Epping Forest Council were held on 6 May 1999. One third of the council was up for election and the council stayed under no overall control. Overall turnout was 29%.
Elections to Epping Forest Council were held on 2 May 2002. The whole council was up for election with boundary changes since the last election in 2000 reducing the number of seats by 1. The council stayed under no overall control.
Elections to Epping Forest Council were held on 1 May 2003. One third of the council was up for election and the council stayed under no overall control.
Elections to Epping Forest Council were held on 10 June 2004. One third of the council was up for election and the council stayed under no overall control. Overall turnout was 37.6%
Elections to Epping Forest Council were held on 4 May 2006. One third of the council was up for election and the council stayed under no overall control.
Elections to Epping Forest Council were held on 3 May 2007. One third of the council was up for election and the Conservative party kept overall control of the council
Loughton in Essex, England, was an urban district from 1900-1933, when it became part of Chigwell Urban District until 1974, when Epping Forest District Council Epping Forest (district) was created. Loughton Town Council was established in 1996. The Town Council consists of 22 Councillors representing seven wards, elected for a four-year term. The council adopted the designation Town Council just after its re-creation as a parish in 1996, and changed the title of its chairman to Town Mayor in 2004.
Robin Tilbrook is a solicitor and English politician, the chairman and a founder member of the English Democrats, a political party that advocates English independence.
The 2000 Wyre Forest District Council election took place on 4 May 2000 to elect members of Wyre Forest District Council in Worcestershire, England. One third of the council was up for election and the council stayed under no overall control.
The 2006 Wyre Forest District Council election took place on 4 May 2006 to elect members of Wyre Forest District Council in Worcestershire, England. One third of the council was up for election and the council stayed under no overall control.
The 2008 Wyre Forest District Council election took place on 1 May 2008 to elect members of Wyre Forest District Council in Worcestershire, England. One third of the council was up for election and the Conservative party gained overall control of the council from no overall control.
Local elections were held in the United Kingdom on 3 May 1979. The results provided some source of comfort to the Labour Party (UK), who recovered some lost ground from local election reversals in previous years, despite losing the general election to the Conservative Party on the same day.
The 2015 Epping Forest District Council election took place on 7 May 2015 to elect members of Epping Forest District Council in England. This was on the same day as other local elections.
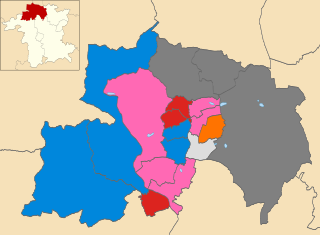
The 2012 Wyre Forest District Council election took place on 3 May 2012 to elect members of Wyre Forest District Council in Worcestershire, England. One third of the council was up for election and the Conservative party lost overall control of the council to no overall control.
The 2018 Epping Forest District Council election took place on 3 May 2018 to elect members of Epping Forest District Council in England. This was on the same day as other local elections.