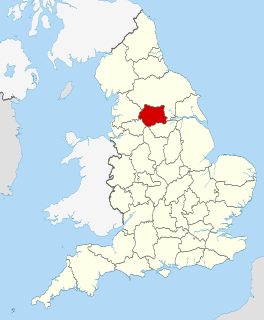
The 2008 Wakefield Metropolitan District Council election took place on 1 May 2008 to elect members of Wakefield Metropolitan District Council in West Yorkshire, England. One third of the council was up for election and the Labour party stayed in overall control of the council. [1]
West Yorkshire is a metropolitan county in England. It is an inland and in relative terms upland county having eastward-draining valleys while taking in moors of the Pennines and has a population of 2.2 million. West Yorkshire came into existence as a metropolitan county in 1974 after the passage of the Local Government Act 1972.
England is a country that is part of the United Kingdom. It shares land borders with Wales to the west and Scotland to the north-northwest. The Irish Sea lies west of England and the Celtic Sea lies to the southwest. England is separated from continental Europe by the North Sea to the east and the English Channel to the south. The country covers five-eighths of the island of Great Britain, which lies in the North Atlantic, and includes over 100 smaller islands, such as the Isles of Scilly and the Isle of Wight.
The Labour Party is a centre-left political party in the United Kingdom which has been described as an alliance of social democrats, democratic socialists and trade unionists. The party's platform emphasises greater state intervention, social justice and strengthening workers' rights.
After the election, the composition of the council was
The Conservative Party, officially the Conservative and Unionist Party, is a centre-right political party in the United Kingdom. The governing party since 2010, it is the largest in the House of Commons, with 313 Members of Parliament, and also has 249 members of the House of Lords, 18 members of the European Parliament, 31 Members of the Scottish Parliament, 12 members of the Welsh Assembly, eight members of the London Assembly and 8,916 local councillors.
The Liberal Democrats are a liberal political party in the United Kingdom. They have 11 Members of Parliament in the House of Commons, 96 members of the House of Lords, one member of the European Parliament, five Members of the Scottish Parliament and one member in the Welsh Assembly and London Assembly. At the height of its influence, the party formed a coalition government with the Conservative Party from 2010 to 2015 with its leader Nick Clegg serving as Deputy Prime Minister. It is currently led by Sir Vince Cable.
Before the election there was disagreement among commentators about how safe Wakefield council was for Labour. The Daily Telegraph felt Labour would struggle to remain in control, but the Yorkshire Post believed it would remain safe for Labour. [3] [4]
The Daily Telegraph, commonly referred to simply as The Telegraph, is a national British daily broadsheet newspaper published in London by Telegraph Media Group and distributed across the United Kingdom and internationally. It was founded by Arthur B. Sleigh in 1855 as Daily Telegraph & Courier.
Wakefield council joined with other councils from Yorkshire to run a television advertising campaign in an attempt to increase turnout. [5]
Yorkshire, formally known as the County of York, is a historic county of Northern England and the largest in the United Kingdom. Due to its great size in comparison to other English counties, functions have been undertaken over time by its subdivisions, which have also been subject to periodic reform. Throughout these changes, Yorkshire has continued to be recognised as a geographical territory and cultural region. The name is familiar and well understood across the United Kingdom and is in common use in the media and the military, and also features in the titles of current areas of civil administration such as North Yorkshire, South Yorkshire, West Yorkshire and East Riding of Yorkshire.
Voter turnout is the percentage of eligible voters who cast a ballot in an election. Eligibility varies by country, and the voting-eligible population should not be confused with the total adult population. Age and citizenship status are often among the criteria used to determine eligibility, but some countries further restrict eligibility based on sex, race, or religion.
The results saw the Conservatives make 7 gains, all but one from Labour, and come up only one seat short of depriving Labour of their majority. [6] Altogether Labour lost 8 seats including 2 to independents, while the Liberal Democrats lost their only seat that was being contested in Ossett to the Conservatives. [7] Labour losses included the mayor, Allan Garbutt, and the cabinet member for children and young people, Trevor Izon, in Pontefract South. [7] Overall turnout was 32.28%. [8]
Ossett is a market town in within the metropolitan district of the City of Wakefield, West Yorkshire, England. Historically part of the West Riding of Yorkshire, it is halfway between Dewsbury, to the west, and Wakefield, to the east. At the 2011 Census, the population was 21,231.
A Cabinet is a body of high-ranking state officials, typically consisting of the top leaders of the executive branch. Members of a cabinet are usually called Cabinet ministers or secretaries. The function of a Cabinet varies: in some countries it is a collegiate decision-making body with collective responsibility, while in others it may function either as a purely advisory body or an assisting institution to a decision making head of state or head of government. Cabinets are typically the body responsible for the day-to-day management of the government and response to sudden events, whereas the legislative and judicial branches work in a measured pace, in sessions according to lengthy procedures.
Pontefract is a historic market town in West Yorkshire, England, near the A1 and the M62 motorway. Historically part of the West Riding of Yorkshire, it is one of the five towns in the metropolitan borough of the City of Wakefield and has a population of 28,250, increasing to 30,881 at the 2011 Census. Pontefract's motto is Post mortem patris pro filio, Latin for "After the death of the father, support the son", a reference to the English Civil War Royalist sympathies.
The Conservatives said that their victories were due both to the unpopularity of the national Labour government and due to the Labour council behaving in an arrogant way. [7] The results were seen by the Conservatives as an encouraging sign of how they would perform at the next general election in the Wakefield constituencies. [7] Meanwhile, Labour put their defeats down to national issues such as the abolition of the 10p rate of income tax and immigration. [7]
In the United Kingdom (UK), each of the electoral areas or divisions called constituencies elect one member to a parliament or assembly, with the exception of European Parliament and Northern Ireland Assembly constituencies which are multi member constituencies.
An income tax is a tax imposed on individuals or entities (taxpayers) that varies with respective income or profits. Income tax generally is computed as the product of a tax rate times taxable income. Taxation rates may vary by type or characteristics of the taxpayer.
Party | Seats | Gains | Losses | Net gain/loss | Seats % | Votes % | Votes | +/− | |
---|---|---|---|---|---|---|---|---|---|
Conservative | 11 | 7 | 0 | +7 | 50.0 | 34.3 | 28,506 | +4.3% | |
Labour | 8 | 0 | 8 | -8 | 36.4 | 35.1 | 29,168 | -3.9% | |
Independent | 3 | 2 | 0 | +2 | 13.6 | 12.0 | 9,978 | +1.8% | |
Liberal Democrat | 0 | 0 | 1 | -1 | 0 | 8.8 | 7,319 | -1.3% | |
BNP | 0 | 0 | 0 | 0 | 0 | 7.9 | 6,567 | -0.4% | |
Green | 0 | 0 | 0 | 0 | 0 | 1.2 | 1,024 | -0.2% | |
Socialist Alternative | 0 | 0 | 0 | 0 | 0 | 0.4 | 352 | +0.1% | |
UKIP | 0 | 0 | 0 | 0 | 0 | 0.2 | 145 | +0.0% | |
British Voice | 0 | 0 | 0 | 0 | 0 | 0.2 | 142 | -0.2% | |
Party | Candidate | Votes | % | ± | |
---|---|---|---|---|---|
Conservative | Richard Molloy | 1,653 | 43.2 | +13.5 | |
Labour | Allan Garbutt | 1,466 | 38.3 | +1.1 | |
Liberal Democrat | David Arthur | 709 | 18.5 | +4.1 | |
Majority | 187 | 4.9 | |||
Turnout | 3,828 | ||||
Conservative gain from Labour | Swing | ||||
Party | Candidate | Votes | % | ± | |
---|---|---|---|---|---|
Labour | Graham Phelps | 1,401 | 46.7 | -10.5 | |
BNP | Stephen Rogerson | 628 | 20.9 | +2.2 | |
Conservative | Mellisa Wan Omer | 540 | 18.0 | +5.3 | |
Liberal Democrat | Paul Kirby | 430 | 14.3 | +2.9 | |
Majority | 773 | 25.8 | -12.7 | ||
Turnout | 2,999 | ||||
Labour hold | Swing | ||||
Party | Candidate | Votes | % | ± | |
---|---|---|---|---|---|
Labour | Peter Box | 1,316 | 37.4 | -10.8 | |
Liberal Democrat | Michael Burch | 827 | 23.5 | +4.4 | |
Conservative | Gordon Tennant | 793 | 22.5 | +6.7 | |
BNP | Dawn Byrom | 585 | 16.6 | -0.2 | |
Majority | 489 | 13.9 | -15.2 | ||
Turnout | 3,521 | ||||
Labour hold | Swing | ||||
Party | Candidate | Votes | % | ± | |
---|---|---|---|---|---|
Labour | Mark Burns-Williamson | 1,775 | 54.1 | -9.3 | |
BNP | Rita Robinson | 854 | 26.1 | +3.4 | |
Conservative | Eamonn Mullins | 649 | 19.8 | +6.0 | |
Majority | 921 | 28.0 | -12.7 | ||
Turnout | 3,278 | ||||
Labour hold | Swing | ||||
Party | Candidate | Votes | % | ± | |
---|---|---|---|---|---|
Conservative | Susan Lodge | 1,783 | 40.4 | +6.3 | |
Labour | Albert Manifield | 1,730 | 39.2 | -6.9 | |
BNP | Dean Crossland | 902 | 20.4 | +0.6 | |
Majority | 53 | 1.2 | |||
Turnout | 4,415 | ||||
Conservative gain from Labour | Swing | ||||
Party | Candidate | Votes | % | ± | |
---|---|---|---|---|---|
Independent | Kay Binnersley | 1,974 | 45.8 | +4.3 | |
Labour | Dick Taylor | 1,872 | 43.4 | +4.9 | |
Conservative | Michael Ledgard | 464 | 10.8 | +5.5 | |
Majority | 102 | 2.4 | -0.6 | ||
Turnout | 4,310 | ||||
Independent hold | Swing | ||||
Party | Candidate | Votes | % | ± | |
---|---|---|---|---|---|
Independent | Ian Womersley | 1,695 | |||
Labour | Glyn Lloyd | 1,288 | |||
Labour | Sandra Pickin | 1,203 | |||
Independent | John Evans | 663 | |||
Independent | Maurice Kent | 503 | |||
BNP | Jeanette Womack | 400 | |||
Conservative | Christian l'Anson | 371 | |||
Conservative | Rebecca Mullins | 329 | |||
Turnout | 2,986 | ||||
Independent gain from Labour | Swing | ||||
Labour hold | Swing | ||||
Party | Candidate | Votes | % | ± | |
---|---|---|---|---|---|
Conservative | Graham Jesty | 1,845 | 40.1 | -2.6 | |
Labour | Janet Holmes | 1,657 | 36.0 | -2.0 | |
Independent | Susan Armitage | 576 | 12.5 | +12.5 | |
Liberal Democrat | David Rowland | 522 | 11.3 | -8.0 | |
Majority | 188 | 4.1 | -0.6 | ||
Turnout | 4,600 | ||||
Conservative gain from Labour | Swing | ||||
Party | Candidate | Votes | % | ± | |
---|---|---|---|---|---|
Labour | Graham Stokes | 1,417 | 56.7 | -4.8 | |
Conservative | Tom Dixon | 1,081 | 43.3 | +23.5 | |
Majority | 336 | 13.4 | -28.3 | ||
Turnout | 2,498 | ||||
Labour hold | Swing | ||||
Party | Candidate | Votes | % | ± | |
---|---|---|---|---|---|
Labour | Barry Smith | 1,037 | 31.8 | -8.2 | |
Conservative | Richard Wakefield | 784 | 24.0 | +12.4 | |
Independent | Graeme Milner | 699 | 21.4 | -3.5 | |
BNP | Adam Frazer | 520 | 15.9 | -0.1 | |
Liberal Democrat | Jack Smith | 221 | 6.8 | -0.7 | |
Majority | 253 | 7.8 | -7.3 | ||
Turnout | 3,261 | ||||
Labour hold | Swing | ||||
Party | Candidate | Votes | % | ± | |
---|---|---|---|---|---|
Conservative | Terry Brown | 1,709 | 37.9 | +12.4 | |
Liberal Democrat | Mark Goodair | 1,694 | 37.6 | +1.1 | |
Labour | David Watts | 1,105 | 24.5 | +0.2 | |
Majority | 15 | 0.3 | |||
Turnout | 4,508 | ||||
Conservative gain from Liberal Democrat | Swing | ||||
Party | Candidate | Votes | % | ± | |
---|---|---|---|---|---|
Conservative | Philip Thomas | 1,352 | 40.8 | -6.4 | |
Labour | Jack Kershaw | 1,323 | 39.9 | -12.9 | |
Independent | Bob Evison | 398 | 12.0 | +12.0 | |
Green | Rennie Smith | 240 | 7.2 | +7.2 | |
Majority | 29 | 0.9 | |||
Turnout | 3,313 | ||||
Conservative gain from Labour | Swing | ||||
Party | Candidate | Votes | % | ± | |
---|---|---|---|---|---|
Conservative | Mark Crowther | 2,340 | 48.8 | -1.0 | |
Labour | Trevor Izon | 1,801 | 37.6 | +0.2 | |
Liberal Democrat | Chris Rush | 650 | 13.6 | +0.8 | |
Majority | 539 | 11.2 | -1.2 | ||
Turnout | 4,791 | ||||
Conservative gain from Labour | Swing | ||||
Party | Candidate | Votes | % | ± | |
---|---|---|---|---|---|
Independent | Wilf Benson | 2,248 | 56.5 | +1.5 | |
Labour | Mollie Wright | 1,342 | 33.7 | -0.8 | |
Conservative | Allan Crouch | 389 | 9.8 | -0.7 | |
Majority | 906 | 22.8 | +2.3 | ||
Turnout | 3,979 | ||||
Independent gain from Labour | Swing | ||||
Party | Candidate | Votes | % | ± | |
---|---|---|---|---|---|
Conservative | Simon Wilson | 1,392 | 36.9 | +6.6 | |
Labour | Charles Keith | 1,112 | 29.5 | -6.4 | |
Liberal Democrat | David Evans | 661 | 17.5 | -0.7 | |
BNP | Loraine Frazer | 608 | 16.1 | +0.5 | |
Majority | 280 | 7.4 | |||
Turnout | 3,773 | ||||
Conservative gain from Labour | Swing | ||||
Party | Candidate | Votes | % | ± | |
---|---|---|---|---|---|
Labour | Ros Lund | 1,478 | 44.8 | -1.8 | |
Conservative | Mark Pickard | 1,022 | 31.0 | +8.5 | |
BNP | Robert Arnold | 447 | 13.5 | +1.9 | |
Socialist Alternative | Michael Griffiths | 352 | 10.7 | +3.7 | |
Majority | 456 | 13.8 | -10.3 | ||
Turnout | 3,299 | ||||
Labour hold | Swing | ||||
Party | Candidate | Votes | % | ± | |
---|---|---|---|---|---|
Labour | Elizabeth Rhodes | 1,177 | 34.7 | -1.9 | |
Conservative | Graham Ridler | 1,140 | 33.6 | +5.8 | |
Liberal Democrat | Andrew Tennant | 468 | 13.8 | -4.0 | |
BNP | Graham Thewlis-Hardy | 458 | 13.5 | +1.7 | |
UKIP | Keith Wells | 145 | 4.3 | +0.0 | |
Majority | 37 | 1.1 | -7.7 | ||
Turnout | 3,388 | ||||
Labour hold | Swing | ||||
Party | Candidate | Votes | % | ± | |
---|---|---|---|---|---|
Conservative | John Colley | 2,837 | 62.0 | +9.6 | |
Labour | Tony Richardson | 1,108 | 24.2 | -2.5 | |
Green | Miriam Hawkins | 628 | 13.7 | -0.5 | |
Majority | 1,729 | 37.8 | +12.1 | ||
Turnout | 4,573 | ||||
Conservative hold | Swing | ||||
Party | Candidate | Votes | % | ± | |
---|---|---|---|---|---|
Conservative | David Hopkins | 1,725 | 40.0 | -1.6 | |
Independent | Norman Hazell | 1,222 | 28.4 | +8.3 | |
Labour | Simon Young | 672 | 15.6 | -1.7 | |
Liberal Democrat | Stephen Nuthall | 369 | 8.6 | +1.4 | |
BNP | John Aveyard | 321 | 7.4 | +2.9 | |
Majority | 503 | 11.6 | -9.9 | ||
Turnout | 4,309 | ||||
Conservative hold | Swing | ||||
Party | Candidate | Votes | % | ± | |
---|---|---|---|---|---|
Conservative | Mike Walker | 2,479 | 60.2 | +5.3 | |
Labour | Matthew Morley | 738 | 17.9 | -3.2 | |
BNP | Neville Poynton | 348 | 8.5 | +8.5 | |
Liberal Democrat | Susan Morgan | 252 | 6.1 | -3.0 | |
Green | Brian Else | 156 | 3.8 | -3.1 | |
British Voice | Norman Tate | 142 | 3.5 | -4.6 | |
Majority | 1,741 | 42.3 | +8.5 | ||
Turnout | 4,115 | ||||
Conservative hold | Swing | ||||
Party | Candidate | Votes | % | ± | |
---|---|---|---|---|---|
Conservative | Annemarie Glover | 1,829 | 45.8 | +5.9 | |
Labour | Martyn Johnson | 1,150 | 28.8 | -6.8 | |
Liberal Democrat | Margaret Dodd | 516 | 12.9 | +0.5 | |
BNP | Grant Rowe | 496 | 12.4 | +0.2 | |
Majority | 679 | 17.0 | +12.7 | ||
Turnout | 3,991 | ||||
Conservative hold | Swing | ||||
The 1998 Wolverhampton Metropolitan Borough Council election took place on 7 May 1998 to elect members of Wolverhampton Metropolitan Borough Council in the West Midlands, England. One third of the council was up for election and the Labour party kept overall control of the council.
The 2007 Craven District Council election took place on 3 May 2007 to elect members of Craven District Council in North Yorkshire, England. One third of the council was up for election and the council stayed under no overall control.
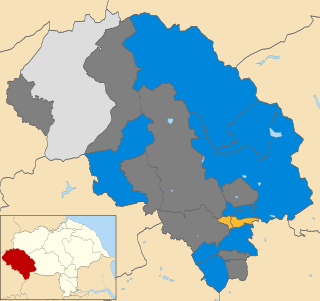
The 2008 Craven District Council election took place on 1 May 2008 to elect members of Craven District Council in North Yorkshire, England. One third of the council was up for election and the council stayed under no overall control.
Elections to Calderdale Metropolitan Borough Council were held on 3 May 2007 with the exception of the Warley ward which was postponed until 14 June 2007 due to the sudden death of one of the candidates. One third of the council was up for election and the council stayed under no overall control with a minority Conservative administration. The total turnout of the election was 38.01%. The winning candidate in each ward is highlighted in bold.
The 2003 Hull City Council election took place on 1 May 2003 to elect members of Hull City Council in England. One third of the council was up for election and the council stayed under no overall control.
The 2004 Hull City Council election took place on 10 June 2004 to elect members of Hull City Council in England. One third of the council was up for election and the council stayed under no overall control.
The 2006 Hull City Council election took place on 4 May 2006 to elect members of Hull City Council in England. One third of the council was up for election and the council stayed under no overall control. Overall turnout was 27.3%.
The 2007 Hull City Council election took place on 3 May 2007 to elect members of Hull City Council in England. One third of the council was up for election and the Liberal Democrats gained overall control of the council from no overall control. Overall turnout was 27%.
The 2000 Wakefield Metropolitan District Council election took place on 4 May 2000 to elect members of Wakefield Metropolitan District Council in West Yorkshire, England. One third of the council was up for election and the Labour party kept overall control of the council.
The 2002 Wakefield Metropolitan District Council election took place on 2 May 2002 to elect members of Wakefield Metropolitan District Council in West Yorkshire, England. One third of the council was up for election and the Labour party kept overall control of the council.
The 2003 Wakefield Metropolitan District Council election took place on 1 May 2003 to elect members of Wakefield Metropolitan District Council in West Yorkshire, England. One third of the council was up for election and the Labour party kept overall control of the council.
The 2004 Wakefield Metropolitan District Council election took place on 10 June 2004 to elect members of Wakefield Metropolitan District Council in West Yorkshire, England. The whole council was up for election with boundary changes since the last election in 2003. The Labour party stayed in overall control of the council.
The 2006 Wakefield Metropolitan District Council election took place on 4 May 2006 to elect members of Wakefield Metropolitan District Council in West Yorkshire, England. One third of the council was up for election and the Labour party kept overall control of the council.
The 2007 Wakefield Metropolitan District Council election took place on 3 May 2007 to elect members of Wakefield Metropolitan District Council in West Yorkshire, England. One third of the council was up for election and the Labour party kept overall control of the council.
The Leeds City Council election took place on 2 May 2002 to elect members of City of Leeds Metropolitan Borough Council in West Yorkshire, England. Prior to the election, there had been several by-elections held with no change to the council composition. One third of the council was up for election and the Labour party stayed in overall control of the council.
The Leeds City Council election took place on 1 May 2003 to elect members of City of Leeds Metropolitan Borough Council in West Yorkshire, England. One third of the council was up for election and the Labour party stayed in overall control of the council.
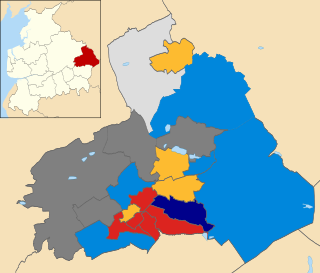
The 2008 Pendle Borough Council election took place on 1 May 2008 to elect members of Pendle Borough Council in Lancashire, England. One third of the council was up for election and the Liberal Democrats lost overall control of the council to no overall control.
The 2000 Sandwell Metropolitan Borough Council election took place on 4 May 2000 to elect members of Sandwell Metropolitan Borough Council in the West Midlands, England. One third of the council was up for election and the Labour party stayed in overall control of the council.
The 2011 Craven District Council election took place on 5 May 2011 to elect members of Craven District Council in North Yorkshire, England. One third of the council was up for election and the Conservative party stayed in overall control of the council.
The 2012 Craven District Council election took place on 3 May 2012 to elect members of Craven District Council in North Yorkshire, England. One third of the council was up for election and the Conservative party stayed in overall control of the council.