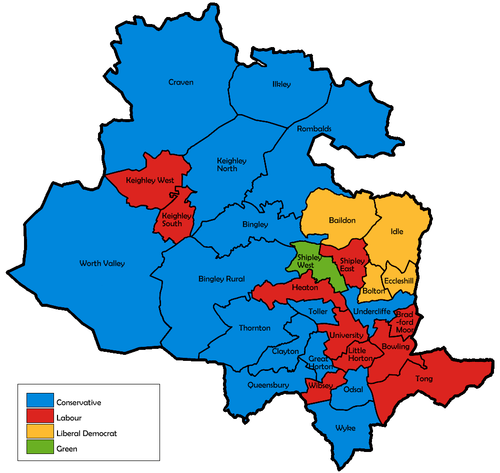
The City of Bradford Metropolitan District Council elections were held on Thursday, 4 May 2000, with one third of the council up for election. Labour lost control of the council to no overall control. [1] [2]
City of Bradford Metropolitan District Council is the local authority of the City of Bradford in West Yorkshire, England. It is a metropolitan district council, one of five in West Yorkshire and one of 36 in the metropolitan counties of England, and provides the majority of local government services in Bradford. Since 1 April 2014 it has been a constituent council of the West Yorkshire Combined Authority.
In the context of local authorities in the United Kingdom, the term no overall control refers to a situation in which no single political group achieves a majority of seats; and is analogous to a hung parliament. Of the 310 councils who had members up for election in the 2007 local elections, 85 resulted in a NOC administration.
Party | Seats | Gains | Losses | Net gain/loss | Seats % | Votes % | Votes | +/− | |
---|---|---|---|---|---|---|---|---|---|
Conservative | 15 | 11 | 0 | 50.0 | 43.7 | 45,422 | +4.0% | ||
Labour | 10 | 0 | 13 | 33.3 | 34.4 | 35,729 | -3.9% | ||
Liberal Democrat | 4 | 1 | 0 | 13.3 | 15.5 | 16,094 | -1.3% | ||
Green | 1 | 1 | 0 | 3.3 | 3.3 | 3,410 | +0.7% | ||
Independent | 0 | 0 | 0 | 0.0 | 2.9 | 2,980 | +0.4% | ||
Asian League | 0 | 0 | 0 | 0.0 | 0.2 | 195 | +0.2% | ||
Socialist Alternative | 0 | 0 | 0 | 0.0 | 0.1 | 97 | +0.1% | ||
This result had the following consequences for the total number of seats on the council after the elections:
Party | Previous council | New council | |||
---|---|---|---|---|---|
Labour | 54 | 41 | |||
Conservative | 26 | 37 | |||
Liberal Democrat | 10 | 11 | |||
Green | 0 | 1 | |||
Total | 90 | 90 | |||
Working majority | 18 | -8 |
Party | Candidate | Votes | % | ± | |
---|---|---|---|---|---|
Liberal Democrat | John Briggs | 1,982 | 46.5 | -8.4 | |
Conservative | Edward Christopher Ward | 1,699 | 39.9 | +9.7 | |
Labour | Carol Ann Jennings | 484 | 11.4 | -1.4 | |
Green | Kevin Robert Warnes | 95 | 2.2 | +0.1 | |
Majority | 283 | 6.6 | -18.1 | ||
Turnout | 4,260 | 35.0 | |||
Liberal Democrat hold | Swing | -9.0 | |||
Party | Candidate | Votes | % | ± | |
---|---|---|---|---|---|
Conservative | David Heseltine | 2,243 | 55.1 | +5.0 | |
Labour | Eileen Mary Sinclair | 1,399 | 34.3 | -3.4 | |
Liberal Democrat | Rebecca Anne Walter | 267 | 6.5 | -1.5 | |
Green | Muriel Winifred Thompson | 165 | 4.0 | -0.2 | |
Majority | 844 | 20.7 | +8.4 | ||
Turnout | 4,074 | 38.7 | |||
Conservative gain from Labour | Swing | +4.2 | |||
Party | Candidate | Votes | % | ± | |
---|---|---|---|---|---|
Conservative | Phyllis Vera Pettit | 2,479 | 65.9 | +3.4 | |
Labour | James Albert Newton | 824 | 21.9 | -3.9 | |
Liberal Democrat | Timothy Iain Mead | 322 | 8.5 | -0.6 | |
Green | Arthur Albert John Arnold | 139 | 3.7 | +1.1 | |
Majority | 1,655 | 44.0 | +7.4 | ||
Turnout | 3,764 | 31.7 | |||
Conservative hold | Swing | +3.6 | |||
Party | Candidate | Votes | % | ± | |
---|---|---|---|---|---|
Liberal Democrat | Howard Middleton | 1,675 | 57.3 | +3.4 | |
Labour | Peter Cheney | 628 | 21.5 | -5.2 | |
Conservative | Michael Thomas Looby | 618 | 21.2 | +1.9 | |
Majority | 1,047 | 35.8 | +8.6 | ||
Turnout | 2,921 | 28.3 | |||
Liberal Democrat hold | Swing | +4.3 | |||
Party | Candidate | Votes | % | ± | |
---|---|---|---|---|---|
Labour | John Ryan | 1,391 | 52.4 | -6.8 | |
Conservative | John Cecil David Hardy | 750 | 28.3 | +9.1 | |
Liberal Democrat | Julie Rosemary Harrington | 317 | 11.9 | -9.6 | |
Asian League | Farhan Hussain Khokhar | 195 | 7.4 | +7.4 | |
Majority | 641 | 24.2 | -13.6 | ||
Turnout | 2,653 | 21.5 | |||
Labour hold | Swing | -7.9 | |||
Party | Candidate | Votes | % | ± | |
---|---|---|---|---|---|
Labour | Ghazanfer Khaliq | 1,827 | 56.1 | +21.8 | |
Conservative | Asad Mercury Malik | 1,128 | 34.6 | -22.8 | |
Liberal Democrat | James E Mangeolles | 302 | 9.3 | +1.0 | |
Majority | 699 | 21.5 | -1.7 | ||
Turnout | 3,257 | 30.4 | |||
Labour hold | Swing | +22.3 | |||
Party | Candidate | Votes | % | ± | |
---|---|---|---|---|---|
Conservative | Charles Malcolm Sykes | 1,561 | 53.4 | +3.9 | |
Labour | Gillian Margaret Whitfield | 973 | 33.3 | -3.4 | |
Liberal Democrat | Edward John Hallmann | 297 | 10.2 | -1.0 | |
Green | Alexander Suchi | 92 | 3.1 | +0.4 | |
Majority | 588 | 20.1 | +7.3 | ||
Turnout | 2,923 | 28.3 | |||
Conservative gain from Labour | Swing | +3.6 | |||
Party | Candidate | Votes | % | ± | |
---|---|---|---|---|---|
Conservative | David Keith James Harrison | 2,059 | 49.9 | +6.4 | |
Independent | Christopher Michael Atkinson | 993 | 24.1 | -0.4 | |
Labour | Benita Eileen Smith | 779 | 18.9 | -1.7 | |
Liberal Democrat | Hamish Gordon Hay | 293 | 7.1 | -4.4 | |
Majority | 1,066 | 25.8 | +6.8 | ||
Turnout | 4,124 | 33.0 | |||
Conservative hold | Swing | +3.4 | |||
Party | Candidate | Votes | % | ± | |
---|---|---|---|---|---|
Liberal Democrat | Alun Own Griffiths | 1,002 | 38.1 | +0.1 | |
Labour | Susanne Rooney | 851 | 32.3 | -0.7 | |
Conservative | James Ralph Ryder | 780 | 29.6 | +0.6 | |
Majority | 222 | 5.7 | +0.7 | ||
Turnout | 2,633 | 27.7 | |||
Liberal Democrat gain from Labour | Swing | +0.4 | |||
Party | Candidate | Votes | % | ± | |
---|---|---|---|---|---|
Conservative | Moira Crabtree | 1,358 | 43.0 | +4.3 | |
Labour | Geoffrey Green | 1,294 | 41.0 | -5.1 | |
Liberal Democrat | Colin Wright | 292 | 9.2 | -1.9 | |
Independent | Mohd Afzal | 212 | 6.7 | +6.7 | |
Majority | 64 | 2.0 | -5.4 | ||
Turnout | 3,156 | 28.2 | |||
Conservative gain from Labour | Swing | +4.7 | |||
Party | Candidate | Votes | % | ± | |
---|---|---|---|---|---|
Labour | Andrew Craig Pitts | 2,046 | 47.6 | +4.1 | |
Conservative | John Antony Robertshaw | 1,747 | 40.6 | -2.2 | |
Green | Helen Theyer Kemp | 257 | 6.0 | +6.0 | |
Liberal Democrat | Hugh Alaric Tooby | 248 | 5.8 | -7.8 | |
Majority | 299 | 7.0 | +6.3 | ||
Turnout | 4,298 | 35.6 | |||
Labour hold | Swing | +3.1 | |||
Party | Candidate | Votes | % | ± | |
---|---|---|---|---|---|
Liberal Democrat | David Ward | 1,732 | 48.7 | -8.4 | |
Conservative | Philip Sweeney Kirkpatrick | 1,068 | 30.1 | +11.3 | |
Labour | Gareth David Logan | 753 | 21.2 | -2.9 | |
Majority | 664 | 18.7 | -14.3 | ||
Turnout | 3,553 | 30.0 | |||
Liberal Democrat hold | Swing | -9.8 | |||
Party | Candidate | Votes | % | ± | |
---|---|---|---|---|---|
Conservative | Colin George Powell | 2,633 | 65.0 | +5.4 | |
Liberal Democrat | James Francis Keeley | 758 | 18.7 | +4.3 | |
Labour | Talib Hussain | 658 | 16.2 | -9.6 | |
Majority | 1,875 | 46.3 | +12.6 | ||
Turnout | 4,049 | 36.7 | |||
Conservative hold | Swing | +0.5 | |||
Party | Candidate | Votes | % | ± | |
---|---|---|---|---|---|
Conservative | Andrew Charles Mallinson | 1,932 | 49.7 | +13.5 | |
Labour | Alexander James MacPherson | 1,531 | 39.4 | -15.4 | |
Liberal Democrat | Judith Brooksbank | 424 | 10.9 | +1.9 | |
Majority | 401 | 10.3 | -8.4 | ||
Turnout | 3,887 | 35.1 | |||
Conservative gain from Labour | Swing | +14.4 | |||
Party | Candidate | Votes | % | ± | |
---|---|---|---|---|---|
Labour | Stephen Thomas | 1,363 | 58.2 | -9.3 | |
Conservative | Mark Francis Startin | 690 | 29.5 | +7.4 | |
Liberal Democrat | Ian James Inness | 289 | 12.3 | +1.8 | |
Majority | 673 | 28.7 | -16.7 | ||
Turnout | 2,342 | 25.1 | |||
Labour hold | Swing | -8.3 | |||
Party | Candidate | Votes | % | ± | |
---|---|---|---|---|---|
Labour | Andrew Geoffrey Mudd | 1,583 | 41.7 | -1.6 | |
Conservative | Arshed Majeed | 1,209 | 31.8 | +0.2 | |
Independent | Brian Hudson | 677 | 17.8 | +0.1 | |
Liberal Democrat | Tracy Lorraine Keeley | 328 | 8.6 | +1.2 | |
Majority | 374 | 9.8 | -1.8 | ||
Turnout | 3,797 | 32.3 | |||
Labour hold | Swing | -0.9 | |||
Party | Candidate | Votes | % | ± | |
---|---|---|---|---|---|
Labour | Sher Khan | 1,474 | 50.5 | -9.2 | |
Conservative | Jamshed Khan | 1,091 | 37.4 | +10.5 | |
Liberal Democrat | John Brian Massen | 217 | 7.4 | -2.1 | |
Green | Brian Richard Ford | 136 | 4.7 | +2.4 | |
Majority | 383 | 13.1 | -19.7 | ||
Turnout | 2,918 | 26.7 | |||
Labour hold | Swing | -9.8 | |||
Party | Candidate | Votes | % | ± | |
---|---|---|---|---|---|
Conservative | Gordon Johnson | 1,257 | 42.6 | +8.9 | |
Labour | James O'Neill | 1,239 | 42.0 | -9.6 | |
Liberal Democrat | Brian James Boulton | 451 | 15.3 | +0.7 | |
Majority | 18 | 0.6 | -17.2 | ||
Turnout | 2,947 | 24.2 | |||
Conservative gain from Labour | Swing | +9.2 | |||
Party | Candidate | Votes | % | ± | |
---|---|---|---|---|---|
Conservative | Michael Walls | 1,802 | 54.6 | +6.0 | |
Labour | Gordon Winter | 974 | 29.5 | -8.3 | |
Liberal Democrat | Susan Elizabeth Lambert | 264 | 8.0 | -2.3 | |
Independent | George Frank Riseborough | 162 | 4.9 | +1.6 | |
Green | Derek Curtis | 98 | 3.0 | +3.0 | |
Majority | 828 | 25.1 | +14.3 | ||
Turnout | 3,300 | 26.1 | |||
Conservative gain from Labour | Swing | +7.1 | |||
Party | Candidate | Votes | % | ± | |
---|---|---|---|---|---|
Conservative | Dale Smith | 2,799 | 61.8 | +7.5 | |
Labour | David Leslie Anderson | 975 | 21.5 | -2.4 | |
Liberal Democrat | John Hall | 757 | 16.7 | -5.1 | |
Majority | 1,824 | 40.3 | +9.8 | ||
Turnout | 4,531 | 35.8 | |||
Conservative hold | Swing | +4.9 | |||
Party | Candidate | Votes | % | ± | |
---|---|---|---|---|---|
Labour | Phillip Thornton | 1,300 | 53.8 | +0.8 | |
Conservative | Michael Bryn Allcock | 607 | 25.1 | +3.8 | |
Liberal Democrat | Michael Pollard | 410 | 17.0 | -3.9 | |
Green | Martin John Love | 101 | 4.2 | -0.8 | |
Majority | 693 | 28.7 | -3.0 | ||
Turnout | 2,418 | 23.8 | |||
Labour hold | Swing | -1.5 | |||
Party | Candidate | Votes | % | ± | |
---|---|---|---|---|---|
Green | David Michael Ford | 1,859 | 37.0 | +7.3 | |
Conservative | David John Servant | 1,256 | 32.6 | -0.9 | |
Labour | James Robert Flood | 1,256 | 25.0 | -5.8 | |
Liberal Democrat | Ronald Craig | 266 | 5.3 | -0.6 | |
Majority | 220 | 4.4 | +1.6 | ||
Turnout | 5,020 | 43.4 | |||
Green gain from Labour | Swing | +4.1 | |||
Party | Candidate | Votes | % | ± | |
---|---|---|---|---|---|
Conservative | Valerie Binney | 1,810 | 67.5 | +9.9 | |
Labour | Munir Ahmed | 390 | 14.5 | -14.2 | |
Liberal Democrat | Helen Wright | 370 | 13.8 | +3.3 | |
Green | Michael Anthony Rawnsley | 112 | 4.2 | +1.0 | |
Majority | 1,420 | 52.9 | +24.1 | ||
Turnout | 2,682 | 27.9 | |||
Conservative gain from Labour | Swing | +12.0 | |||
Party | Candidate | Votes | % | ± | |
---|---|---|---|---|---|
Conservative | Arshad Hussain | 2,639 | 47.5 | +4.6 | |
Labour | Imran Hussain | 2,506 | 45.1 | -3.6 | |
Liberal Democrat | Christine Reid | 416 | 7.5 | -0.9 | |
Majority | 133 | 2.4 | -3.4 | ||
Turnout | 5,561 | 45.9 | |||
Conservative gain from Labour | Swing | +4.1 | |||
Party | Candidate | Votes | % | ± | |
---|---|---|---|---|---|
Labour | James Anthony Cairns | 800 | 50.8 | -10.6 | |
Conservative | John Arthur Stead | 567 | 36.0 | +12.4 | |
Liberal Democrat | Adrian Hugh Cruden | 207 | 13.1 | -1.8 | |
Majority | 233 | 14.8 | -23.0 | ||
Turnout | 1,574 | 16.5 | |||
Labour hold | Swing | -11.5 | |||
Party | Candidate | Votes | % | ± | |
---|---|---|---|---|---|
Conservative | Intkhab Alam | 1,203 | 40.5 | +9.3 | |
Labour | S. Barnbrook | 927 | 31.2 | -15.2 | |
Liberal Democrat | Brian Moore | 727 | 24.4 | +8.0 | |
Green | Steven Schofield | 116 | 3.9 | -2.0 | |
Majority | 276 | 9.3 | -5.9 | ||
Turnout | 2,973 | ||||
Conservative gain from Labour | Swing | +12.2 | |||
Party | Candidate | Votes | % | ± | |
---|---|---|---|---|---|
Labour | Sajawal Hussain | 2,202 | 44.4 | +3.8 | |
Conservative | Tariq Mahmood | 2,183 | 44.0 | -2.9 | |
Green | John Edward Robinson | 240 | 4.8 | -0.7 | |
Liberal Democrat | Margaret Isobel Chadwick | 237 | 4.8 | -0.2 | |
Socialist Alternative | Sajjad Hussain Shah | 97 | 2.0 | +2.0 | |
Majority | 19 | 0.4 | -6.0 | ||
Turnout | 4,959 | 31.3 | |||
Labour hold | Swing | +3.3 | |||
Party | Candidate | Votes | % | ± | |
---|---|---|---|---|---|
Labour | Valerie McMath | 1,378 | 49.0 | -0.3 | |
Conservative | Richard Ian Sheard | 1,101 | 39.2 | +2.1 | |
Liberal Democrat | Shauna Ann Devonshire | 332 | 11.8 | -1.8 | |
Majority | 277 | 9.8 | -2.5 | ||
Turnout | 2,811 | 28.9 | |||
Labour hold | Swing | -1.2 | |||
Party | Candidate | Votes | % | ± | |
---|---|---|---|---|---|
Conservative | Paul Michael Barker | 1,703 | 43.5 | +6.2 | |
Labour | John Cope | 1,048 | 26.8 | -1.1 | |
Independent | David Samuels | 936 | 23.9 | +1.1 | |
Liberal Democrat | Samuel E Harris | 228 | 5.8 | -6.2 | |
Majority | 655 | 16.7 | +7.3 | ||
Turnout | 3,915 | 33.7 | |||
Conservative gain from Labour | Swing | -3.6 | |||
Party | Candidate | Votes | % | ± | |
---|---|---|---|---|---|
Conservative | Robert Philip Andrew Reynolds | 1,067 | 40.6 | +1.6 | |
Labour | Anthony Niland | 876 | 33.3 | -9.8 | |
Liberal Democrat | Kevin Anthony Hall | 684 | 26.0 | +8.3 | |
Majority | 191 | 7.3 | +3.2 | ||
Turnout | 2,627 | 22.1 | |||
Conservative gain from Labour | Swing | +5.7 | |||
Party | Candidate | Votes | % | ± | |
---|---|---|---|---|---|
Labour | Tony Niland | 1,014 | 44.0 | -8.4 | |
Conservative | Zameer Shah | 777 | 33.7 | +5.4 | |
Liberal Democrat | Rupert Oliver | 473 | 20.5 | +8.6 | |
Majority | 237 | 10.3 | -13.9 | ||
Turnout | 2,264 | 18.6 | -2.9 | ||
Labour hold | Swing | -6.9 | |||
Party | Candidate | Votes | % | ± | |
---|---|---|---|---|---|
Labour | Geoffrey Green | 3,217 | 45.5 | +16.0 | |
Conservative | 2,744 | 38.8 | -15.8 | ||
Liberal Democrat | 892 | 12.6 | -4.6 | ||
Independent | 203 | 2.9 | -2.0 | ||
Asian League | 13 | 0.2 | +0.2 | ||
Majority | 473 | 6.7 | -18.4 | ||
Turnout | 7,069 | 53.3 | +27.2 | ||
Labour hold | Swing | +15.9 | |||
Party | Candidate | Votes | % | ± | |
---|---|---|---|---|---|
Conservative | Juliette Kinsey | 1,576 | 65.2 | -0.7 | |
Labour | James Newton | 642 | 26.6 | +4.7 | |
Liberal Democrat | James Stewart | 150 | 6.2 | -2.4 | |
Green | John Love | 50 | 2.1 | -1.9 | |
Majority | 934 | 38.6 | -5.4 | ||
Turnout | 2,418 | 20.0 | -11.7 | ||
Conservative hold | Swing | -2.7 | |||
One third of City of Bradford Metropolitan District Council is elected each year, followed by one year without election.
One third of Harrogate Borough Council in North Yorkshire, England is elected each year, followed by one year without election. Since the last boundary changes in 2002, 54 councillors have been elected from 35 wards.
One third of Basingstoke and Deane Borough Council in Hampshire, England is elected each year, followed by one year without election. Since the last boundary changes in 2008, 60 councillors have been elected from 30 wards.
Bracknell Forest is a unitary authority in Berkshire, England. Until 1 April 1998 it was a non-metropolitan district.
Broxtowe Borough Council in Nottinghamshire, England is elected every four years. The Conservative party held overall control of the council from its foundation in 1973 until 1995 when the Labour party took control. Boundary changes took place for the 2003 election reducing the number of seats by five. The election saw Labour lose overall control of the council. Since 2003 the council has been under no overall control with Labour and the Liberal Democrats sharing power.
The City of Bradford Metropolitan District Council elections were held on Thursday, 7 May 1998, with one third of the council up for election. Since the previous election there had been a number of by-elections resulting in two Labour defenses and a Conservative gain in Heaton, due to be defended at this election. Labour retained control of the council.
The 1998 Leeds City Council election took place on 7 May 1998 to elect members of City of Leeds Metropolitan Borough Council in West Yorkshire, England. One third of the council, alongside a vacancy in Wortley were up for election.
The 1999 Leeds City Council election took place on 6 May 1999 to elect members of City of Leeds Metropolitan Borough Council in West Yorkshire, England. One third of the council was up for election, as well as a vacancy each in Horsforth, Moortown and Wetherby. Prior to the election, the Liberal Democrats had gained a seat in Bramley from Labour, and Hunslet councillor, Mark Davies, had defected from Labour to Independent Socialist.
The Leeds City Council election took place on 4 May 2000 to elect members of City of Leeds Metropolitan Borough Council in West Yorkshire, England. Since the last election, Labour had lost a by-election to the Lib Dems in Harehills, and long-serving Chapel Allerton councillor, Garth Frankland, had defected from Labour to Left Alliance. One third of the council was up for election and the Labour party stayed in overall control of the council. Overall turnout in the election was 27.5%.
Elections to Manchester Council were held on Thursday, 6 May 1999. One third of the council was up for election, as well as a vacancy in Chorlton, with each successful candidate to serve a four-year term of office, expiring in 2003. The two Independent Labour candidates stood as "Peace 2000 England's Republic", a slight alteration on the previous year's "Labour Peace 2000". Overall turnout was up marginally from the previous year at 21.9%. The Labour Party retained overall control of the Council.
Elections to Manchester Council were held on Thursday, 4 May 2000. One third of the council was up for election, with each successful candidate to serve a four-year term of office, expiring in 2004. The two Independent Labour candidates stood again as "Peace 2000 England's Republican". Overall turnout fell slightly to 20.5% and the Labour Party retained overall control of the council.
The 1999 Barnsley Metropolitan Borough Council election took place on 6 May 1999 to elect members of Barnsley Metropolitan Borough Council in South Yorkshire, England. Prior to the election, the Liberal Democrats had gained a seat in Wombwell North from Labour. One third of the council was up for election and the Labour party stayed in overall control of the council.
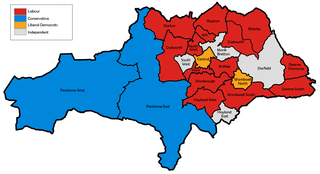
The 2000 Barnsley Metropolitan Borough Council election took place on 4 May 2000 to elect members of Barnsley Metropolitan Borough Council in South Yorkshire, England. Prior to the election, Labour has suffered a by-election loss in South West and two defections to Independent. One third of the council was up for election and the Labour party stayed in overall control of the council.
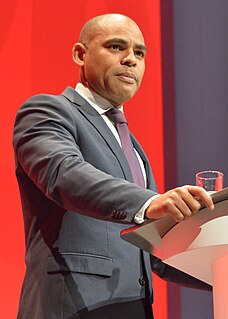
The Mayor of Bristol is the head of Bristol City Council. The Mayor is an elected politician who, along with the 70 members of Bristol City Council, is responsible for the strategic government of the city of Bristol, England. The role was created after a local referendum held on 3 May 2012, which followed the passage of the Localism Act 2011. 41,032 voted for an elected mayor and 35,880 voted against, with a turnout of 24%. An election for the new post was held on 15 November 2012.
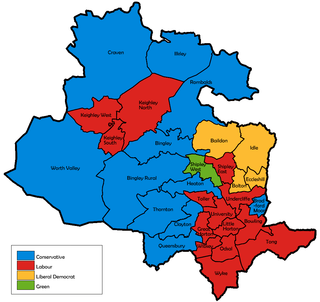
Elections to City of Bradford Metropolitan District Council were held on 2 May 2002. One third of the council was up for election, and it remained under no overall control.
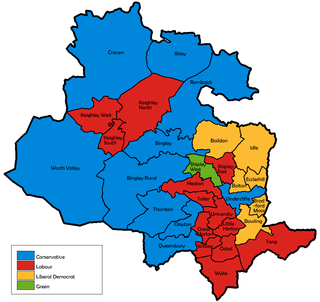
Elections to City of Bradford Metropolitan District Council were held on 1 May 2003. Before the election, Wibsey Labour councillor, Keith Thomson, had defected to Independent. One third of the council was up for election, and it remained under no overall control.
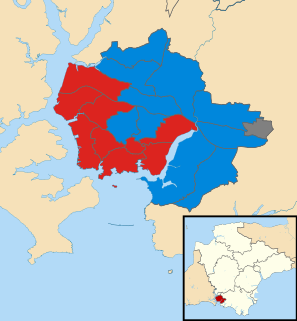
The 2015 Plymouth City Council election took place on 7 May 2015 to elect members of Plymouth City Council in England.
The City of Bradford Metropolitan District Council elections were held on Thursday, 4 May 1995, with one third of the council up for election. Prior to the election there had been a by-election in Tong after incumbent Labour councillor, Gerry Sutcliffe, was selected as their candidate for the Bradford South by-election, which Labour successfully defended. Labour retained control of the council.
The City of Bradford Metropolitan District Council elections were held on Thursday, 2 May 1996, with one third of the council up for election. Labour retained control of the council.
Elections to City of Bradford Metropolitan District Council were held on 10 June 2004. The whole council was up for election following boundary changes. The council stayed under no overall control.