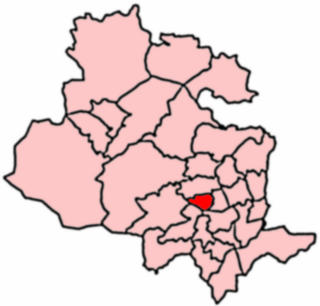
Elections to City of Bradford Metropolitan District Council were held on 2 May 2002. One third of the council was up for election, and it remained under no overall control. [1] [2]
City of Bradford Metropolitan District Council is the local authority of the City of Bradford in West Yorkshire, England. It is a metropolitan district council, one of five in West Yorkshire and one of 36 in the metropolitan counties of England, and provides the majority of local government services in Bradford. Since 1 April 2014 it has been a constituent council of the West Yorkshire Combined Authority.
Party | Seats | Gains | Losses | Net gain/loss | Seats % | Votes % | Votes | +/− | |
---|---|---|---|---|---|---|---|---|---|
Labour | 14 | 1 | 4 | 46.7 | 38.4 | 46,788 | +4.0% | ||
Conservative | 11 | 3 | 2 | 36.7 | 38.5 | 46,837 | -5.2% | ||
Liberal Democrat | 4 | 1 | 0 | 13.3 | 16.6 | 20,178 | +1.1% | ||
Green | 1 | 1 | 0 | 3.3 | 3.9 | 4,775 | +0.6% | ||
Independent | 0 | 0 | 0 | 0.0 | 2.0 | 2,430 | -0.9% | ||
BNP | 0 | 0 | 0 | 0.0 | 0.4 | 486 | +0.4% | ||
Socialist Alliance | 0 | 0 | 0 | 0.0 | 0.2 | 257 | +0.1% | ||
This result had the following consequences for the total number of seats on the council after the elections:
Party | Previous council | New council | |||
---|---|---|---|---|---|
Labour | 41 | 38 | |||
Conservative | 37 | 38 | |||
Liberal Democrat | 11 | 12 | |||
Green | 1 | 2 | |||
Total | 90 | 90 | |||
Working majority | -8 | -14 |
Party | Candidate | Votes | % | ± | |
---|---|---|---|---|---|
Liberal Democrat | Alastair Thornton | 2,399 | 48.6 | +2.1 | |
Conservative | Edward Ward | 1,942 | 39.3 | -0.5 | |
Labour | Isa Khan | 405 | 8.2 | -3.2 | |
Green | Kevin Warnes | 192 | 3.9 | +1.7 | |
Majority | 457 | 9.2 | +2.6 | ||
Turnout | 4,944 | 40.5 | +5.5 | ||
Liberal Democrat hold | Swing | +1.3 | |||
Party | Candidate | Votes | % | ± | |
---|---|---|---|---|---|
Conservative | Colin Gill | 2,265 | 51.1 | -3.9 | |
Labour | Frank Needham | 1,471 | 33.2 | -1.1 | |
Liberal Democrat | Alan Sykes | 428 | 9.7 | +3.1 | |
Green | Arthur Arnold | 264 | 6.0 | +1.9 | |
Majority | 794 | 17.9 | -2.8 | ||
Turnout | 4,438 | 42.0 | +3.3 | ||
Conservative hold | Swing | -1.4 | |||
Party | Candidate | Votes | % | ± | |
---|---|---|---|---|---|
Conservative | Margaret Eaton | 2,733 | 62.9 | -3.0 | |
Labour | David Brown | 1,032 | 23.7 | +1.9 | |
Liberal Democrat | Laura Cole | 362 | 8.3 | -0.2 | |
Green | John Francis Love | 218 | 5.0 | +1.3 | |
Majority | 1,701 | 39.1 | -4.8 | ||
Turnout | 4,350 | 37.0 | +5.3 | ||
Conservative hold | Swing | -2.4 | |||
Party | Candidate | Votes | % | ± | |
---|---|---|---|---|---|
Liberal Democrat | Allan Hillary | 2,317 | 62.7 | +5.4 | |
Labour | Jagtar Deol | 770 | 20.8 | -0.6 | |
Conservative | John Robertshaw | 606 | 16.4 | -4.7 | |
Majority | 1,547 | 41.9 | +6.1 | ||
Turnout | 3,711 | 36.6 | +8.3 | ||
Liberal Democrat hold | Swing | +3.0 | |||
Party | Candidate | Votes | % | ± | |
---|---|---|---|---|---|
Labour | Anthony Niland | 1,683 | 45.2 | -7.2 | |
Liberal Democrat | Rupert Oliver | 1,163 | 31.2 | +19.3 | |
Conservative | Habib-Ur Rehman | 876 | 23.5 | -4.7 | |
Majority | 520 | 14.0 | -10.2 | ||
Turnout | 3,747 | 31.7 | +10.2 | ||
Labour hold | Swing | -13.2 | |||
Party | Candidate | Votes | % | ± | |
---|---|---|---|---|---|
Conservative | Azhar Mahmood | 2,159 | 46.6 | +12.0 | |
Labour | Susanne Rooney | 1,952 | 42.1 | -14.0 | |
Liberal Democrat | Raihanna Ismail | 522 | 11.3 | +2.0 | |
Majority | 207 | 4.5 | -17.0 | ||
Turnout | 4,658 | 43.7 | +13.3 | ||
Conservative gain from Labour | Swing | +13.0 | |||
Party | Candidate | Votes | % | ± | |
---|---|---|---|---|---|
Conservative | David John Servant | 1,454 | 44.1 | -9.3 | |
Labour | Olayemi Fagborun | 1,192 | 36.1 | +2.9 | |
Liberal Democrat | Lorna Leeming | 513 | 15.6 | +5.4 | |
Green | Alexander Suchi | 138 | 4.2 | +1.0 | |
Majority | 262 | 7.9 | -12.2 | ||
Turnout | 3,304 | 32.4 | +4.1 | ||
Conservative gain from Labour | Swing | -6.1 | |||
Party | Candidate | Votes | % | ± | |
---|---|---|---|---|---|
Conservative | Eric Dawson | 2,358 | 54.9 | +4.9 | |
Labour | Francis Harrison | 1,364 | 31.7 | +12.8 | |
Liberal Democrat | Ambrose Micklem | 576 | 13.4 | +6.3 | |
Majority | 994 | 23.1 | -2.7 | ||
Turnout | 4,304 | 34.5 | +1.5 | ||
Conservative hold | Swing | -3.9 | |||
Party | Candidate | Votes | % | ± | |
---|---|---|---|---|---|
Liberal Democrat | Dorothy Ann Wallace | 1,087 | 32.9 | -5.2 | |
Labour | Gareth Logan | 1,045 | 31.6 | -0.7 | |
Conservative | Richard Sheard | 598 | 18.1 | -11.5 | |
BNP | Arthur Bentley | 486 | 14.7 | +14.7 | |
Independent | Audrey Raistrick | 90 | 2.7 | +2.7 | |
Majority | 42 | 1.3 | -4.5 | ||
Turnout | 3,310 | 35.9 | +8.2 | ||
Liberal Democrat gain from Labour | Swing | -2.2 | |||
Party | Candidate | Votes | % | ± | |
---|---|---|---|---|---|
Labour | Paul Flowers | 2,051 | 55.5 | +14.5 | |
Conservative | Jonathan Stubbs | 1,125 | 30.4 | -12.6 | |
Liberal Democrat | James Mangeolles | 310 | 8.4 | -0.9 | |
Green | Derek Curtis | 209 | 5.7 | +5.7 | |
Majority | 926 | 25.1 | +23.0 | ||
Turnout | 3,698 | 34.0 | +5.8 | ||
Labour hold | Swing | +13.5 | |||
Party | Candidate | Votes | % | ± | |
---|---|---|---|---|---|
Conservative | John Stanley King | 2,380 | 46.7 | +6.0 | |
Labour | Imran Ahmed Khan | 2,032 | 39.9 | -7.7 | |
Liberal Democrat | Helen Wright | 346 | 6.8 | +1.0 | |
Green | Helen Kemp | 271 | 5.3 | -0.7 | |
Socialist Alliance | Howard Miles | 68 | 1.3 | +1.3 | |
Majority | 348 | 6.8 | -0.1 | ||
Turnout | 5,104 | 43.0 | +7.4 | ||
Conservative hold | Swing | +6.8 | |||
Party | Candidate | Votes | % | ± | |
---|---|---|---|---|---|
Liberal Democrat | Jeanette Sunderland | 2,192 | 50.3 | +1.5 | |
Conservative | Philip Kirkpatrick | 1,228 | 28.2 | -1.9 | |
Labour | Mark Fieldhouse | 941 | 21.6 | +0.4 | |
Majority | 964 | 22.1 | +3.4 | ||
Turnout | 4,377 | 35.6 | +5.6 | ||
Liberal Democrat hold | Swing | +1.7 | |||
Party | Candidate | Votes | % | ± | |
---|---|---|---|---|---|
Conservative | Anne Hawkesworth | 3,048 | 64.2 | -0.8 | |
Labour | Paul Dutton | 1,109 | 23.4 | +7.1 | |
Liberal Democrat | Carsten Svensgaard | 587 | 12.4 | -6.3 | |
Majority | 1,939 | 40.9 | -5.4 | ||
Turnout | 4,478 | 43.0 | +6.3 | ||
Conservative hold | Swing | -3.9 | |||
Party | Candidate | Votes | % | ± | |
---|---|---|---|---|---|
Labour | Maxine Hepworth | 1,933 | 47.8 | +8.4 | |
Conservative | Mark Startin | 1,661 | 41.1 | -8.6 | |
Liberal Democrat | James Main | 450 | 11.1 | +0.2 | |
Majority | 272 | 6.7 | -3.6 | ||
Turnout | 4,059 | 37.1 | +2.0 | ||
Labour hold | Swing | +8.5 | |||
Party | Candidate | Votes | % | ± | |
---|---|---|---|---|---|
Labour | John Prestage | 1,640 | 62.4 | +4.2 | |
Conservative | David McKay | 696 | 26.5 | -3.0 | |
Liberal Democrat | Edward Hallmann | 292 | 11.1 | -1.2 | |
Majority | 944 | 35.9 | +7.2 | ||
Turnout | 2,653 | 29.8 | +4.7 | ||
Labour hold | Swing | +3.6 | |||
Party | Candidate | Votes | % | ± | |
---|---|---|---|---|---|
Labour | Irene Ellison-Wood | 1,715 | 44.7 | +3.1 | |
Conservative | Nancy Holdsworth | 1,194 | 31.2 | -0.7 | |
Independent | Brian Hudson | 541 | 14.1 | -3.7 | |
Liberal Democrat | Cristopher Campbell Brown | 382 | 10.0 | +1.3 | |
Majority | 521 | 13.6 | +3.8 | ||
Turnout | 3,845 | 34.1 | +1.8 | ||
Labour hold | Swing | +1.9 | |||
Party | Candidate | Votes | % | ± | |
---|---|---|---|---|---|
Labour | Taj Mubarik Salam | 1,903 | 50.9 | +0.4 | |
Conservative | Jamshed Khan | 1,297 | 34.7 | -2.7 | |
Liberal Democrat | John Massen | 273 | 7.3 | -0.1 | |
Green | Brian Ford | 167 | 4.5 | -0.2 | |
Socialist Alliance | Ann Morgan | 96 | 2.6 | +2.6 | |
Majority | 606 | 16.2 | +3.1 | ||
Turnout | 3,745 | 36.8 | +10.1 | ||
Labour hold | Swing | +1.5 | |||
Party | Candidate | Votes | % | ± | |
---|---|---|---|---|---|
Labour | James O'Neill | 1,921 | 51.0 | +9.0 | |
Conservative | Michael Ellis | 1,170 | 31.1 | -11.6 | |
Liberal Democrat | Brian Boulton | 579 | 15.4 | +0.1 | |
Socialist Alliance | Ateeq Siddique | 93 | 2.5 | +2.5 | |
Majority | 751 | 20.0 | +19.4 | ||
Turnout | 3,776 | 32.0 | +7.8 | ||
Labour hold | Swing | +10.3 | |||
Party | Candidate | Votes | % | ± | |
---|---|---|---|---|---|
Conservative | Stuart Hanson | 1,706 | 43.0 | -11.6 | |
Labour | Geoffrey Green | 1,606 | 40.5 | +11.0 | |
Liberal Democrat | John Robert Saul | 420 | 10.6 | +2.6 | |
Green | Eileen Allen | 235 | 5.9 | +2.9 | |
Majority | 100 | 2.5 | -22.6 | ||
Turnout | 3,975 | 30.1 | +4.0 | ||
Conservative gain from Labour | Swing | -11.3 | |||
Party | Candidate | Votes | % | ± | |
---|---|---|---|---|---|
Conservative | Christopher Greaves | 2,892 | 56.8 | -5.0 | |
Labour | Graham Hill | 1,258 | 24.7 | +3.2 | |
Liberal Democrat | John Hall | 942 | 18.5 | +1.8 | |
Majority | 1,634 | 32.1 | -8.2 | ||
Turnout | 5,103 | 40.2 | +4.4 | ||
Conservative hold | Swing | -4.1 | |||
Party | Candidate | Votes | % | ± | |
---|---|---|---|---|---|
Labour | Tony Miller | 1,443 | 50.9 | -2.8 | |
Conservative | Derek Taylor | 680 | 24.0 | -1.1 | |
Liberal Democrat | Ronald Craig | 519 | 18.3 | +1.4 | |
Green | Christina Love | 192 | 6.8 | +2.6 | |
Majority | 763 | 26.9 | -1.7 | ||
Turnout | 2,843 | 29.4 | +5.6 | ||
Labour hold | Swing | -0.8 | |||
Party | Candidate | Votes | % | ± | |
---|---|---|---|---|---|
Green | Martin Love | 2,252 | 42.0 | +5.0 | |
Conservative | John Anthony Carroll | 1,609 | 30.0 | -2.6 | |
Labour | Vanda Greenwood | 405 | 22.5 | -2.6 | |
Liberal Democrat | Francis Dale | 292 | 5.4 | +0.1 | |
Majority | 643 | 12.0 | +7.6 | ||
Turnout | 5,362 | 47.1 | +3.7 | ||
Green gain from Conservative | Swing | +3.8 | |||
Party | Candidate | Votes | % | ± | |
---|---|---|---|---|---|
Conservative | Clive Richardson | 1,428 | 43.1 | -24.4 | |
Independent | Melanie Milnes | 917 | 27.7 | +27.7 | |
Labour | Gordon Winter | 666 | 20.1 | +5.6 | |
Liberal Democrat | David Weston | 188 | 5.7 | -8.1 | |
Green | Michael Anthony Rawnsley | 114 | 3.4 | -0.7 | |
Majority | 511 | 15.4 | -37.5 | ||
Turnout | 3,314 | 34.9 | +7.0 | ||
Conservative hold | Swing | -26.0 | |||
Party | Candidate | Votes | % | ± | |
---|---|---|---|---|---|
Labour | Imran Hussain | 3,416 | 57.9 | +12.8 | |
Conservative | Amjad Hussain | 2,143 | 36.3 | -11.2 | |
Liberal Democrat | Naveed Ilyas | 345 | 5.8 | -1.6 | |
Majority | 1,273 | 21.6 | +19.2 | ||
Turnout | 5,950 | 49.2 | +3.3 | ||
Labour gain from Conservative | Swing | +12.0 | |||
Party | Candidate | Votes | % | ± | |
---|---|---|---|---|---|
Labour | John Ruding | 1,424 | 62.8 | +12.0 | |
Conservative | J. Stead | 591 | 26.1 | -10.0 | |
Liberal Democrat | S. Lambert | 253 | 11.2 | -2.0 | |
Majority | 833 | 36.7 | +21.9 | ||
Turnout | 2,268 | 24.3 | +7.8 | ||
Labour hold | Swing | +11.0 | |||
Party | Candidate | Votes | % | ± | |
---|---|---|---|---|---|
Labour | Robert Sowman | 1,467 | 42.1 | +11.0 | |
Conservative | Mohammad Masood | 1,072 | 30.8 | -9.7 | |
Liberal Democrat | Brian Moore | 476 | 21.4 | -3.0 | |
Green | Steven Schofield | 196 | 5.6 | +1.7 | |
Majority | 395 | 11.3 | +2.1 | ||
Turnout | 3,502 | 34.9 | |||
Labour hold | Swing | +10.3 | |||
Party | Candidate | Votes | % | ± | |
---|---|---|---|---|---|
Labour | Choudhary Rangzeb | 3,431 | 55.6 | +11.2 | |
Conservative | Khadim Hussain | 2,121 | 34.4 | -9.7 | |
Green | John Edward Robinson | 327 | 5.3 | +0.5 | |
Liberal Democrat | Margaret Chadwick | 293 | 4.7 | -0.0 | |
Majority | 1,310 | 21.2 | +20.8 | ||
Turnout | 6,194 | 43.9 | +12.6 | ||
Labour hold | Swing | +10.4 | |||
Party | Candidate | Votes | % | ± | |
---|---|---|---|---|---|
Labour | Keith Thomson | 1,987 | 59.9 | +10.9 | |
Conservative | Dorothy Craven | 951 | 28.7 | -10.5 | |
Liberal Democrat | Beverley Beaumont | 380 | 11.41 | -0.4 | |
Majority | 1,036 | 31.2 | +21.4 | ||
Turnout | 3,330 | 33.7 | +4.8 | ||
Labour hold | Swing | +10.7 | |||
Party | Candidate | Votes | % | ± | |
---|---|---|---|---|---|
Conservative | Kristan Hopkins | 1,810 | 41.8 | -1.7 | |
Labour | Mark Curtis | 1,273 | 29.4 | +2.6 | |
Independent | David Samuels | 882 | 20.3 | -3.6 | |
Liberal Democrat | Richard Quayle | 369 | 8.5 | +2.7 | |
Majority | 537 | 12.4 | -4.3 | ||
Turnout | 4,349 | 36.5 | +2.8 | ||
Conservative hold | Swing | -2.1 | |||
Party | Candidate | Votes | % | ± | |
---|---|---|---|---|---|
Labour | Mark Cummins | 1,455 | 46.2 | +12.8 | |
Conservative | John David Hardy | 1,044 | 33.1 | -7.5 | |
Liberal Democrat | Kevin Hall | 405 | 20.7 | -5.3 | |
Majority | 411 | 13.0 | +5.8 | ||
Turnout | 3,163 | 27.4 | +5.3 | ||
Labour hold | Swing | +10.1 | |||
Toller is a ward within the City of Bradford Metropolitan District Council of West Yorkshire, England. The population of the ward as of the 2011 Census was 19,914.
One third of City of Bradford Metropolitan District Council is elected each year, followed by one year without election.
Windhill and Wrose is a ward within the City of Bradford Metropolitan District Council in the county of West Yorkshire, England, named after the districts of Windhill and Wrose around which it is drawn.
The City of Bradford Metropolitan District Council elections were held on Thursday, 7 May 1998, with one third of the council up for election. Since the previous election there had been a number of by-elections resulting in two Labour defenses and a Conservative gain in Heaton, due to be defended at this election. Labour retained control of the council.
Elections to City of Bradford Metropolitan District Council were held on 1 May 1975, with one third of the seats up for election. The election resulted in the Conservatives retaining control. Voter turnout was 34.0%.
Elections to City of Bradford Metropolitan District Council were held on 6 May 1976, with one third of council up for election as well as vacancies in Bolton and Thornton. The election resulted in the Conservatives retaining control with voter turnout at 39.7%.
Elections to City of Bradford Metropolitan District Council were held on 4 May 1978, with one third of council up for election as well as an extra vacancy in Shipley: Central, North & East. The election resulted in the Conservatives retaining control with voter turnout at 38.3%.
Elections to City of Bradford Metropolitan District Council were held on were held on the same day as the general election, with one third of council up for election as well as double vacancies in Haworth, Oakworth & Oxenhope and Heaton. The University incumbent had defected from Labour to Independent Labour the year before. The election resulted in the Conservatives retaining control with voter turnout at 72.7%.
Elections to City of Bradford Metropolitan District Council were held on Thursday, 6 May 1982, with one third of the council to be elected. The council fell to no overall control after the elections.
The City of Bradford Metropolitan District Council elections were held on Thursday, 8 May 1986, with one third of the council and a vacancy in Odsal to be elected. The elections resulted in Labour gainining control of the council.
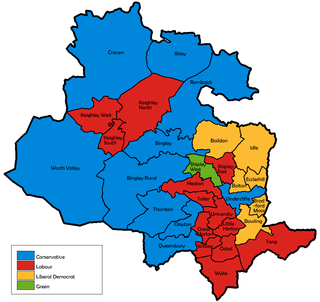
Elections to City of Bradford Metropolitan District Council were held on 1 May 2003. Before the election, Wibsey Labour councillor, Keith Thomson, had defected to Independent. One third of the council was up for election, and it remained under no overall control.
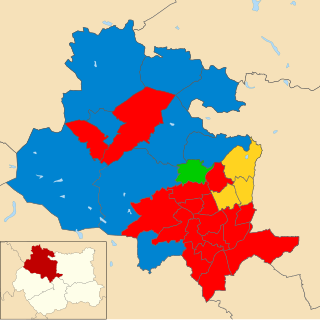
The 2015 City of Bradford Metropolitan District Council election took place on 7 May 2015. This was on the same day as other local elections and a general election. One councillor was elected in each ward for a four-year term so the councillors elected in 2015 last stood for election in 2011. Each ward is represented by three councillors, the election of which is staggered, so only one third of the councillors were elected in this election. Labour retained overall control of the council.
The City of Bradford Metropolitan District Council elections were held on Thursday, 5 May 1988, with one third of the council up for election as well as vacancies in Eccleshill & Wyke to be elected. Labour lost control of the council to no overall control following numerous losses to the Conservatives.
The City of Bradford Metropolitan District Council elections were held on Thursday, 4 May 1990, with one third of the council up for election as well as vacancies in Great Horton & Ilkley to be elected. Labour had suffered a defection prior to the election in the University ward, with the sitting councillor attempting, unsuccessfully, to defend it as a Conservative. Labour regained control of the council from no overall control following numerous gains from the Conservatives.
The City of Bradford Metropolitan District Council elections were held on Thursday, 5 May 1994, with one third of the council up for election. Labour retained control of the council.
The City of Bradford Metropolitan District Council elections were held on Thursday, 4 May 1995, with one third of the council up for election. Prior to the election there had been a by-election in Tong after incumbent Labour councillor, Gerry Sutcliffe, was selected as their candidate for the Bradford South by-election, which Labour successfully defended. Labour retained control of the council.
The City of Bradford Metropolitan District Council elections were held on Thursday, 2 May 1996, with one third of the council up for election. Labour retained control of the council.
The City of Bradford Metropolitan District Council elections were held on Thursday, 6 May 1999, with one third of the council up for election. Since the previous election there had been a by-election resulting in Labour successfully defending their seat in Little Horton. Labour retained control of the council.
The City of Bradford Metropolitan District Council elections were held on Thursday, 4 May 2000, with one third of the council up for election. Labour lost control of the council to no overall control.
Elections to City of Bradford Metropolitan District Council were held on 10 June 2004. The whole council was up for election following boundary changes. The council stayed under no overall control.