City of Bradford Metropolitan District Council election, 2003

Last updated

Map of the results for the 2003 Bradford council election. Bradford UK local election 2003 map.png
Map of the results for the 2003 Bradford council election.

Elections to City of Bradford Metropolitan District Council were held on 1 May 2003. Before the election, Wibsey Labour councillor, Keith Thomson, had defected to Independent. [1] [2] One third of the council was up for election, and it remained under no overall control. [3] [4]

City of Bradford Metropolitan District Council Local government body in England

City of Bradford Metropolitan District Council is the local authority of the City of Bradford in West Yorkshire, England. It is a metropolitan district council, one of five in West Yorkshire and one of 36 in the metropolitan counties of England, and provides the majority of local government services in Bradford. Since 1 April 2014 it has been a constituent council of the West Yorkshire Combined Authority.

Wibsey locality in Bradford

Wibsey is a ward within the City of Bradford Metropolitan District Council, West Yorkshire, England. The population had increased to 14,671 at the 2011 Census. Wibsey is named after Wibsey village which makes up the main part of the ward. As well as the area of Wibsey, the ward includes the area of Bankfoot to the east and much of the area of Odsal. It is located on a ridge which runs from the city centre, up to Queensbury, which has been credited as the highest market town in England.

The Labour Party is a centre-left political party in the United Kingdom which has been described as an alliance of social democrats, democratic socialists and trade unionists. The party's platform emphasises greater state intervention, social justice and strengthening workers' rights.

Contents

Election result

Bradford Local Election Result 2003 [3]
PartySeatsGainsLossesNet gain/lossSeats %Votes %Votes+/−
  Labour 1312Decrease2.svg143.330.433,604-8.0%
  Conservative 1013Decrease2.svg233.332.635,988-5.9%
  Liberal Democrat 620Increase2.svg220.023.425,885+6.8%
  Green 110Increase2.svg13.35.66,140+1.7%
  BNP 000Steady2.svg0.05.86,391+5.4%
  Independent 000Steady2.svg0.02.02,170-0.0%
  Socialist Alliance 000Steady2.svg0.00.2235-0.0%

This result had the following consequences for the total number of seats on the council after the elections:

PartyPrevious councilNew council
Conservative3836
Labour3736
Liberal Democrat1214
Green23
Independent11
Total9090
Working majority -14  -18 

Ward results

Baildon [3]
PartyCandidateVotes%±
Liberal Democrat John Malcolm Cole2,36546.2-2.4
Conservative Edward Ward1,20723.6-15.8
BNP David Hobson84216.4+16.4
Labour Miranda Vasey56411.0+2.8
Green Kevin Warnes1432.8-1.1
Majority1,15822.6+13.4
Turnout 5,12542.2+1.7
Liberal Democrat hold Swing +6.7
Bingley [3]
PartyCandidateVotes%±
Conservative Robin Owens1,97249.4-1.7
Labour Frank Needham1,23130.8-2.4
Liberal Democrat Alan Sykes50512.6+3.0
Green Arthur John Arnold2837.1+1.1
Majority74118.6+0.6
Turnout 4,00137.6-4.4
Conservative hold Swing +0.3
Bingley Rural [3]
PartyCandidateVotes%±
Conservative Andrew Cooke2,14957.4-5.5
Labour James Newton87123.3-0.5
Liberal Democrat Margaret Fielden47412.7+4.3
Green Brian Newham2506.7+1.7
Majority1,27834.1-5.0
Turnout 3,77932.2-4.8
Conservative hold Swing -2.5
Bolton [3]
PartyCandidateVotes%±
Liberal Democrat David Gray1,86652.6-10.2
BNP Arthur Bentley65718.5+18.5
Labour Jagtar Deol60617.1-3.8
Conservative Peter Benson42011.8-4.6
Majority1,20934.1-7.8
Turnout 3,55235.2-1.4
Liberal Democrat hold Swing -14.3
Bowling [3]
PartyCandidateVotes%±
Liberal Democrat Rupert Oliver2,07761.3+30.1
Labour Mohammed Darr80923.9-21.3
Conservative Fayzul Islam50014.8-8.8
Majority1,26837.4+23.5
Turnout 3,39529.9-1.8
Liberal Democrat gain from Labour Swing +25.7
Bradford Moor [3]
PartyCandidateVotes%±
Liberal Democrat Mohammod Islam1,94541.7+30.4
Conservative Sakhawat Hussain1,57733.8-12.8
Labour Susanne Rooney1,14724.6-17.6
Majority3687.9+3.4
Turnout 4,72744.5+0.8
Liberal Democrat gain from Conservative Swing +21.6
Clayton [3]
PartyCandidateVotes%±
Conservative Elaine Byrom1,26735.5-8.6
Labour Olayemi Fagborun1,05829.6-6.5
BNP Lynda Cromie69119.3+19.3
Liberal Democrat Lorna Leeming44912.6-3.0
Green Alexander Suchi1073.0-1.2
Majority2095.8-2.1
Turnout 3,57834.9+2.5
Conservative hold Swing -1.0
Craven [3]
PartyCandidateVotes%±
Conservative David Emmott2,17856.6+1.8
Labour Francis Harrison99625.9-5.8
Liberal Democrat Hamish Hay67117.4+4.0
Majority1,18230.7+7.6
Turnout 3,85831.1-3.4
Conservative hold Swing +3.8
Eccleshill [3]
PartyCandidateVotes%±
Liberal Democrat Michael Attenborough1,13037.9+5.0
Labour Gareth Logan84728.4-3.2
BNP Kerry Bedford51917.4+2.7
Conservative Richard Sheard43114.4-3.6
Green Joan Foulds561.9+1.9
Majority2839.5+8.2
Turnout 2,98732.4-3.5
Liberal Democrat hold Swing +4.1
Great Horton [3]
PartyCandidateVotes%±
Labour John Godward1,26337.8-17.7
Conservative Richard Milczanowski73922.1-8.3
Liberal Democrat Margaret Chadwick57317.1+8.8
BNP James Breslin54616.3+16.3
Green Derek Curtis2216.6+1.0
Majority52415.7-9.4
Turnout 3,34631.3-2.7
Labour hold Swing -4.7
Heaton [3]
PartyCandidateVotes%±
Labour Mark Fielding1,54435.5-4.4
Conservative Mohammad Masood1,23828.4-18.3
Liberal Democrat Mohammed Mirza1,12425.8+19.0
Green John Francis Love44810.3+5.0
Majority3067.0+0.2
Turnout 4,37237.9-5.1
Labour hold Swing +6.9
Idle [3]
PartyCandidateVotes%±
Liberal Democrat Ann Lesley Ozolins2,26652.1+1.8
BNP Stewart Williams87420.1+20.1
Conservative Harry Sissling59613.7-14.5
Labour Shofiqul Islam49711.4-10.2
Green Judith Wever1192.7+2.7
Majority1,39232.0+9.9
Turnout 4,35935.4-0.2
Liberal Democrat hold Swing -9.1
Ilkley [3]
PartyCandidateVotes%±
Conservative Brian Smith2,44157.9-6.3
Labour Paul Dutton99423.6+0.2
Liberal Democrat James Keeley77718.4+6.1
Majority1,44734.3-6.5
Turnout 4,24038.6-4.4
Conservative hold Swing -3.2
Keighley North [3]
PartyCandidateVotes%±
Labour Malcolm Slater1,59838.4-9.4
Conservative Nancy Holdsworth1,29331.1-10.0
Green Arif Hussain87120.9+20.9
Liberal Democrat James Main3979.5-1.6
Majority3057.3+0.6
Turnout 4,17437.9+0.8
Labour hold Swing +0.3
Keighley South [3]
PartyCandidateVotes%±
Labour Lynne Joyce1,14951.2-11.2
Liberal Democrat Christopher Campbell Brown56825.3+14.2
Conservative Robert Payne52923.5-2.9
Majority58125.9-10.1
Turnout 2,28226.4-3.4
Labour hold Swing -12.7
Keighley West [3]
PartyCandidateVotes%±
Labour Barry Thorne1,12334.6-10.2
Conservative David McKay94929.2-1.9
Liberal Democrat Isa Khan50415.5+5.5
Independent Brian Hudson40712.5-1.6
Independent John Philip2648.1+8.1
Majority1745.4-8.2
Turnout 3,27429.2-4.9
Labour hold Swing -4.1
Little Horton [3]
PartyCandidateVotes%±
Labour Ian Greenwood1,29743.5-7.5
Conservative Khadam Hussain1,11937.5+2.8
Liberal Democrat Paul Michell44414.9+7.6
Green Brian Ford1234.1-0.3
Majority1746.0-10.3
Turnout 2,99130.9-5.9
Labour hold Swing -5.1
Odsal [3]
PartyCandidateVotes%±
Labour David Adam Green1,60450.7-0.3
Conservative Jonathan Stubbs87127.5-3.5
Liberal Democrat Christopher Boulton68721.7+6.3
Majority73323.2+3.2
Turnout 3,18427.3-4.7
Labour hold Swing +1.6
Queensbury [3]
PartyCandidateVotes%±
Conservative Andrew Smith1,63332.9-10.1
BNP Paul Cromie1,48930.0+30.0
Labour Carolyn Lowing1,37027.6-12.9
Liberal Democrat Susan Lambert4729.5-1.1
Majority1442.9+0.4
Turnout 4,96937.4+7.3
Conservative hold Swing -20.0
Rombalds [3]
PartyCandidateVotes%±
Conservative Matthew Palmer2,67857.1+0.3
Liberal Democrat Ambrose Micklem90619.3+0.8
Labour Andrew Dundas86018.3-6.4
Green Julie Cowdery2435.2+5.2
Majority1,77237.8+5.7
Turnout 4,70437.2-3.0
Conservative hold Swing -0.2
Shipley East [3]
PartyCandidateVotes%±
Labour Mark Blackburn1,17238.9-12.0
BNP Christopher Hill77325.6+25.6
Conservative Derek Taylor47015.6-8.4
Liberal Democrat John Hall46415.4-2.9
Green Christina Love1354.5-2.3
Majority39913.2-13.7
Turnout 3,01631.3+1.9
Labour hold Swing -18.8
Shipley West [3]
PartyCandidateVotes%±
Green Robert Nicholls2,42350.3+8.2
Conservative William Mills Oldfield1,29826.9-3.1
Labour Vanda Greenwood70014.5-7.9
Liberal Democrat Alexander Cole3978.2+2.8
Majority1,12523.3+11.3
Turnout 4,83442.7-4.4
Green gain from Conservative Swing +5.6
Thornton [3]
PartyCandidateVotes%±
Conservative John Buffham1,38144.1+1.0
Independent Melanie Milnes87628.0+0.3
Labour Catherine Rowen54017.2-2.9
Liberal Democrat David Weston2166.9+1.2
Green Michael Rawnsley1193.8+0.4
Majority50516.1+0.7
Turnout 3,13733.2-1.7
Conservative hold Swing +0.3
Toller [3]
PartyCandidateVotes%±
Labour Amir Hussain1,62343.1-14.8
Liberal Democrat Christine Reid1,25933.4+27.6
Conservative John Robertshaw88623.5-12.8
Majority3649.7-11.9
Turnout 3,79132.5-16.7
Labour hold Swing -21.2
Tong [3]
PartyCandidateVotes%±
Labour Michael Johnson1,17263.2+0.4
Conservative Michael George Ellis37920.4-5.6
Liberal Democrat Joan Collins30416.4+5.2
Majority79342.7+6.0
Turnout 1,86320.0-4.3
Labour hold Swing +3.0
Undercliffe [3]
PartyCandidateVotes%±
Conservative Mohammed Jamil1,12436.5+5.8
Labour Raymond Bage89028.9-13.2
Liberal Democrat Edward Hallmann83927.3+5.8
Green Steven Schofield2227.2+1.6
Majority2347.6-3.7
Turnout 3,10231.1-3.8
Conservative gain from Labour Swing +9.5
University [3]
PartyCandidateVotes%±
Labour Munir Ahmed1,93739.7-15.9
Conservative Meherban Hussain1,22125.0-9.3
Liberal Democrat Naveed Ilyas72114.8+10.0
Independent Karl Dallas62312.8+12.8
Green John Robinson3777.7+2.4
Majority71614.7-6.5
Turnout 4,90636.2-7.7
Labour gain from Conservative Swing -3.3
Wibsey [3]
PartyCandidateVotes%±
Labour Ralph Ritchie Berry1,40050.6-9.3
Conservative Dorothy Craven85931.0+2.4
Liberal Democrat Brian Boulton50818.4+6.9
Majority54119.5-11.7
Turnout 2,78828.8-4.9
Labour hold Swing -5.8
Worth Valley [3]
PartyCandidateVotes%±
Conservative Glen Miller1,65345.7+4.0
Labour Mark Curtis1,27935.4+6.0
Liberal Democrat Samuel Harris44812.4+3.9
Socialist Alliance Jillian Crowther2356.5+6.5
Majority37410.3-2.0
Turnout 3,63630.6-5.9
Conservative hold Swing -1.0
Wyke [3]
PartyCandidateVotes%±
Labour Rosemary Watson1,46350.1+3.9
Conservative John Arthur Stead93031.8-1.3
Liberal Democrat Matthew Boulton52918.1-2.6
Majority53318.2+5.2
Turnout 2,94025.4-2.0
Labour hold Swing +2.6

By-elections between 2003 and 2004

Great Horton By-Election 16 October 2003 [5]
PartyCandidateVotes%±
Labour Liz Devlin92636.9-0.9
Conservative Richard Milczanowski76430.4+8.3
Liberal Democrat Paul Michell69227.6+10.5
Green Derek Curtis1295.1-1.5
Majority1626.5-9.2
Turnout 2,51123.4-7.9
Labour gain from Conservative Swing -4.6

Related Research Articles

English Democrats

The English Democrats is an English nationalist political party in England.

The Respect Party was a left-wing to far-left political party active in the United Kingdom between 2004 and 2016. At the height of its success in 2007, the party had one Member of Parliament (MP) in the House of Commons and nineteen councillors in local government.

Liberal Party (UK, 1989) political party of the United Kingdom, from 1989

The Liberal Party is a British political party that was founded in 1989 by members of the original Liberal Party opposed to its merger with the Social Democratic Party (SDP) to form the Liberal Democrats. The party holds seven local council seats.

Bowling and Barkerend electoral ward of Bradford City Council

Bowling and Barkerend is an electoral ward within the City of Bradford Metropolitan District Council. The population at the 2011 Census was 20,618.

Cornwall Council British administrative body

Cornwall Council is the unitary authority for the county of Cornwall in the United Kingdom, not including the Isles of Scilly, which has its own council. The council, and its predecessor Cornwall County Council, has a tradition of large groups of independent councillors, having been controlled by independents in the 1970s and 1980s. Since the 2013 elections, it is run by an Independent-Liberal Democrat coalition.

One third of Preston City Council in Lancashire, England is elected each year, followed by one year without election to allow for the Lancashire County Council elections.

Social Democratic Party (UK, 1990–present) British political party

The Social Democratic Party is a political party in the United Kingdom, established in 1990. It traces its origin to the Social Democratic Party (SDP) which was formed in 1981 by a group of dissident Labour Party Members of Parliament (MPs) and former MPs: Roy Jenkins, David Owen, Bill Rodgers and Shirley Williams, who became known as the ‘Gang of Four’. The original SDP merged with the Liberal Party in 1988 to form the Liberal Democrats, but Owen, two other MPs and a minority of party activists formed a breakaway group with the same name immediately afterward. That continuing party dissolved itself in 1990, but some activists met and voted to continue the party in defiance of its National Executive, leading to the creation of a new Social Democratic Party.

Broxtowe Borough Council in Nottinghamshire, England is elected every four years. The Conservative party held overall control of the council from its foundation in 1973 until 1995 when the Labour party took control. Boundary changes took place for the 2003 election reducing the number of seats by five. The election saw Labour lose overall control of the council. Since 2003 the council has been under no overall control with Labour and the Liberal Democrats sharing power.

Middlesbrough is a unitary authority in North Yorkshire, England. Until 1 April 1996 it was a non-metropolitan district in Cleveland. Since 2002 it has also had a directly elected mayor.

South Oxfordshire District Council in Oxfordshire, England is elected every four years. Since the last boundary changes in 2003, 48 councillors have been elected from 29 wards.

Essex County Council in England is elected every four years. Since the last boundary changes in 2005, 75 councillors are elected from 70 wards.

2000 Leeds City Council election

The Leeds City Council election took place on 4 May 2000 to elect members of City of Leeds Metropolitan Borough Council in West Yorkshire, England. Since the last election, Labour had lost a by-election to the Lib Dems in Harehills, and long-serving Chapel Allerton councillor, Garth Frankland, had defected from Labour to Left Alliance. One third of the council was up for election and the Labour party stayed in overall control of the council. Overall turnout in the election was 27.5%.

2014 Stockport Metropolitan Borough Council election

Elections to Stockport Metropolitan Borough Council took place on 22 May 2014. They coincided with other local elections happening on this day across the UK, as well as the 2014 elections to the European Parliament.

2015 Plymouth City Council election

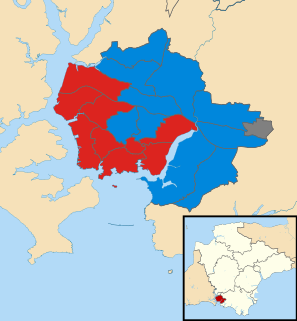
The 2015 Plymouth City Council election took place on 7 May 2015 to elect members of Plymouth City Council in England.

The 2015 Poole Borough Council election took place on 7 May 2015 to elect members of Poole Borough Council in England. This was on the same day as other local elections and the Parliamentary General Election.

1995 City of Bradford Metropolitan District Council election

The City of Bradford Metropolitan District Council elections were held on Thursday, 4 May 1995, with one third of the council up for election. Prior to the election there had been a by-election in Tong after incumbent Labour councillor, Gerry Sutcliffe, was selected as their candidate for the Bradford South by-election, which Labour successfully defended. Labour retained control of the council.

1996 City of Bradford Metropolitan District Council election

The City of Bradford Metropolitan District Council elections were held on Thursday, 2 May 1996, with one third of the council up for election. Labour retained control of the council.

2000 City of Bradford Metropolitan District Council election

The City of Bradford Metropolitan District Council elections were held on Thursday, 4 May 2000, with one third of the council up for election. Labour lost control of the council to no overall control.

2016 City of Bradford Metropolitan District Council election

The 2016 City of Bradford Metropolitan District Council election took place on 5 May 2016. This was on the same day as other local elections. One councillor was elected in each ward for a four-year term. Each ward is represented by three councillors, the election of which is staggered, so only one third of the councillors were elected in this election.

2018 City of Bradford Metropolitan District Council election

The 2018 City of Bradford Metropolitan District Council took place on 3 May 2018 to elect members of Bradford District Council in England. This was on the same day as other local elections. One councillor was elected in each ward for a four-year term so the councillors elected in 2018 last stood for election in 2014. Each ward is represented by three councillors, the election of which is staggered, so only one third of the councillors were elected in this election. Before the election there was a Labour majority and afterwards Labour had increased their majority.

References

  1. "Councillors: By Party". bradford.gov.uk. Archived from the original on 15 October 2003. Retrieved 27 August 2015.
  2. "Election 2003: party totals". bradford.gov.uk. Archived from the original on 20 August 2003. Retrieved 27 August 2015.
  3. 1 2 3 4 5 6 7 8 9 10 11 12 13 14 15 16 17 18 19 20 21 22 23 24 25 26 27 28 29 30 31 32 "2003 elections" (PDF). bradford.gov. Retrieved 15 June 2014.
  4. "Vote 2012: Bradford". BBC News Online . Retrieved 1 August 2015.
  5. "Local Authority Byelection Results". gwydir.demon.co.uk. Retrieved 10 August 2015.