Elections to Calderdale Metropolitan Borough Council were held on 2 May 2002. One third of the council was up for election and the Conservative party lost overall control of the council to no overall control. The total turnout of the election was 32.16% (47,091 voters of an electorate of 146,407). The winning candidate in each ward is highlighted in bold. [1] [2] [3] [4]
Calderdale Metropolitan Borough Council is the local authority of the Metropolitan Borough of Calderdale in West Yorkshire, England. It is a metropolitan district council, one of five in West Yorkshire and one of 36 in the metropolitan counties of England, and provides the majority of local government services in Calderdale. Since 1 April 2014 it has been a constituent council of the West Yorkshire Combined Authority.
The Conservative Party, officially the Conservative and Unionist Party, is a centre-right political party in the United Kingdom. Presently led by Theresa May, it has been the governing party since 2010. It presently has 314 Members of Parliament in the House of Commons, 249 members of the House of Lords, and 18 members of the European Parliament. It also has 31 Members of the Scottish Parliament, 12 members of the Welsh Assembly, eight members of the London Assembly and 9,008 local councillors. One of the major parties of UK politics, it has formed the government on 45 occasions, more than any other party.
In the context of local authorities in the United Kingdom, the term no overall control refers to a situation in which no single political group achieves a majority of seats; and is analogous to a hung parliament. Of the 310 councils who had members up for election in the 2007 local elections, 85 resulted in a NOC administration.
After the election, the composition of the council was
The Liberal Democrats are a liberal political party in the United Kingdom. They presently have 11 Members of Parliament in the House of Commons, 96 members of the House of Lords, and one member of the European Parliament. They also have five Members of the Scottish Parliament and a member each in the Welsh Assembly and London Assembly. The party reached the height of its influence in the early 2010s, forming a junior partner in a coalition government from 2010 to 2015. It is presently led by Vince Cable.
The Labour Party is a centre-left political party in the United Kingdom which has been described as an alliance of social democrats, democratic socialists and trade unionists. The party's platform emphasises greater state intervention, social justice and strengthening workers' rights.
Party | Candidate | Votes | % | ± | |
---|---|---|---|---|---|
Labour | Edith Ann Martin | 913 | 35.80 | ||
Conservative | Michael Raine | 899 | 35.25 | ||
Independent | Rodney Allen | 738 | 28.94 | ||
Majority | 14 | ||||
Turnout | 2,550 | 33.07 | |||
Labour hold | Swing | ||||
Party | Candidate | Votes | % | ± | |
---|---|---|---|---|---|
Liberal Democrat | Julie Dower | 1,269 | 38.51 | ||
Labour | Michael Peter Towl | 986 | 29.92 | ||
Conservative | Helen Jane Granton | 583 | 17.69 | ||
Green | Jamie Johnson | 457 | 13.86 | ||
Majority | 283 | ||||
Turnout | 3,295 | 36.15 | |||
Liberal Democrat hold | Swing | ||||
Party | Candidate | Votes | % | ± | |
---|---|---|---|---|---|
Liberal Democrat | Edgar Joseph Waller | 1,402 | 60.22 | ||
Labour | Stephen Wood | 557 | 23.92 | ||
Conservative | Howard Geofferey Seed | 369 | 15.85 | ||
Majority | 845 | ||||
Turnout | 2,328 | 29.11 | |||
Liberal Democrat hold | Swing | ||||
Party | Candidate | Votes | % | ± | |
---|---|---|---|---|---|
Liberal Democrat | Patrick Julyan Lancelot Napier Phillips | 2,129 | 64.53 | ||
Conservative | Paul Graham Rogan | 736 | 22.30 | ||
Labour | Nigel Patrick Ambler | 434 | 13.15 | ||
Majority | 1,393 | ||||
Turnout | 3,299 | 34.57 | |||
Liberal Democrat hold | Swing | ||||
Party | Candidate | Votes | % | ± | |
---|---|---|---|---|---|
Conservative | John Foran | 1,579 | 60.91 | ||
Labour | Paul Womersley | 693 | 26.73 | ||
Liberal Democrat | Elisabeth Mary Wilson | 320 | 12.34 | ||
Majority | 886 | ||||
Turnout | 2,592 | 32.58 | |||
Conservative hold | Swing | ||||
Party | Candidate | Votes | % | ± | |
---|---|---|---|---|---|
Labour | Thomas Joseph McElroy | 945 | 52.88 | ||
Conservative | Michael John Clarke | 613 | 34.30 | ||
Liberal Democrat | David Robinson | 229 | 12.81 | ||
Majority | 332 | ||||
Turnout | 1,787 | 26.14 | |||
Labour hold | Swing | ||||
Party | Candidate | Votes | % | ± | |
---|---|---|---|---|---|
Liberal Democrat | Jane Frances Leech Brown | 1,529 | 51.01 | ||
Labour | Stewart Brown | 674 | 22.48 | ||
Conservative | Robert Ernest Thornber | 551 | 18.38 | ||
Green | Steven Richard Hutton | 243 | 8.10 | ||
Majority | 855 | ||||
Turnout | 2,997 | 35.09 | |||
Liberal Democrat hold | Swing | ||||
Party | Candidate | Votes | % | ± | |
---|---|---|---|---|---|
Labour | Andy Metcalfe | 758 | 44.24 | ||
Independent | Redmond Mellett | 393 | 22.94 | ||
Conservative | Sajid Mehmood | 367 | 21.42 | ||
Liberal Democrat | Tracie Anne Quinn-Robinson | 195 | 11.38 | ||
Majority | 375 | ||||
Turnout | 1,713 | 24.28 | |||
Labour hold | Swing | ||||
Party | Candidate | Votes | % | ± | |
---|---|---|---|---|---|
Conservative | Roger Laurence Taylor | 1,756 | 62.80 | ||
Labour | Derek Fox Haviour | 725 | 25.92 | ||
Liberal Democrat | Margaret Stafford | 315 | 11.26 | ||
Majority | 1031 | ||||
Turnout | 2,796 | 32.35 | |||
Conservative hold | Swing | ||||
Party | Candidate | Votes | % | ± | |
---|---|---|---|---|---|
Labour | Helen Josephine Rivron | 768 | 47.79 | ||
Liberal Democrat | Pamela Elizabeth Burton | 602 | 37.46 | ||
Conservative | John Charles Shoesmith | 237 | 14.74 | ||
Majority | 166 | ||||
Turnout | 1,607 | 22.09 | |||
Labour hold | Swing | ||||
Party | Candidate | Votes | % | ± | |
---|---|---|---|---|---|
Conservative | Gareth Paul Henderson | 1,150 | 43.96 | ||
Labour | George Edward Richardson | 822 | 31.42 | ||
Independent | Peter Graham Davis | 443 | 16.93 | ||
Liberal Democrat | Glen Michael Mattock | 201 | 7.68 | ||
Majority | 328 | ||||
Turnout | 2,616 | 32.49 | |||
Conservative hold | Swing | ||||
Party | Candidate | Votes | % | ± | |
---|---|---|---|---|---|
Conservative | Geraldine Mary Carter | 1,257 | 42.40 | ||
Labour | Judith Mary Gannon | 992 | 33.46 | ||
Liberal Democrat | Anthony Crowther | 715 | 24.12 | ||
Majority | 265 | ||||
Turnout | 2,964 | 32.45 | |||
Conservative hold | Swing | ||||
Party | Candidate | Votes | % | ± | |
---|---|---|---|---|---|
Labour | Arshad Mahmood | 1,467 | 46.42 | ||
Conservative | Shakar Saghir | 1,059 | 33.51 | ||
Liberal Democrat | Andrew John Foster | 634 | 20.06 | ||
Majority | 408 | ||||
Turnout | 3,160 | 39.55 | |||
Labour gain from Conservative | Swing | ||||
Party | Candidate | Votes | % | ± | |
---|---|---|---|---|---|
Conservative | Geoffrey Wainwright | 1,855 | 63.81 | ||
Labour | Catherine Mary Groves | 621 | 21.36 | ||
Liberal Democrat | Siobhen Stow | 431 | 14.82 | ||
Majority | 1,234 | ||||
Turnout | 2,907 | 33.83 | |||
Conservative hold | Swing | ||||
Party | Candidate | Votes | % | ± | |
---|---|---|---|---|---|
Labour | Anne Marsden | 975 | 42.89 | ||
Conservative | Marian McCartney | 826 | 36.33 | ||
Liberal Democrat | Sheila Ann Ashton | 472 | 20.76 | ||
Majority | 149 | ||||
Turnout | 2,273 | 29.45 | |||
Labour gain from Conservative | Swing | ||||
Party | Candidate | Votes | % | ± | |
---|---|---|---|---|---|
Liberal Democrat | Ann Clare Townley | 1,231 | 47.03 | ||
Labour | Joe Mitchell | 938 | 35.84 | ||
Conservative | Craig Whittaker | 448 | 17.11 | ||
Majority | 293 | ||||
Turnout | 2,617 | 33.72 | |||
Liberal Democrat hold | Swing | ||||
Party | Candidate | Votes | % | ± | |
---|---|---|---|---|---|
Labour | Megan Kathleen Swift | 1,155 | 40.46 | ||
Conservative | Stephen Baines | 949 | 33.25 | ||
Liberal Democrat | John Durkin | 510 | 17.86 | ||
Independent | Gwyneth Greenwood | 240 | 8.40 | ||
Majority | 206 | ||||
Turnout | 2,854 | 32.74 | |||
Labour gain from Conservative | Swing | ||||
Party | Candidate | Votes | % | ± | |
---|---|---|---|---|---|
Conservative | David Ian Ginley | 1,550 | 56.65 | ||
Labour | Pauline Margaret Leach | 749 | 27.37 | ||
Liberal Democrat | Robert Andrew Pearson | 437 | 15.97 | ||
Majority | 801 | ||||
Turnout | 2,736 | 35.22 | |||
Conservative hold | Swing | ||||
Party | Candidate | Votes | % | ± | |
---|---|---|---|---|---|
Liberal Democrat | Janet Battye | 883 | 45.8 | +7.3 | |
Labour | Michael Towl | 448 | 23.2 | -6.7 | |
Conservative | Craig Whittaker | 364 | 18.9 | +1.2 | |
Green | Jamie Johnson | 235 | 12.2 | -1.7 | |
Majority | 435 | 22.6 | |||
Turnout | 1,930 | 22.0 | |||
Liberal Democrat hold | Swing | ||||
This by-election has become synonymous as an example of a likely Condorcet loser winning.
Party | Candidate | Votes | % | ± | |
---|---|---|---|---|---|
BNP | Adrian Marsden | 679 | 29.2 | +29.2 | |
Liberal Democrat | Stephen Pearson | 651 | 28.0 | +16.6 | |
Labour | Michael Higgins | 641 | 27.5 | -16.7 | |
Conservative | Stephen Baines | 214 | 9.2 | -12.2 | |
Independent | Redmond Mellett | 142 | 6.1 | -16.8 | |
Majority | 28 | 1.2 | |||
Turnout | 2,327 | 37.0 | |||
BNP gain from Labour | Swing | ||||
Party | Candidate | Votes | % | ± | |
---|---|---|---|---|---|
Conservative | Paul Rogan | 722 | 44.4 | +0.4 | |
Labour | George Richardson | 492 | 30.3 | -1.1 | |
Liberal Democrat | John Durkin | 411 | 25.3 | +17.6 | |
Majority | 230 | 14.1 | |||
Turnout | 1,625 | 20.6 | |||
Conservative hold | Swing | ||||
One third of Calderdale Metropolitan Borough Council in West Yorkshire, England is elected each year, followed by one year without election.
Elections to Wigan Council were held on 1 May 2003 with one-third of the council was up for election. Prior to the election, there had been two vacancies in Leigh Central, with Labour winning a by-election in June and the seat being fought in this election filled unopposed by Barbara Jarvis.
Elections to Manchester City Council took place on 1 May 2008. One third of the council was up for election - every ward of the city returned one councillor at this election out of the three councillors a ward in the city has.
Elections to Calderdale Metropolitan Borough Council were held on 1 May 2008. One third of the council was up for election and the council stayed under no overall control with a minority Conservative administration.
Elections to Calderdale Metropolitan Borough Council were held on 4 May 2006. One third of the council was up for election and the council stayed under no overall control with a minority Conservative administration.
Elections to Calderdale Metropolitan Borough Council were held on 6 May 1999. One third of the council was up for election and the Labour party lost overall control of the council to no overall control. The overall turnout of the election was 30.09%. The winning candidate in each ward is highlighted in bold.
Elections to Calderdale Metropolitan Borough Council were held on 4 May 2000. One third of the council was up for election and the Conservative party gained overall control of the council from no overall control. The total turnout of the election was 28.97%. The winning candidate in each ward is highlighted in bold.
Elections to Calderdale Metropolitan Borough Council were held on 1 May 2003. One third of the council was up for election and the council stayed under no overall control. The total turnout of the election was 34.44%. The winning candidate(s) in each ward is highlighted in bold.
Elections to Calderdale Metropolitan Borough Council were held on 3 May 2007 with the exception of the Warley ward which was postponed until 14 June 2007 due to the sudden death of one of the candidates. One third of the council was up for election and the council stayed under no overall control with a minority Conservative administration. The total turnout of the election was 38.01%. The winning candidate in each ward is highlighted in bold.
Craig Whittaker is a British Conservative Party politician. He was first elected as the Member of Parliament (MP) for Calder Valley in 2010. Whittaker retained the seat in 2015 and in 2017
The 2003 Hertsmere Borough Council election took place on 1 May 2003 to elect members of Hertsmere Borough Council in Hertfordshire, England. One third of the council was up for election and the Conservative party stayed in overall control of the council.
The 2003 Eastbourne Borough Council election took place on 1 May 2003 to elect members of Eastbourne Borough Council in East Sussex, England. One third of the council was up for election and the Liberal Democrats stayed in overall control of the council.
The 2011 Wealden District Council election took place on 5 May 2011 to elect members of Wealden District Council in East Sussex, England. The whole council was up for election and the Conservative party stayed in overall control of the council.
The 2012 Calderdale Metropolitan Borough Council election took place on 3 May 2012 to elect members of Calderdale Metropolitan Borough Council in West Yorkshire, England. This was on the same day as other United Kingdom local elections, 2012. After the election the council continued to have no overall control and continue to be run by a coalition between the Labour Party and the Liberal Democrats.
The 2014 Enfield Council election took place on 22 May 2014 to elect members of Enfield London Borough Council in London, England. The whole council was up for election and the Labour party retained overall control of the council, increasing their majority over the Conservative party by five seats.
The 2014 Calderdale Metropolitan Borough Council election took place on 22 May 2014 to elect members of Calderdale Metropolitan Borough Council in England. This was on the same day as local elections across the United Kingdom and a European election. One councillor was elected in each of the 17 wards for a four-year term. There are three councillors representing each ward elected on a staggered basis so one third of the councillor seats were up for re-election. The seats had previously been contested in 2010 which was held in conjunction with a general election. The turnout was significantly lower in 2014 than in 2010 which is not unusual when comparing local elections that coincide with general elections to ones that do not. Prior to the election Labour was the largest party in the council with 21 out of 51 seats, 5 seats short of an overall majority. After the election there was no overall control of the council. Labour had 25 seats, only one short of a majority and so Labour continued to operate a minority administration.
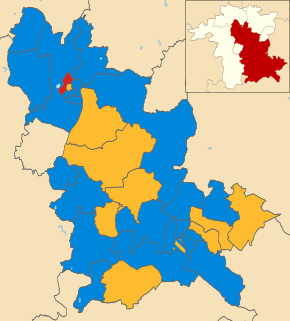
The 2003 Wychavon District Council election took place on 1 May 2003 to elect members of Wychavon District Council in Worcestershire, England. The whole council was up for election with boundary changes since the last election in 1999 reducing the number of seats by four. The Conservative party stayed in overall control of the council.
The 2016 Calderdale Metropolitan Borough Council election took place on 5 May 2016 to elect members of Calderdale Metropolitan Borough Council in England. This was on the same day as other local elections. One councillor was elected in each ward for a four-year term so the councillors elected in 2016 last stood for election in 2012. Each ward is represented by three councillors, the election of which is staggered, so only one third of the councillors was elected in this election. Before the election there was no overall control with a minority Labour administration. After the election there was still no overall control so the minority Labour administration continued.
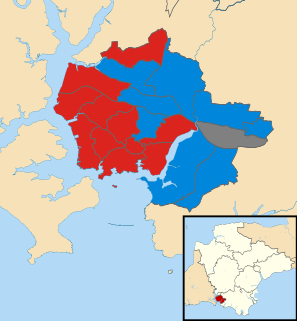
The 2018 Plymouth City Council election took place on 3 May 2018 to elect members of Plymouth City Council in England. The election was won by the Labour Party, who gained enough seats to achieve an overall majority and took control of the council.
The 2018 Calderdale Metropolitan Borough Council election took place on 3 May 2018 to elect members of Calderdale Metropolitan Borough Council in England. This was on the same day as other local elections. One councillor was elected in each ward for a four-year term so the councillors elected in 2018 last stood for election in 2014. Each ward is represented by three councillors, the election of which is staggered, so only one third of the councillors were elected in this election. Before the election there was no overall control with a minority Labour administration. Following the election Labour, having gained one councillor, was still two councillors away from a majority so it remained no overall control.