Calderdale Metropolitan Borough Council election, 2003

Last updated

Elections to Calderdale Metropolitan Borough Council were held on 1 May 2003. One third of the council was up for election and the council stayed under no overall control. The total turnout of the election was 34.44% (47,601 voters of an electorate of 138,228). The winning candidate(s) in each ward is highlighted in bold. [1] [2] [3]

Calderdale Metropolitan Borough Council Local government body in England

Calderdale Metropolitan Borough Council is the local authority of the Metropolitan Borough of Calderdale in West Yorkshire, England. It is a metropolitan district council, one of five in West Yorkshire and one of 36 in the metropolitan counties of England, and provides the majority of local government services in Calderdale. Since 1 April 2014 it has been a constituent council of the West Yorkshire Combined Authority.

In the context of local authorities in the United Kingdom, the term no overall control refers to a situation in which no single political group achieves a majority of seats; and is analogous to a hung parliament. Of the 310 councils who had members up for election in the 2007 local elections, 85 resulted in a NOC administration.

Voter turnout percentage of eligible voters who cast a ballot in an election

Voter turnout is the percentage of eligible voters who cast a ballot in an election. Eligibility varies by country, and the voting-eligible population should not be confused with the total adult population. Age and citizenship status are often among the criteria used to determine eligibility, but some countries further restrict eligibility based on sex, race, or religion.

Contents

After the election, the composition of the council was

Conservative Party (UK) Political party in the United Kingdom

The Conservative Party, officially the Conservative and Unionist Party, is a centre-right political party in the United Kingdom. Presently led by Theresa May, it has been the governing party since 2010. It presently has 314 Members of Parliament in the House of Commons, 249 members of the House of Lords, and 18 members of the European Parliament. It also has 31 Members of the Scottish Parliament, 12 members of the Welsh Assembly, eight members of the London Assembly and 9,008 local councillors. One of the major parties of UK politics, it has formed the government on 45 occasions, more than any other party.

Liberal Democrats (UK) Political party in the United Kingdom

The Liberal Democrats are a liberal political party in the United Kingdom. They presently have 11 Members of Parliament in the House of Commons, 96 members of the House of Lords, and one member of the European Parliament. They also have five Members of the Scottish Parliament and a member each in the Welsh Assembly and London Assembly. The party reached the height of its influence in the early 2010s, forming a junior partner in a coalition government from 2010 to 2015. It is presently led by Vince Cable.

The Labour Party is a centre-left political party in the United Kingdom which has been described as an alliance of social democrats, democratic socialists and trade unionists. The party's platform emphasises greater state intervention, social justice and strengthening workers' rights.

Ward results

Brighouse ward

Brighouse ward
PartyCandidateVotes%±
Conservative Craig Whittaker 885 36.90
Labour Co-op George Edward Richardson 760 31.69
Independent Dorothy Helen Anderson 540 22.51
Liberal Democrat Glen Michael Mattock 213 8.88
Majority 125
Turnout 2,398 32.55
Conservative gain from Independent Swing

Calder Valley ward

Calder Valley ward
PartyCandidateVotes%±
Liberal Democrat Michael Francis Taylor 1,113 38.18
Labour Stewart Brown 749 25.69
Green Jamie Johnson 541 18.55
Conservative Darren Keith Midgley 512 17.56
Majority 364
Turnout 2,915 33.17
Liberal Democrat hold Swing

Elland ward

Elland ward
PartyCandidateVotes%±
Liberal Democrat Diane Park 1,194 57.84
Labour Stanley Richard Sutcliffe 469 22.72
Conservative Michael John Clarke 401 19.42
Majority 364
Turnout 2,064 27.41
Liberal Democrat hold Swing

Greetland and Stainland ward

Greetland and Stainland ward
PartyCandidateVotes%±
Liberal Democrat Elizabeth Margaret Drake Ingleton 1,769 63.31
Conservative Bryce Christian Corkish 662 23.69
Labour Nigel Patrick Ambler 363 12.99
Majority 1,107
Turnout 2,794 30.38
Liberal Democrat hold Swing

Hipperholme and Lightcliffe ward

Hipperholme and Lightcliffe ward
PartyCandidateVotes%±
Conservative Graham Thomas Hall 1,390 51.63
Independent Adrian Christopher O'Connor 769 28.56
Labour Keith John Butterick 533 19.79
Majority 621
Turnout 2,692 34.59
Conservative hold Swing

Illingworth ward

Illingworth ward [4]
PartyCandidateVotes%±
BNP Richard Mulhall 896 38.68
Labour Zoë Marston 840 36.26
Conservative Richard Francis Maycock 580 25.04
Majority 56
Turnout 2,316 36.48
BNP gain from Labour Swing

Luddendenfoot ward

Luddendenfoot ward
PartyCandidateVotes%±
Liberal Democrat Christine Irene Bampton-Smith 1,277 46.53
Labour Susan Mary Press 577 21.02
Conservative Annette Jean Getty 548 19.97
Green Steven Richard Hutton 342 12.46
Majority 700
Turnout 2,744 33.49
Liberal Democrat hold Swing

Mixenden ward

Mixenden ward [5] [6]
PartyCandidateVotes%±
Liberal Democrat Stephen John Pearson 986 39.37
BNP Jane Ann Shooter 700 27.95
Labour Robert George Metcalfe 682 27.23
Conservative John Joseph Wainwright 136 5.43
Majority 286
Turnout 2,504 39.52
Liberal Democrat gain from Labour Swing

Northowram and Shelf ward

Northowram and Shelf ward [7]
PartyCandidateVotes%±
Conservative William Charles Albert Carpenter 1,231 36.33
BNP Graham Nalton 1,119 33.02
Labour Derek Fox Haviour 525 15.49
Independent John Christopher Pulman 270 7.96
Liberal Democrat Janet Mary Sherrard-Smith 243 7.17
Majority 112
Turnout 3,388 40.21
Conservative hold Swing

Ovenden ward

Ovenden ward
PartyCandidateVotes%±
Labour Linda June Riordan 837 39.68
BNP Andrew Mellor 618 29.30
Liberal Democrat Pamela Elizabeth Burton 512 24.27
Conservative Joan Elizabeth Wainwright 142 6.73
Majority 219
Turnout 2,109 32.75
Labour hold Swing

Rastrick ward

Rastrick ward
PartyCandidateVotes%±
Conservative John Clarence Williamson 1,052 50.55
Labour Pamela Margaret Fellows 598 28.73
Liberal Democrat John Durkin 431 20.71
Majority 454
Turnout 2,081 27.14
Conservative hold Swing

Ryburn ward

Ryburn ward
PartyCandidateVotes%±
Conservative Raynor Wilson Booth 1,069 38.78
Labour Judith Mary Gannon 861 31.24
Liberal Democrat Anthony Crowther 826 29.97
Majority 208
Turnout 2,756 31.1
Conservative hold Swing

Skircoat ward

Skircoat ward
PartyCandidateVotes%±
Conservative Grenville Horsfall 1,404 53.40
Labour Maura Wilson 681 25.90
Liberal Democrat Mark Ian Scholes 544 20.69
Majority 723
Turnout 2,629 31.65
Conservative hold Swing

Sowerby Bridge ward

Sowerby Bridge ward
PartyCandidateVotes%±
Conservative Amanda Louise Byrne 871
Conservative Andrew David Feather 862
Labour Michael George Marsden 774
BNP John Derek Gregory 711
Labour Michael Donald Higgins 670
BNP Christian Michael Jackson 600
Liberal Democrat Paul Stevenson 411
Liberal Democrat Siobhen Stow 396
Turnout 38.84
Conservative hold Swing

St John's ward

St John's ward [8]
PartyCandidateVotes%±
Labour Mohammed Najib 1,480 42.21
Conservative Shakar Saghir 980 27.95
Liberal Democrat John Christopher Beacroft-Mitchell 566 16.14
BNP Andrew Mulligan 480 13.69
Majority 500
Turnout 3,506 48.27
Labour hold Swing

Todmorden ward

Todmorden ward
PartyCandidateVotes%±
Liberal Democrat Hilary Alice Myers 1,155 52.64
Labour Frank Rostron McManus 729 33.22
Conservative Thiruvenkatar Krishnapillai 310 14.12
Majority 426
Turnout 2,194 30.2
Liberal Democrat hold Swing

Town ward

Town ward
PartyCandidateVotes%±
Labour Timothy John Swift 1,148 37.03
Conservative Stephen Baines 833 26.87
BNP Christopher Godridge 782 25.22
Liberal Democrat Elisabeth Mary Wilson 337 10.87
Majority 315
Turnout 3,100 39.03
Labour gain from Conservative Swing

Warley ward

Warley ward
PartyCandidateVotes%±
Conservative John Cecil David Hardy 1,521 58.47
Labour Catherine Mary Groves 599 23.02
Liberal Democrat Josef Arthur Rez 481 18.49
Majority 922
Turnout 2,601 35.73
Conservative hold Swing

By-elections between 2003 and 2004

Mixenden ward, 2003

Mixenden By-Election 16 October 2003 [9] [10]
PartyCandidateVotes%±
Liberal Democrat Jennifer Pearson 1,210 47.6 +8.2
BNP Heath Clegg 801 31.5 +3.5
Labour Daniel Coll 474 18.7 -8.5
Independent Sean Loftus 56 2.2 +2.2
Majority 409 16.1
Turnout 2,541 40.2
Liberal Democrat hold Swing

Related Research Articles

2008 Calderdale Metropolitan Borough Council election

Elections to Calderdale Metropolitan Borough Council were held on 1 May 2008. One third of the council was up for election and the council stayed under no overall control with a minority Conservative administration.

2006 Calderdale Metropolitan Borough Council election

Elections to Calderdale Metropolitan Borough Council were held on 4 May 2006. One third of the council was up for election and the council stayed under no overall control with a minority Conservative administration.

Elections to Calderdale Metropolitan Borough Council were held on 6 May 1999. One third of the council was up for election and the Labour party lost overall control of the council to no overall control. The overall turnout of the election was 30.09%. The winning candidate in each ward is highlighted in bold.

Elections to Calderdale Metropolitan Borough Council were held on 4 May 2000. One third of the council was up for election and the Conservative party gained overall control of the council from no overall control. The total turnout of the election was 28.97%. The winning candidate in each ward is highlighted in bold.

Elections to Calderdale Metropolitan Borough Council were held on 2 May 2002. One third of the council was up for election and the Conservative party lost overall control of the council to no overall control. The total turnout of the election was 32.16%. The winning candidate in each ward is highlighted in bold.

2007 Calderdale Metropolitan Borough Council election

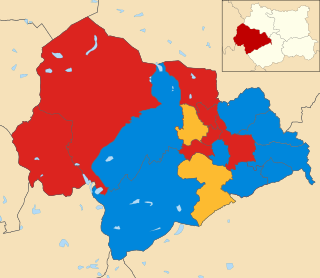
Elections to Calderdale Metropolitan Borough Council were held on 3 May 2007 with the exception of the Warley ward which was postponed until 14 June 2007 due to the sudden death of one of the candidates. One third of the council was up for election and the council stayed under no overall control with a minority Conservative administration. The total turnout of the election was 38.01%. The winning candidate in each ward is highlighted in bold.

2009 Cumbria County Council election

An election to Cumbria County Council took place on 2 May 2013 as part of the United Kingdom local elections, 2009. All 84 councillors were elected from various electoral divisions, which returned one or two county councillors each by first-past-the-post voting for a four-year term of office. They coincided with an election for the European Parliament. All 84 seats in the Council were up for election, and a total of 301 candidates stood. The total number of people registered to vote was 392,931. Prior to the election local Conservatives were leading a coalition with the Liberal Democrats with the Labour party as the council's official opposition.

The 2004 Wakefield Metropolitan District Council election took place on 10 June 2004 to elect members of Wakefield Metropolitan District Council in West Yorkshire, England. The whole council was up for election with boundary changes since the last election in 2003. The Labour party stayed in overall control of the council.

The 2003 South Tyneside Metropolitan Borough Council election took place on 1 May 2003 to elect members of South Tyneside Metropolitan Borough Council in Tyne and Wear, England. One third of the council was up for election and the Labour party kept overall control of the council.

The 2003 Sunderland Council election took place on 1 May 2003 to elect members of Sunderland Metropolitan Borough Council in Tyne and Wear, England. One third of the council was up for election and the Labour party stayed in overall control of the council.

The 2003 Sandwell Metropolitan Borough Council election took place on 1 May 2003 to elect members of Sandwell Metropolitan Borough Council in the West Midlands, England. One third of the council was up for election and the Labour party stayed in overall control of the council.

2007 Sandwell Metropolitan Borough Council election

The 2007 Sandwell Metropolitan Borough Council election took place on 3 May 2007 to elect members of Sandwell Metropolitan Borough Council in the West Midlands, England. One third of the council was up for election and the Labour party stayed in overall control of the council.

2011 Calderdale Metropolitan Borough Council election

Elections to Calderdale Metropolitan Borough Council took place on Thursday 5 May 2011.

2010 Calderdale Metropolitan Borough Council election

The 2010 Calderdale Metropolitan Borough Council election took place on 6 May 2010 to elect members of Calderdale Metropolitan Borough Council in England. This was on the same day as other local elections and a general election. One councillor was elected in each ward for a four-year term so the councillors elected in 2010 last stood for election in 2006. Each ward is represented by three councillors, the election of which is staggered, so only one third of the councillors was elected in this election. After the election the council stayed in no overall control but the Conservative minority administration was replaced with a coalition between Labour and the Liberal Democrats.

2012 Calderdale Metropolitan Borough Council election

The 2012 Calderdale Metropolitan Borough Council election took place on 3 May 2012 to elect members of Calderdale Metropolitan Borough Council in West Yorkshire, England. This was on the same day as other United Kingdom local elections, 2012. After the election the council continued to have no overall control and continue to be run by a coalition between the Labour Party and the Liberal Democrats.

2014 Calderdale Metropolitan Borough Council election

The 2014 Calderdale Metropolitan Borough Council election took place on 22 May 2014 to elect members of Calderdale Metropolitan Borough Council in England. This was on the same day as local elections across the United Kingdom and a European election. One councillor was elected in each of the 17 wards for a four-year term. There are three councillors representing each ward elected on a staggered basis so one third of the councillor seats were up for re-election. The seats had previously been contested in 2010 which was held in conjunction with a general election. The turnout was significantly lower in 2014 than in 2010 which is not unusual when comparing local elections that coincide with general elections to ones that do not. Prior to the election Labour was the largest party in the council with 21 out of 51 seats, 5 seats short of an overall majority. After the election there was no overall control of the council. Labour had 25 seats, only one short of a majority and so Labour continued to operate a minority administration.

2015 Calderdale Metropolitan Borough Council election

The 2015 Calderdale Metropolitan Borough Council election took place on 7 May 2015 to elect members of Calderdale in England. This was on the same day as other local elections and a general election. One councillor was elected in each ward for a four-year term so the councillors elected in 2015 last stood for election in 2011. Each ward is represented by three councillors, the election of which is staggered, so only one third of the councillors were elected in this election. Before the election there was no overall control with a minority Labour administration which was over-ruled at a Budget vote by a coalition of Conservatives & Liberal Democrats leading to a Conservative minority administration. After the election there was still no overall control & a Labour minority administration was formed again.

2016 Calderdale Metropolitan Borough Council election

The 2016 Calderdale Metropolitan Borough Council election took place on 5 May 2016 to elect members of Calderdale Metropolitan Borough Council in England. This was on the same day as other local elections. One councillor was elected in each ward for a four-year term so the councillors elected in 2016 last stood for election in 2012. Each ward is represented by three councillors, the election of which is staggered, so only one third of the councillors was elected in this election. Before the election there was no overall control with a minority Labour administration. After the election there was still no overall control so the minority Labour administration continued.

2018 Calderdale Metropolitan Borough Council election

The 2018 Calderdale Metropolitan Borough Council election took place on 3 May 2018 to elect members of Calderdale Metropolitan Borough Council in England. This was on the same day as other local elections. One councillor was elected in each ward for a four-year term so the councillors elected in 2018 last stood for election in 2014. Each ward is represented by three councillors, the election of which is staggered, so only one third of the councillors were elected in this election. Before the election there was no overall control with a minority Labour administration. Following the election Labour, having gained one councillor, was still two councillors away from a majority so it remained no overall control.

The Morley Borough Independents (MBI) are a local political party in Leeds, West Yorkshire, founded in 2004.

References

  1. Election of Local Councillors 2003. calderdale.gov.uk.
  2. Results at a glance. The Halifax Evening Courier.
  3. Real proof it's a wake-up call. The Halifax Evening Courier.
  4. BNP snatches win by 56 votes. The Halifax Evening Courier.
  5. Sweet revenge!. The Halifax Evening Courier.
  6. Lib-Dems oust Labour leader. The Halifax Evening Courier.
  7. Tense wait for veteran. The Halifax Evening Courier.
  8. Cheers ring out for Najib. The Halifax Evening Courier.
  9. Mixenden By-Election, 2003. calderdale.gov.uk.
  10. Liberal Democrats halt BNP bandwagon. The Halifax Evening Courier.