City of York Council election, 2003

Last updated

City of York Council Election, 2003
Flag of York.svg
  1999 1 May 2003 2007  

All 47 seats to City of York Council

  First party Second party Third party
 
Leader Steve Galloway Dave Merrett Andy D'Agorne
Party Liberal Democrat Labour Green
Leader since 1999 2002 N/A
Leader's seat Westfield Micklegate Fishergate
Last election 22 27 0
Seats before 24 25 0
Seats won 29 15 2
Seat changeIncrease2.svg7Decrease2.svg12Increase2.svg2
Popular vote 19,116 13,361 5,192
Percentage 42.5% 22.6% 8.8%

Leader of the Council before election

Dave Merrett
Labour

Leader of the Council after election

Steve Galloway
Liberal Democrat

Elections to City of York Council were held in 2003. The whole council was up for election. Boundary changes had reduced the number of seats from 53 to 47.

Contents

The election saw York's Labour Party lose control of the council covering central York for the first time since 1984. The Liberal Democrats won control of the council covering central York for the first time since the Liberal Party had last run the York Corporation in 1899.

York Historic city in the north of England

York is a historic walled city in North Yorkshire, England. At the confluence of the Rivers Ouse and Foss, it is the historic county town of the historic county of Yorkshire. York Minster and a variety of cultural and sporting activities make it a popular tourist destination.

The Labour Party is a centre-left political party in the United Kingdom which has been described as an alliance of social democrats, democratic socialists and trade unionists. The party's platform emphasises greater state intervention, social justice and strengthening workers' rights.

Liberal Democrats (UK) Political party in the United Kingdom

The Liberal Democrats are a liberal political party in the United Kingdom. They presently have 11 Members of Parliament in the House of Commons, 96 members of the House of Lords, and one member of the European Parliament. They also have five Members of the Scottish Parliament and a member each in the Welsh Assembly and London Assembly. The party reached the height of its influence in the early 2010s, forming a junior partner in a coalition government from 2010 to 2015. It is presently led by Vince Cable.

The Council was made up of 29 Liberal Democrats, 15 Labour, two Green and one independent. [1]

Election result

York local election result 2003
PartySeatsGainsLossesNet gain/lossSeats %Votes %Votes+/−
  Liberal Democrat 29 7 0 +7 61.7 42.5 25,142
  Labour 15 0 12 -12 31.9 22.6 13,361
  Conservative 0 0 3 -3 0 18.0 10,643
  Green 2 2 0 +2 4.3 8.8 5,192
  Independent 1 0 0 0

Ward results

Acomb Ward

Acomb (2) [2]
PartyCandidateVotes%
Labour Tracey Simpson-Laing 1,051 26.3
Labour David Horton 1,038 26.0
Liberal Democrat Robert Anderson 773 19.3
Liberal Democrat Julie Hook 630 15.8
Conservative Valmai Galvin 398 10.0
Monster Raving Loony Graham Cambridge 107 2.7
Turnout
Labour win (new seat)

Bishopthorpe Ward

Bishopthorpe [2]
PartyCandidateVotes%
Liberal Democrat David Livesley 989 58.5
Conservative Susan Williams 499 29.5
Labour Winifred Atkinson 202 12.0
Turnout
Liberal Democrat win (new seat)

Clifton Ward

Clifton (3) [2]
PartyCandidateVotes%
Labour Alan Jones 1,065 14.4
Labour Ken King 977 13.2
Labour David Scott 825 11.1
Liberal Democrat Joanna Macdonald 807 10.9
Liberal Democrat Simon Tarry 804 10.9
Liberal Democrat Samantha Waudby 724 9.8
Independent John Cook 625 8.4
Independent Leslie Marsh 612 8.3
Independent Stephen Prophet 546 7.4
Green William Shaw 421 5.7
Turnout
Labour win (new seat)

Derwent Ward

Derwent [2]
PartyCandidateVotes%
Liberal Democrat Janet Greenwood 808 56.6
Conservative Jenny Brooks 491 34.4
Labour Lesley Della Gana 128 9.0
Turnout
Liberal Democrat win (new seat)

Dringhouses and Woodthorpe Ward

Dringhouses and Woodthorpe (3) [2]
PartyCandidateVotes%
Liberal Democrat Ann Reid 2,052 19.5
Liberal Democrat Susan Sunderland 1,863 17.7
Liberal Democrat Thomas Holvey 1,704 16.2
Labour Bernard Bell 1,009 9.6
Labour Richard Cregan 829 7.9
Conservative Monica Garrity 813 7.7
Labour Gerard Hodgson 794 7.5
Conservative Alan Deanes 755 7.2
Conservative John Naylor 703 6.7
Turnout
Liberal Democrat win (new seat)

Fishergate Ward

Fishergate (2) [2]
PartyCandidateVotes%
Green Andy D'Agorne 1,093 25.6
Green Mark Hill 1,028 24.1
Labour John Boardman 555 13.0
Conservative Robin Dickson 533 12.5
Labour Roger Farrington 472 11.1
Liberal Democrat Karen Dunk 321 7.5
Liberal Democrat Derek Waudby 265 6.2
Turnout
Green win (new seat)

Fulford Ward

Fulford [2]
PartyCandidateVotes%
Liberal Democrat Keith Aspden 491 48.4
Labour Alan Smith 285 28.1
Conservative Walter Davy 162 16.0
Green Helen Kenwright 76 7.5
Turnout 1014
Liberal Democrat win (new seat)

Guildhall Ward

Guildhall (2) [2]
PartyCandidateVotes%
Labour Janet Looker 664 22.7
Labour Brian Watson 564 19.3
Liberal Democrat Nicholas Blitz 532 18.2
Liberal Democrat Philip Thomas 414 14.1
Conservative Nicholas Toms 319 10.9
Green Gillian Cossham 199 6.8
Green Denise Craghill 156 5.3
Socialist Alliance Mark Russell 78 2.7
Turnout
Labour win (new seat)

Haxby and Wigginton Ward

Haxby and Wigginton (3) [2]
PartyCandidateVotes%
Liberal Democrat Chas Hall 2,887 26.1
Liberal Democrat Chris Hogg 2,728 24.7
Liberal Democrat Richard Watson 2,528 22.9
Conservative Robert Phillips 724 6.6
Conservative Gareth Dadd 627 5.7
Green Alan Robertshaw 453 4.1
Labour Doris Bell 387 3.5
Labour Stephen Burton 383 3.5
Labour David Wilson 327 3.0
Turnout
Liberal Democrat win (new seat)

Heslington Ward

Heslington [2]
PartyCandidateVotes%
Liberal Democrat Ceredig Jamieson-Ball 381 54.1
Labour Martin Brumby 155 22.0
Conservative Richard Robeson 86 12.2
Green Candida Spillard 82 11.6
Turnout 704
Liberal Democrat win (new seat)

Heworth Ward

Heworth (3) [2]
PartyCandidateVotes%
Labour Vivienne Kind 1,483 18.8
Labour Paul Blanchard 1,381 17.5
Labour Ruth Potter 1,300 16.3
Liberal Democrat Nigel Ayre 1,020 13.0
Liberal Democrat Matthew Reid 924 11.7
Liberal Democrat Ian Packington 777 9.9
Conservative Patricia Kay 613 7.8
Green David Layfield 377 4.8
Turnout
Labour win (new seat)

Heworth Without Ward

Heworth Without [2]
PartyCandidateVotes%
Liberal Democrat Martin Lancelott 708 49.9
Conservative William Bennett 470 33.1
Labour David Thompson 240 16.9
Turnout
Liberal Democrat win (new seat)

Holgate Ward

Holgate (3) [2]
PartyCandidateVotes%
Liberal Democrat Martin Bartlett 1,626 17.8
Liberal Democrat Bill Fairclough 1,604 17.5
Liberal Democrat Gilbert Nimmo 1,392 15.2
Labour Elizabeth Edge 1,357 14.8
Labour Peter Finlay 1,239 13.5
Labour Annie Thompson 1,074 11.7
Conservative Nicholas Major 441 4.8
Green Mark Nicholson 424 4.6
Turnout
Liberal Democrat win (new seat)

Hull Road Ward

Hull Road (2) [2]
PartyCandidateVotes%
Labour Derek Smallwood 680 21.3
Labour David Wilde 678 21.2
Independent Gordon Campbell-Thomas 435 13.6
Conservative Duncan Flynn 390 12.2
Liberal Democrat Kevin Dunk 360 11.3
Liberal Democrat Susan Willer 343 10.7
Green John Cossham 313 9.8
Turnout
Labour win (new seat)

Huntington and New Earswick Ward

Huntington and New Earswick (3) [2]
PartyCandidateVotes%
Liberal Democrat Keith Orrell 2,236 25.5
Liberal Democrat Keith Hyman 2,186 24.9
Liberal Democrat Carol Runciman 1,969 22.4
Conservative Paul Tumman 755 8.6
Green Clive Woolley 608 6.9
Labour James Alexander 531 6.1
Labour Geoffrey Beacon 490 5.6
Turnout 2802
Liberal Democrat win (new seat)

Micklegate Ward

Micklegate (3) [2]
PartyCandidateVotes%
Labour Sandy Fraser 1,268 15.4
Labour Dave Merrett 1,260 15.3
Labour David Evans 1,198 14.5
Green Andy Chase 734 8.9
Liberal Democrat Simon Blackburn 654 7.9
Green Anthony Martin 599 7.3
Liberal Democrat Gillian Thompson 599 7.3
Liberal Democrat Ian Bunting 595 7.2
Green David King 579 7.0
Conservative Christopher Megone 565 6.9
Socialist Alliance Robert Looker 193 2.3
Turnout
Labour win (new seat)

Osbaldwick Ward

Osbaldwick [2]
PartyCandidateVotes%
Liberal Democrat Jonathan Morley 514 50.3
Independent Gerald Grisdale 391 38.3
Labour Andrew Garbutt 117 11.4
Turnout
Liberal Democrat win (new seat)

Rural West York Ward

Rural West York (3) [2]
PartyCandidateVotes%
Independent Janet Hopton 2,100 19.0
Liberal Democrat Quentin Macdonald 1,685 15.3
Liberal Democrat Glen Bradley 1,405 12.7
Conservative Adam Sinclair 1,336 12.1
Liberal Democrat Carole Green 1,316 11.9
Conservative Ian Gillies 1,212 11.0
Conservative George Thomson-Smith 1,016 9.2
Labour Annette Brumby 527 4.8
Labour Iain Simpson-Laing 440 4.0
Turnout
Independent win (new seat)
Liberal Democrat win (new seat)

Skelton, Rawcliffe and Clifton Without Ward

Skelton, Rawcliffe and Clifton Without (3) [2]
PartyCandidateVotes%
Liberal Democrat Irene Waudby 1,912 20.8
Liberal Democrat Mark Waudby 1,630 17.8
Liberal Democrat Richard Moore 1,534 16.7
Independent Victor Paylor 853 9.3
Labour Anthony Ireland 645 7.0
Conservative Peter Gibson 589 6.4
Conservative Andrew Kay 562 6.1
Labour Matthew Page 536 5.8
Labour Maureen Smith 518 5.6
Green Andrew Dearden 403 4.4
Turnout
Liberal Democrat win (new seat)

Strensall Ward

Strensall (2) [2]
PartyCandidateVotes%
Liberal Democrat Madeleine Kirk 1,113 29.6
Liberal Democrat Ian Cuthbertson 996 26.5
Conservative Jonathan Moore 686 18.2
Conservative William Hanbury 599 15.9
Labour Robert Guthrie 199 5.3
Labour Karl Smith 167 4.4
Turnout
Liberal Democrat win (new seat)

Westfield Ward

Westfield (3) [2]
PartyCandidateVotes%
Liberal Democrat Steve Galloway 2,291 26.3
Liberal Democrat Andrew Waller 2,154 24.7
Liberal Democrat Sue Galloway 2,013 23.1
Labour Paul Baptie 697 8.0
Labour Thomas Gibson 641 7.3
Labour James Tipton 613 7.9
Conservative Ken Beavan 314 3.6
Turnout
Liberal Democrat win (new seat)

Wheldrake Ward

Wheldrake [2]
PartyCandidateVotes%
Liberal Democrat Christian Vassie 982 62.7
Conservative John Galvin 459 29.3
Labour Edward Gouge 124 7.9
Turnout 1565
Liberal Democrat win (new seat)

Related Research Articles

Liverpool City Council Local government body in England

Liverpool City Council is the governing body for the city of Liverpool in Merseyside, England. It consists of 90 councillors, three for each of the city's 30 wards.

Sunderland City Council Local government body in England

Sunderland City Council is the local authority of the City of Sunderland in Tyne and Wear, England. It is a metropolitan district council, one of five in Tyne and Wear and one of 36 in the metropolitan counties of England, and provides the majority of local government services in Sunderland.

2003 Bolton Metropolitan Borough Council election

Elections to Bolton Metropolitan Borough Council were held on 1 May 2003. One third of the council was up for election and the Labour party lost overall control of the council to no overall control, for the first time since 1980.

2006 Camden London Borough Council election

The 2006 Camden Council election took place on 4 May 2006 to elect members of Camden London Borough Council in London, England. The whole council was up for election and the Labour Party lost overall control of the council to no overall control.

The 2003 Redditch Borough Council election took place on 1 May 2003 to elect members of Redditch Borough Council in the West Midlands region, England. One third of the council was up for election and the council stayed under no overall control.

2002 Croydon London Borough Council election

Elections to Croydon Council in London, England were held on 4 May 2002. The whole council was up for election for the first time since the 1998 election. The Labour Party managed to keep control of the council which it had done since 1994 when it took power away from the Conservative Party. This year Labour held Croydon with a smaller majority, only clinging onto power through a tiny number of votes in its marginal wards - one councillor won by just eight votes.

Elections to the Borough Council in Slough, England, were held on 1 May 2008. This was the 123rd Slough general local authority election since Slough became a local government unit in 1863.

The 2003 Worthing Borough Council election took place on 1 May 2003 to elect members of Worthing Borough Council in West Sussex, England. One third of the council was up for election and the Liberal Democrats lost overall control of the council to no overall control. Overall turnout was 28.61%.

2007 Hull City Council election

The 2007 Hull City Council election took place on 3 May 2007 to elect members of Hull City Council in England. One third of the council was up for election and the Liberal Democrats gained overall control of the council from no overall control. Overall turnout was 27%.

2007 Woking Borough Council election

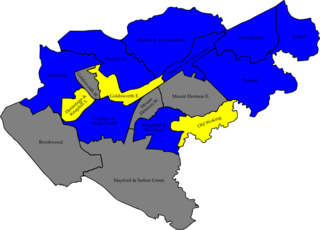
The 2007 Woking Council election took place on 3 May 2007 to elect members of Woking Borough Council in Surrey, England. One third of the council was up for election and the Conservative party gained overall control of the council from no overall control.

2003 Southampton City Council election

The 2003 Southampton Council election took place on 1 May 2003 to elect members of Southampton Unitary Council in Hampshire, England. One third of the council was up for election and the council stayed under no overall control.

2003 Pendle Borough Council election

The 2003 Pendle Borough Council election took place on 1 May 2003 to elect members of Pendle Borough Council in Lancashire, England. One third of the council was up for election and the council stayed under no overall control.

The 2003 Sandwell Metropolitan Borough Council election took place on 1 May 2003 to elect members of Sandwell Metropolitan Borough Council in the West Midlands, England. One third of the council was up for election and the Labour party stayed in overall control of the council.

The 2011 council elections in Guildford saw the Conservatives retain control over Guildford Borough Council with an increased majority of 20 seats. Full results for each ward can be found at Guildford Council election, full results, 2011.

2012 Norwich City Council election

Elections to Norwich City Council took place on 3 May 2012, the same day as other United Kingdom local elections, 2012. Fifteen out of thirty-nine council seats were up for election and the Labour party gained control of the council from No Overall Control.

2006 Brent London Borough Council election

The 2006 Brent London Borough Council election took place on 4 May 2006 to elect members of Brent London Borough Council in London, England. The whole council was up for election and the Labour party lost overall control of the council to no overall control.

Elections to Broxtowe Borough Council were held on 7 May 2015 to elect all 44 members to the Councils 20 electoral wards each electing between 1 and 3 members who will each serve a 4-year term expiring in 2019.

2003 Wychavon District Council election

The 2003 Wychavon District Council election took place on 1 May 2003 to elect members of Wychavon District Council in Worcestershire, England. The whole council was up for election with boundary changes since the last election in 1999 reducing the number of seats by four. The Conservative party stayed in overall control of the council.

2003 West Oxfordshire District Council election

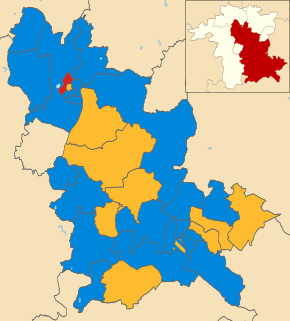
The 2003 West Oxfordshire District Council election took place on 1 May 2003 to elect members of West Oxfordshire District Council in Oxfordshire, England. One third of the council was up for election and the Conservative party stayed in overall control of the council.

References

[2]

  1. Edwards, Richard (2 May 2003). "Landslide". North Yorkshire County Publications (England) via (online NewsBank.
  2. 1 2 3 4 5 6 7 8 9 10 11 12 13 14 15 16 17 18 19 20 21 22 23 "Election results May 2003".