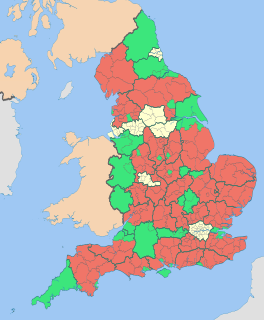
The 2011 Aylesbury Vale District Council election took place on 5 May 2011 to elect members of Aylesbury Vale District Council in Buckinghamshire, England. The whole council was up for election and the Conservative party stayed in overall control of the council. [1]
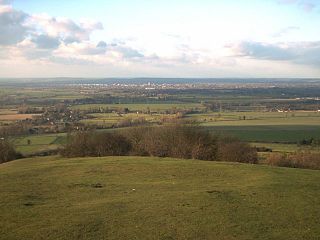
The Aylesbury Vale is a large area of gently rolling agricultural landscape located in the northern half of Buckinghamshire, England. Its boundary is marked by the Borough of Milton Keynes and South Northamptonshire to the north, Central Bedfordshire and the Borough of Dacorum (Hertfordshire) to the east, the Chiltern Hills and Wycombe to south, and South Oxfordshire to the west.
Non-metropolitan districts, or colloquially "shire districts", are a type of local government district in England. As created, they are sub-divisions of non-metropolitan counties in a two-tier arrangement.
Buckinghamshire, abbreviated Bucks, is a county in South East England which borders Greater London to the south east, Berkshire to the south, Oxfordshire to the west, Northamptonshire to the north, Bedfordshire to the north east and Hertfordshire to the east.
The results saw the Conservatives retain control of the council after winning 37 of the 59 seats. [2] Conservative cabinet member Huw Lewis lost in Buckingham North, but the party gained a seat in Aylesbury Central by 1 vote over Liberal Democrat mayor Graham Webster. [2] The Liberal Democrats lost seats, dropping to 17 councillors, with the Liberal Democrat group leader Alan Sherwell being defeated in Bedgrove. [2]
A Cabinet is a body of high-ranking state officials, typically consisting of the top leaders of the executive branch. Members of a cabinet are usually called Cabinet ministers or secretaries. The function of a Cabinet varies: in some countries it is a collegiate decision-making body with collective responsibility, while in others it may function either as a purely advisory body or an assisting institution to a decision making head of state or head of government. Cabinets are typically the body responsible for the day-to-day management of the government and response to sudden events, whereas the legislative and judicial branches work in a measured pace, in sessions according to lengthy procedures.
A Councillor is a member of a local government council.
Bedgrove is one of the housing estates of the modern town of Aylesbury in Buckinghamshire, though it takes its name from a farm and hamlet that stood in the area until the area was cleared for building in the late 1950s. At the time it was built it was the largest housing estate of its kind in the country. The housing estate is on the south side of the town. The farm was where Pevensey Close now stands.
Both the UK Independence Party and the Labour party won 2 seats, while independent Peter Cooper retained his seat in Wingrave. [2] For the UK Independence Party the 2 seats they won in Quarrendon were the first seats the party had ever won on the council, while Labour returned to the council for the first time in over 10 years after winning seats in Buckingham South and Southcourt. [2]
The UK Independence Party is a hard Eurosceptic, right-wing political party in the United Kingdom. It currently has one representative in the House of Lords and seven Members of the European Parliament (MEPs). It has four Assembly Members (AMs) in the National Assembly for Wales and one member in the London Assembly. The party reached its greatest level of success in the mid-2010s, when it gained two Members of Parliament and was the largest UK party in the European Parliament.
An independent or nonpartisan politician is an individual politician not affiliated with any political party. There are numerous reasons why someone may stand for office as an independent.
Wingrave is a village in Buckinghamshire, England, about four miles north east of Aylesbury and three miles south west of Wing.
Party | Seats | Gains | Losses | Net gain/loss | Seats % | Votes % | Votes | +/− | |
---|---|---|---|---|---|---|---|---|---|
Conservative | 37 | 4 | 4 | 0 | 62.7 | 49.0 | 52,956 | -3.5% | |
Liberal Democrat | 17 | 3 | 7 | -4 | 28.8 | 25.3 | 27,351 | -9.8% | |
UKIP | 2 | 2 | 0 | +2 | 3.4 | 14.7 | 15,891 | +9.6% | |
Labour | 2 | 2 | 0 | +2 | 3.4 | 7.3 | 7,886 | +2.3% | |
Independent | 1 | 0 | 0 | 0 | 1.7 | 3.1 | 3,396 | +0.8% | |
Green | 0 | 0 | 0 | 0 | 0 | 0.4 | 459 | +0.4% | |
TUSC | 0 | 0 | 0 | 0 | 0 | 0.2 | 183 | +0.2% |
Party | Candidate | Votes | % | ± | |
---|---|---|---|---|---|
Conservative | Carole Paternoster | 2,375 | |||
Conservative | Phil Yerby | 2,223 | |||
Conservative | David Thompson | 1,990 | |||
Independent | Nigel Hayward | 843 | |||
Liberal Democrat | Jeremy Hodge | 796 | |||
Liberal Democrat | Claire Houston | 524 | |||
UKIP | John Day | 446 | |||
UKIP | Pauline Day | 432 | |||
Liberal Democrat | Neil Stuart | 425 | |||
UKIP | William Hamilton | 401 | |||
Turnout | 10,455 | 51.0 | +9 | ||
Conservative hold | Swing | ||||
Party | Candidate | Votes | % | ± | |
---|---|---|---|---|---|
Conservative | Barbara Russel | 307 | 31.8 | -4.5 | |
Liberal Democrat | Graham Webster | 306 | 31.7 | -20.8 | |
Labour | Michael Padmore | 253 | 26.2 | +26.2 | |
UKIP | Stephen Barrow | 99 | 10.3 | -0.9 | |
Majority | 1 | 0.1 | |||
Turnout | 965 | 34.7 | -1 | ||
Conservative gain from Liberal Democrat | Swing | ||||
Party | Candidate | Votes | % | ± | |
---|---|---|---|---|---|
Conservative | Jenny Bloom | 1,624 | |||
Conservative | Tom Hunter-Watts | 1,359 | |||
Conservative | Mark Winn | 1,353 | |||
Liberal Democrat | Penni Thorne | 1,297 | |||
Liberal Democrat | Alan Sherwell | 1,157 | |||
Liberal Democrat | Mark Willis | 1,105 | |||
Labour | Ruth McGoldrick | 408 | |||
UKIP | Charly Smith | 408 | |||
UKIP | Jamie Boyce | 398 | |||
UKIP | Daniel Lewis | 378 | |||
Labour | Martin Abel | 365 | |||
Turnout | 9,852 | 51.7 | +4 | ||
Conservative hold | Swing | ||||
Conservative gain from Liberal Democrat | Swing | ||||
Party | Candidate | Votes | % | ± | |
---|---|---|---|---|---|
Liberal Democrat | Julie Ward | 461 | 57.6 | +2.9 | |
Conservative | Bill Chapple | 206 | 25.7 | -13.1 | |
Labour | Steve Perry | 75 | 9.4 | +9.4 | |
UKIP | Nicola Adams | 59 | 7.4 | +0.9 | |
Majority | 255 | 31.8 | +15.9 | ||
Turnout | 801 | 57.0 | +5 | ||
Liberal Democrat hold | Swing | ||||
Party | Candidate | Votes | % | ± | |
---|---|---|---|---|---|
Conservative | Michael Rand | 693 | 59.4 | -3.2 | |
Labour | Joanna Dodsworth | 230 | 19.7 | -0.3 | |
Liberal Democrat | Bette Melling | 173 | 14.8 | -2.6 | |
UKIP | Deborah Sharman | 70 | 6.0 | +6.0 | |
Majority | 463 | 39.7 | -2.9 | ||
Turnout | 1,166 | 56.8 | +10 | ||
Conservative hold | Swing | ||||
Party | Candidate | Votes | % | ± | |
---|---|---|---|---|---|
Conservative | Derrick Isham | 855 | |||
Conservative | Tim Mills | 788 | |||
Labour | Rob Lehmann | 609 | |||
Labour | Mike Smith | 499 | |||
Independent | Andy Mahi | 351 | |||
UKIP | John Russell | 177 | |||
UKIP | Mark Hazle | 119 | |||
Turnout | 3,398 | 36.9 | +8 | ||
Conservative hold | Swing | ||||
Party | Candidate | Votes | % | ± | |
---|---|---|---|---|---|
Conservative | Howard Mordue | 875 | |||
Labour | Robin Stuchbury | 843 | |||
Conservative | Huw Lewis | 778 | |||
Labour | Jon Harvey | 446 | |||
UKIP | Paul Hazle | 98 | |||
UKIP | Nicola Paine | 95 | |||
Turnout | 3,135 | 40.9 | +7 | ||
Conservative hold | Swing | ||||
Labour gain from Conservative | Swing | ||||
Party | Candidate | Votes | % | ± | |
---|---|---|---|---|---|
Liberal Democrat | Corry Cashman | 800 | 59.5 | +10.9 | |
Conservative | Lawrence Renshell | 436 | 32.4 | -10.6 | |
UKIP | Nicholas Griffin | 108 | 8.0 | -0.5 | |
Majority | 364 | 27.1 | +21.5 | ||
Turnout | 1,344 | 56.0 | +5 | ||
Liberal Democrat hold | Swing | ||||
Party | Candidate | Votes | % | ± | |
---|---|---|---|---|---|
Liberal Democrat | Steven Lambert | 1,239 | |||
Liberal Democrat | Paul Hughes | 1,059 | |||
Liberal Democrat | Mike Smith | 1,043 | |||
Conservative | Andrew Cole | 977 | |||
Conservative | Sam Davidson | 739 | |||
Conservative | Talib Hussain | 679 | |||
UKIP | Bruce Bolton | 373 | |||
UKIP | Gavin Richardson | 371 | |||
UKIP | Stefanie Falle | 314 | |||
Turnout | 6,794 | 38.8 | +5 | ||
Liberal Democrat hold | Swing | ||||
Liberal Democrat gain from Conservative | Swing | ||||
Party | Candidate | Votes | % | ± | |
---|---|---|---|---|---|
Conservative | Chris Poll | 560 | 46.2 | -13.7 | |
Independent | Kevin Cubbage | 489 | 40.3 | +40.3 | |
Labour | Bob Kempster | 102 | 8.4 | +8.4 | |
UKIP | Emma Griffin | 62 | 5.1 | -10.1 | |
Majority | 71 | 5.9 | -29.4 | ||
Turnout | 1,213 | 52.7 | +3 | ||
Conservative hold | Swing | ||||
Party | Candidate | Votes | % | ± | |
---|---|---|---|---|---|
Liberal Democrat | Raj Khan | 945 | |||
Liberal Democrat | Lisa Smith | 880 | |||
Conservative | Alan Ward | 794 | |||
Conservative | Gillian Neale-Sheppard | 714 | |||
Liberal Democrat | Ansar Mahmood | 707 | |||
Conservative | Mike Arrowsmith | 690 | |||
UKIP | Brian Adams | 474 | |||
UKIP | Ann Day | 443 | |||
Labour | Michael Rowlinson | 418 | |||
UKIP | Pat Norris | 406 | |||
Turnout | 6,471 | 38.0 | +3 | ||
Liberal Democrat hold | Swing | ||||
Conservative gain from Liberal Democrat | Swing | ||||
Party | Candidate | Votes | % | ± | |
---|---|---|---|---|---|
Liberal Democrat | Tuffail Hussain | 622 | |||
Liberal Democrat | Stuart Jarvis | 580 | |||
Conservative | Paul Milham | 342 | |||
Conservative | Dvora Kader | 288 | |||
Labour | Shirley Raw | 279 | |||
UKIP | Barbara Adams | 256 | |||
UKIP | Alex Furness | 233 | |||
Turnout | 2,600 | 33.0 | +4 | ||
Liberal Democrat hold | Swing | ||||
Party | Candidate | Votes | % | ± | |
---|---|---|---|---|---|
Conservative | Neil Blake | 856 | 71.7 | +3.5 | |
Liberal Democrat | Clive Parish | 196 | 16.4 | -8.6 | |
UKIP | Amber Pinnock | 142 | 11.9 | +5.1 | |
Majority | 660 | 55.3 | +12.1 | ||
Turnout | 1,194 | 48.7 | +8 | ||
Conservative hold | Swing | ||||
Party | Candidate | Votes | % | ± | |
---|---|---|---|---|---|
Conservative | Beville Stanier | 818 | 65.0 | -22.1 | |
Labour | Christine Strain-Clark | 162 | 12.9 | +12.9 | |
Liberal Democrat | David Barry | 146 | 11.6 | +11.6 | |
UKIP | Sasha Bates | 133 | 10.6 | -2.3 | |
Majority | 656 | 52.1 | -22.1 | ||
Turnout | 1,259 | 52.5 | +12 | ||
Conservative hold | Swing | ||||
Party | Candidate | Votes | % | ± | |
---|---|---|---|---|---|
Conservative | John Cartwright | 575 | 55.1 | -20.8 | |
UKIP | Paul Irwin | 314 | 30.1 | +30.1 | |
Liberal Democrat | Patrick Mahon | 155 | 14.8 | -9.3 | |
Majority | 261 | 25.0 | -26.8 | ||
Turnout | 1,044 | 51.2 | +8 | ||
Conservative hold | Swing | ||||
Party | Candidate | Votes | % | ± | |
---|---|---|---|---|---|
Conservative | Judy Brandis | 2,393 | |||
Conservative | Brian Foster | 2,145 | |||
Conservative | Andrew Douglas-Bate | 1,912 | |||
Liberal Democrat | Bob Hammond | 1,058 | |||
UKIP | Lisa Natale | 429 | |||
UKIP | Amethyst Sharman | 332 | |||
UKIP | Brett Steptowe | 317 | |||
Turnout | 8,586 | 51.7 | +4 | ||
Conservative hold | Swing | ||||
Party | Candidate | Votes | % | ± | |
---|---|---|---|---|---|
Conservative | Michael Edmonds | 1,185 | |||
Conservative | Mike Hawkett | 1,043 | |||
Independent | Ann Hooton | 625 | |||
Liberal Democrat | Lesley Dunbar | 369 | |||
Labour | Elizabeth Liggett | 358 | |||
UKIP | Colin Evered | 156 | |||
UKIP | Jonathan Evered | 132 | |||
Turnout | 3,510 | 53.4 | +5 | ||
Conservative hold | Swing | ||||
Party | Candidate | Votes | % | ± | |
---|---|---|---|---|---|
Conservative | Pearl Lewis | 639 | 63.5 | -16.9 | |
Labour | Tony Chan | 127 | 12.6 | -7.0 | |
Green | Nicola Smith | 102 | 10.1 | +10.1 | |
UKIP | Stephen Boyce | 81 | 8.1 | +8.1 | |
Liberal Democrat | Paul Burns | 57 | 5.7 | +5.7 | |
Majority | 512 | 50.9 | -9.9 | ||
Turnout | 1,006 | 49.0 | +8 | ||
Conservative hold | Swing | ||||
Party | Candidate | Votes | % | ± | |
---|---|---|---|---|---|
Conservative | Sue Chapple | 1,473 | |||
Conservative | Brian Roberts | 1,411 | |||
Conservative | Brian Tyndall | 1,203 | |||
Liberal Democrat | Richard Lloyd | 532 | |||
Liberal Democrat | Laurence Hughes | 490 | |||
Liberal Democrat | Peter Vernon | 476 | |||
UKIP | Heather Adams | 457 | |||
UKIP | Gerard McCormack | 360 | |||
Green | Nigel Foster | 357 | |||
UKIP | Aimee Gibson | 354 | |||
Turnout | 7,113 | 41.5 | +2 | ||
Conservative hold | Swing | ||||
Party | Candidate | Votes | % | ± | |
---|---|---|---|---|---|
Conservative | Jackie Phipps | 817 | 61.6 | +0.4 | |
Liberal Democrat | Ian Metherell | 349 | 26.3 | -12.5 | |
UKIP | Sam Clinton | 160 | 12.1 | +12.1 | |
Majority | 468 | 35.3 | +12.9 | ||
Turnout | 1,326 | 52.0 | +3 | ||
Conservative hold | Swing | ||||
Party | Candidate | Votes | % | ± | |
---|---|---|---|---|---|
Conservative | Pam Pearce | 785 | 75.6 | +12.1 | |
Liberal Democrat | Jonathan Ginn | 130 | 12.5 | -24.0 | |
UKIP | Roy Black | 123 | 11.8 | +11.8 | |
Majority | 655 | 63.1 | +36.1 | ||
Turnout | 1,038 | 52.2 | -1 | ||
Conservative hold | Swing | ||||
Party | Candidate | Votes | % | ± | |
---|---|---|---|---|---|
Liberal Democrat | Steve Patrick | 475 | |||
Liberal Democrat | Glenda Reynolds | 437 | |||
Conservative | Denise Summers | 431 | |||
Conservative | Tim Weston | 419 | |||
Labour | Roy McNickle | 336 | |||
Independent | Patrick Martin | 288 | |||
Labour | Phil McGoldrick | 246 | |||
UKIP | Robyn Adams | 205 | |||
UKIP | Nikita Filbey | 164 | |||
Turnout | 3,001 | 39.6 | +7 | ||
Liberal Democrat hold | Swing | ||||
Party | Candidate | Votes | % | ± | |
---|---|---|---|---|---|
Liberal Democrat | Avril Davies | 805 | 64.3 | -5.3 | |
Conservative | Angela Macpherson | 335 | 26.8 | -3.6 | |
UKIP | Paula Boyce | 111 | 8.9 | +8.9 | |
Majority | 470 | 37.6 | -1.6 | ||
Turnout | 1,251 | 46.0 | +3 | ||
Liberal Democrat hold | Swing | ||||
Party | Candidate | Votes | % | ± | |
---|---|---|---|---|---|
Conservative | Sue Polhill | 637 | 52.2 | -17.2 | |
UKIP | Jim Styles | 397 | 32.5 | +32.5 | |
Liberal Democrat | Patrina Law | 187 | 15.3 | +0.4 | |
Majority | 240 | 19.7 | -34.0 | ||
Turnout | 1,221 | 61.1 | +13 | ||
Conservative hold | Swing | ||||
Party | Candidate | Votes | % | ± | |
---|---|---|---|---|---|
UKIP | Chris Adams | 399 | |||
UKIP | Andy Huxley | 362 | |||
Liberal Democrat | Ray Ghent | 335 | |||
Liberal Democrat | Maria Butler | 286 | |||
Conservative | Noreen O'Sullivan | 282 | |||
Labour | David Caldwell | 210 | |||
Conservative | Wajid Kiani | 208 | |||
Labour | Zard Khan | 166 | |||
Turnout | 2,248 | 32.2 | -7 | ||
UKIP gain from Liberal Democrat | Swing | ||||
Party | Candidate | Votes | % | ± | |
---|---|---|---|---|---|
Liberal Democrat | Freda Roberts | 539 | |||
Labour | Michael Beall | 442 | |||
Liberal Democrat | David Ralph | 412 | |||
Labour | Andrew Cowburn | 399 | |||
Conservative | Anis Gabbur | 307 | |||
Conservative | Henry Hall | 234 | |||
UKIP | Sheila Hamilton | 211 | |||
UKIP | Petra Johns | 180 | |||
Turnout | 2,724 | 32.0 | +0 | ||
Liberal Democrat hold | Swing | ||||
Labour gain from Liberal Democrat | Swing | ||||
Party | Candidate | Votes | % | ± | |
---|---|---|---|---|---|
Conservative | John Chilver | 533 | 55.9 | +9.6 | |
UKIP | Guy Lachlan | 154 | 16.1 | +16.1 | |
Labour | David Seabrook | 148 | 15.5 | +8.3 | |
Liberal Democrat | Gareth Davies | 119 | 12.5 | +12.5 | |
Majority | 379 | 39.7 | +21.8 | ||
Turnout | 954 | 42.8 | +6 | ||
Conservative hold | Swing | ||||
Party | Candidate | Votes | % | ± | |
---|---|---|---|---|---|
Conservative | Janet Blake | 795 | 63.2 | ||
Liberal Democrat | Lucy Monger | 340 | 27.0 | ||
UKIP | Josh Richardson | 123 | 9.8 | ||
Majority | 455 | 36.2 | |||
Turnout | 1,258 | 53.6 | |||
Conservative hold | Swing | ||||
Party | Candidate | Votes | % | ± | |
---|---|---|---|---|---|
Conservative | Patrick Fealey | 885 | 69.4 | +0.5 | |
Labour | Jack Stuchbury | 269 | 21.1 | +0.8 | |
UKIP | Sheila Sewell | 121 | 9.5 | +9.5 | |
Majority | 616 | 48.3 | -0.3 | ||
Turnout | 1,275 | 49.0 | +2 | ||
Conservative hold | Swing | ||||
Party | Candidate | Votes | % | ± | |
---|---|---|---|---|---|
Liberal Democrat | David Vick | 413 | 37.5 | +26.6 | |
UKIP | Dave Fowler | 328 | 29.8 | -10.8 | |
Conservative | David Wilkes | 274 | 24.9 | -23.7 | |
Labour | Sue Roberts | 86 | 7.8 | +7.8 | |
Majority | 85 | 7.7 | |||
Turnout | 1,101 | 56.2 | +7 | ||
Liberal Democrat gain from Conservative | Swing | ||||
Party | Candidate | Votes | % | ± | |
---|---|---|---|---|---|
Liberal Democrat | Steven Kennell | 572 | |||
Liberal Democrat | Ranjula Takodra | 534 | |||
Conservative | Sarah Sproat | 374 | |||
Conservative | Mark Wilkins | 306 | |||
UKIP | Jessica Black | 298 | |||
UKIP | John Wiseman | 261 | |||
TUSC | Roger Priest | 183 | |||
Turnout | 2,528 | 33.0 | +2 | ||
Liberal Democrat hold | Swing | ||||
Party | Candidate | Votes | % | ± | |
---|---|---|---|---|---|
Conservative | Ashley Bond | 522 | 53.2 | -17.4 | |
Liberal Democrat | Mary Baldwin | 174 | 17.7 | +6.9 | |
Labour | Maggie Ewan | 159 | 16.2 | +4.4 | |
UKIP | Tony Ward | 127 | 12.9 | +6.0 | |
Majority | 348 | 35.4 | -23.4 | ||
Turnout | 982 | 45.0 | -5 | ||
Conservative hold | Swing | ||||
Party | Candidate | Votes | % | ± | |
---|---|---|---|---|---|
Conservative | Chris Richards | 1,679 | |||
Conservative | Peter Strachan | 1,574 | |||
Conservative | Steve Bowles | 1,521 | |||
UKIP | Derek Coles | 744 | |||
UKIP | John Lesingham | 716 | |||
UKIP | Clinton Ruddock | 641 | |||
Liberal Democrat | Katie Willis | 609 | |||
Liberal Democrat | Christine Smith | 553 | |||
Liberal Democrat | Simon Weaver | 493 | |||
Turnout | 8,530 | 49.3 | +7 | ||
Conservative hold | Swing | ||||
Party | Candidate | Votes | % | ± | |
---|---|---|---|---|---|
Conservative | Netta Glover | 700 | 67.2 | -4.7 | |
Liberal Democrat | Mark Watson | 236 | 22.6 | +3.9 | |
UKIP | Martin Norris | 106 | 10.2 | +0.8 | |
Majority | 464 | 44.5 | -8.7 | ||
Turnout | 1,042 | 48.2 | +9 | ||
Conservative hold | Swing | ||||
Party | Candidate | Votes | % | ± | |
---|---|---|---|---|---|
Independent | Peter Cooper | 800 | 70.2 | +12.3 | |
Conservative | Kevin Hewson | 290 | 25.4 | -5.1 | |
UKIP | Natasha Mitchell | 50 | 4.4 | +4.4 | |
Majority | 510 | 44.7 | +17.3 | ||
Turnout | 1,140 | 54.6 | +10 | ||
Independent hold | Swing | ||||
Party | Candidate | Votes | % | ± | |
---|---|---|---|---|---|
Liberal Democrat | Llew Monger | 982 | |||
Conservative | Susan Renshell | 918 | |||
Conservative | Duncan Wigley | 832 | |||
Liberal Democrat | Trish Cawte | 773 | |||
Labour | Peter Strain-Clark | 251 | |||
UKIP | Jonathan Bates | 245 | |||
UKIP | Phil Gomm | 238 | |||
Turnout | 4,239 | 49.4 | +6 | ||
Liberal Democrat gain from Conservative | Swing | ||||
Conservative hold | Swing | ||||
A by-election was held in Oakfield on 3 October 2013 after the death of Liberal Democrat councillor Steve Patrick. [6] The seat was held for the Liberal Democrats by Alison Harrison with a majority of 81 votes over UK Independence Party candidate Philip Gomm. [7]
By-elections, also spelled bye-elections, are used to fill elected offices that have become vacant between general elections.
Party | Candidate | Votes | % | ± | |
---|---|---|---|---|---|
Liberal Democrat | Alison Harrison | 406 | 34.8 | +7.4 | |
UKIP | Philip Gomm | 325 | 27.8 | +16.0 | |
Conservative | Edward Sims | 173 | 14.8 | -10.0 | |
Labour | Robert McNickle | 145 | 12.4 | -6.9 | |
Independent | Patrick Martin | 118 | 10.1 | -6.5 | |
Majority | 81 | 6.9 | |||
Turnout | 1,167 | 28.7 | -10.9 | ||
Liberal Democrat hold | Swing | ||||
A by-election was held in Gatehouse on 11 December 2014 after the resignation of Liberal Democrat councillor Stuart Jarvis. [8] The seat was held for the Liberal Democrats by Anders Christensen with a majority of 28 votes over UK Independence Party candidate Graham Cadle. [8] [9]
Party | Candidate | Votes | % | ± | |
---|---|---|---|---|---|
Liberal Democrat | Anders Christensen | 295 | 35.6 | -5.9 | |
UKIP | Graham Cadle | 267 | 32.2 | +15.2 | |
Conservative | Samantha North | 113 | 13.6 | -9.2 | |
Labour | Lucio Tangi | 113 | 13.6 | -5.0 | |
Green | Mary Hunt | 28 | 3.4 | +3.4 | |
Independent | George Entecott | 12 | 1.4 | +1.4 | |
Majority | 28 | 3.4 | |||
Turnout | 828 | 17.7 | -15.3 | ||
Liberal Democrat hold | Swing | ||||
A by-election was held in Southcourt on 11 December 2014 after the resignation of Labour councillor Michael Beall. [8] The seat was gained for the Liberal Democrats by Peter Agoro with a majority of 163 votes over UK Independence Party candidate Brian Adams. [8] [10]
Party | Candidate | Votes | % | ± | |
---|---|---|---|---|---|
Liberal Democrat | Peter Agoro | 429 | 42.3 | +6.3 | |
UKIP | Brian Adams | 266 | 26.2 | +12.1 | |
Labour | Mark Bateman | 175 | 17.2 | -12.2 | |
Conservative | Sarah Sproat | 112 | 11.0 | -9.4 | |
Green | Jedrze Kulig | 33 | 3.3 | +3.3 | |
Majority | 163 | 16.1 | |||
Turnout | 1,015 | 21.0 | -11.0 | ||
Liberal Democrat gain from Labour | Swing | ||||
Aylesbury is a constituency created in 1553 — created as a single-member seat in 1885 — represented in the House of Commons of the United Kingdom since 1992 by David Lidington, of the Conservative Party.
Buckingham /ˈbʌkɪŋm̩/ is a constituency represented in the House of Commons of the UK Parliament since 1997 by former Conservative MP John Bercow, who later became Speaker of the House of Commons.
The 2011 Babergh Council election took place on 5 May 2011 to elect members of Babergh District Council in Suffolk, England. The whole council was up for election and the council stayed under no overall control.
The 2008 Tandridge District Council election took place on 1 May 2008 to elect members of Tandridge District Council in Surrey, England. One third of the council was up for election and the Conservative party stayed in overall control of the council.
The 2011 council elections in Guildford saw the Conservatives retain control over Guildford Borough Council with an increased majority of 20 seats. Full results for each ward can be found at Guildford Council election, full results, 2011.
The 1999 Wealden District Council election took place on 6 May 1999 to elect members of Wealden District Council in East Sussex, England. The whole council was up for election and the Conservative party stayed in overall control of the council.
The 2011 Wealden District Council election took place on 5 May 2011 to elect members of Wealden District Council in East Sussex, England. The whole council was up for election and the Conservative party stayed in overall control of the council.
The 2014 St Albans City and District Council election took place on 22 May 2014 to elect members of St Albans District Council in Hertfordshire, England. One third of the council was up for election and the council stayed under no overall control.
The 2011 East Dorset District Council election took place on 5 May 2011 to elect members of East Dorset District Council in Dorset, England. The whole council was up for election and the Conservative party stayed in overall control of the council.
The 2011 Torridge District Council election took place on 5 May 2011 to elect members of Torridge District Council in Devon, England. The whole council was up for election and the council stayed under no overall control.
The 2012 Huntingdonshire District Council election took place on 3 May 2012 to elect members of Huntingdonshire District Council in Cambridgeshire, England. One third of the council was up for election and the Conservative party stayed in overall control of the council.
The 2014 Huntingdonshire District Council election took place on 22 May 2014 to elect members of Huntingdonshire District Council in Cambridgeshire, England. One third of the council was up for election and the Conservative party stayed in overall control of the council.
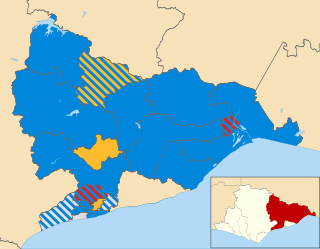
The 2011 Rother District Council election took place on 5 May 2011 to elect members of Rother District Council in East Sussex, England. The whole council was up for election and the Conservative party stayed in overall control of the council.
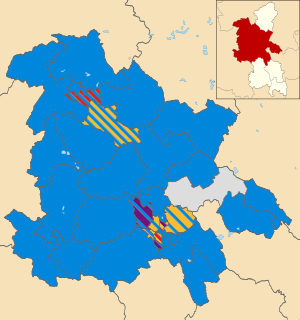
The 2015 Aylesbury Vale District Council election took place on 7 May 2015 to elect members of Aylesbury Vale District Council in Buckinghamshire, England. The whole council was up for election with boundary changes since the last election in 2011. The Conservative party remained in overall control of the council.
The 2015 Christchurch Borough Council election took place on 7 May 2015 to elect members of Christchurch Borough Council in Dorset, England. The whole council was up for election and the Conservative party stayed in overall control of the council.
The 2015 Wychavon District Council election took place on 7 May 2015 to elect members of Wychavon District Council in Worcestershire, England. The whole council was up for election and the Conservative party stayed in overall control of the council.
The 2007 West Oxfordshire District Council election took place on 3 May 2007 to elect members of West Oxfordshire District Council in Oxfordshire, England. One third of the council was up for election and the Conservative party stayed in overall control of the council.
The 2014 West Oxfordshire District Council election took place on 22 May 2014 to elect members of West Oxfordshire District Council in Oxfordshire, England. One third of the council was up for election and the Conservative party stayed in overall control of the council.
The 2015 West Oxfordshire District Council election took place on 22 May 2015 to elect members of West Oxfordshire District Council in Oxfordshire, England. One third of the council was up for election and the Conservative party stayed in overall control of the council.
The 2011 South Oxfordshire District Council election was held on 5 May 2011 to elect members of South Oxfordshire District Council in England. This was on the same day as other local elections.